Reports

- Global Locations -

Headquarters

Future Market Insights, Inc.

Christiana Corporate, 200
Continental Drive, Suite 401,
Newark, Delaware - 19713,
United States

T: +1-845-579-5705

Americas

Future Market Insights, Inc.

616 Corporate Way, Suite 2-9018,
Valley Cottage, NY 10989, United States

T: +1-347-918-3531

MEA

Future Market Insights

1602-6 Jumeirah Bay X2 Tower, Plot No: JLT-PH2-X2A,
Jumeirah Lakes Towers, Dubai,
United Arab Emirates

Europe

Future Market Insights

3rd Floor, 207 Regent Street,
W1B 3HH London
United Kingdom

T: + 44 (0) 20 8123 9659
D: +44 (0) 20 3287 4268

Asia Pacific

Future Market Insights

IndiaLand Global Tech Park, Unit UG-1, Behind Grand HighStreet, Phase 1, Hinjawadi, MH, Pune – 411057, India

Neuroendocrine Carcinoma Treatment Market Snapshot (2022-2029)

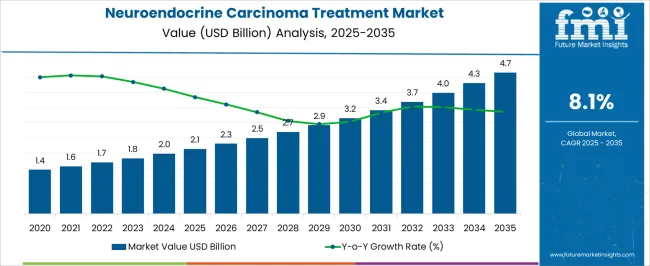
[224 Pages Report] The Global Neuroendocrine Carcinoma Treatment market is set to record a market value of U.S$ 1.7 Billion in the year 2022 with a CAGR of 8.0% which indicates a positive market growth over the forecast period.

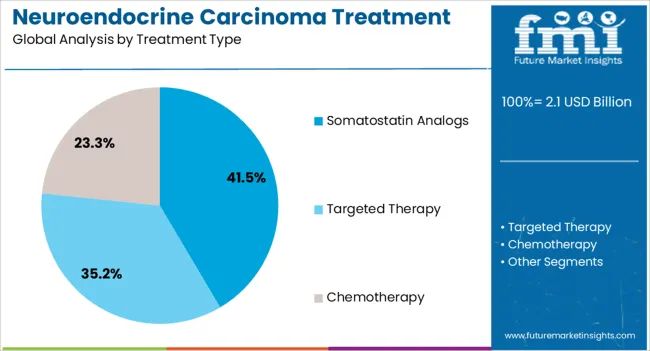
As projected by Future Market Insights, the somatostatin analogs by treatment type are expected to witness a market value of U.S$ 1.0 Billion, which accounts for more than half of the total neuroendocrine carcinoma treatment market, in the year 2022.

Neuroendocrine Carcinoma Treatment Market Outlook:

Data Points Market Insights
Market Value 2022 USD 1.7 Billion
Market Value 2029 USD 2.9 Billion
CAGR 2022 to 2029 8.0%
Key Players The key players are Pfizer Inc., Novartis AG, Chiasma Inc., Ipsen, Abbvie Inc., Valeant Pharmaceuticals International Inc., Jubilant Life Sciences Ltd., Teva Pharmaceutical Industries Ltd, F. Hoffmann-La Roche Ltd, Advanced Accelerator Applications, Mateon Therapeutics, Inc., Lexicon Pharmaceuticals, Inc., Isotopen Technologien München AGGlobal, Hutchison China MediTech Ltd, Amgen Inc, Celgene Corporation
Share of Top 5 Countries 54.2%

The increasing incidence rate of cancer disease, increasing product approval, incorporation of artificial intelligence for treating, diagnosing disease, and awareness campaigns by governments for early detection are the primary factors boosting the development of the neuroendocrine carcinoma treatment market.

Moreover, the number of ongoing studies in clinical development in immuno-oncology were early phase studies which is growing rapidly offering high growth opportunities for the numerous players in this market.

Neuroendocrine Carcinoma Treatment market holds nearly 1.2% market value share of the US$ 144.7 Bn Cancer treatment market in 2021. In addition, collaborative efforts and initiatives to identify therapies for difficult-to-treat illnesses and emerging trend of exploring next-generation sequencing techniques are expected to lead to rapid growth in the neuroendocrine carcinoma treatment market.

Don't pay for what you don't need

Customize your report by selecting specific countries or regions and save 30%!

How The Market Progressed Till June 2022?

Particulars Details
H1, 2021 7.71%
H1, 2022 Projected 7.99%
H1, 2022 Outlook 7.89%
BPS Change - H1, 2022 (O) - H1, 2022 (P) (-) 10 ↓
BPS Change - H1, 2022 (O) H1, 2021 (+) 18 ↑

According to Future Market Insights Analysis, the global neuroendocrine carcinoma market observed an increased change in the Basis Point Share (BPS) by nearly 18 from H1-2021 to H1- 2022 (O). This was majorly due to the development of biological markers for neuroendocrine tumors, increasing prevalence of neuroendocrine tumors, and presence of established diagnostic techniques for early disease detection.

The key factors boosting the demand for neuroendocrine carcinoma treatment are ongoing R&D initiatives in detection techniques, such as, Ga labelled radionucleotide treatments and radiofrequency ablation techniques. This will result in rapid growth of this market. The variation between the BPS values observed within this market in H1, 2022 - Outlook over H1, 2022 Projected reflects a decline of 10 BPS units.

Conversely, stringent government regulations, associated side effects of treatment, as well as late diagnosis of disease indication, will restrain the growth of neuroendocrine carcinoma market. Additionally, the market for neuroendocrine carcinoma is also being held back by high capital investments and low benefit-cost ratios for biomarkers and orphan medicines.

2012-2021 Neuroendocrine Carcinoma Treatment Market Demand Outlook Compared to 2022-2029 forecast

Sales of neuroendocrine carcinoma treatment grew at a CAGR of 6.6% between 2012 and 2021.

Immunotherapy is more effective and less toxic compared to traditional therapy. Awareness campaigns by governments for early detection and increasing research funding are major drivers for neuroendocrine carcinoma treatment market.

Treatments are based on destroying the cancer cells by poisoning them (chemotherapy), burning them (radiation), or removing them (surgery). One of the possible benefits of immunotherapy is that it has the potential not to be as toxic as radiation, chemotherapy, and surgery.  Immunotherapy offers a different mode of attack on the tumor and high adoption of this potential new treatment in the fight against cancer by both patients and doctors alike, will drive the demand for this market.

Neuroendocrine Carcinoma Treatment Market

Moreover, in order to reduce death and disease rate, governments in developed and emerging countries are guiding awareness campaigns to inspire people to early diagnosis of cancer, which in turn is expected to increase the pool of patients for various immunotherapies. This factor drives the demand in near future.

Considering this, FMI expects the global neuroendocrine carcinoma treatment market to grow at a CAGR of 8.0% through 2029.

Which Factors Are Restraining Demand for Neuroendocrine Carcinoma Treatment?

Manufacturing challenges impacting product availability, no price control and high cost of development leading to limited players are the key factors restraining the market growth over the forecast period.

The production and technology transfer is difficult as immunological drugs are very difficult to handle and require optimum environment, otherwise these drugs get disintegrated. Moreover, small biotech companies involved in this market have low level of capacity and infrastructure for production which is restraining the market growth.

In addition, price is a huge issue for the common masses due to limited government support for cancer treatment and limited insurance coverage. Lack of social health insurance and limited private health insurance schemes is a major factor restraining cancer service uptake.

Sabyasachi Ghosh
Sabyasachi Ghosh

Principal Consultant

Talk to Analyst

Find your sweet spots for generating winning opportunities in this market.

What is the Impact of the COVID-19 Crisis on the Neuroendocrine Carcinoma Treatment Market

COVID-19 has had slow negative impact on this market as pandemic has severely impacted health services for other disease such as cancer, hypertension, diabetes management, and cardiovascular emergencies. Selective procedures such as orthopedic joint replacement have also been impacted. The shifted focus of healthcare professionals from these diseases to address the COVID-19 criticality has negatively impacted the overall healthcare industry.

For life sciences research, the impact of COIVD-19 was prominent and it halted research activities and curtailing the progress of most research and academic institutes, clinical research institutions, etc. Many of the research institutes got redirected towards COVID-19 research, in order to combat the fast-progressing virus.

Country-wise Insights

What Makes the U.S. a Large Market for Neuroendocrine Carcinoma Treatment?

The U.S. is estimated to account for around 80.1% of the North America neuroendocrine carcinoma treatment market in 2022.  

The dominant share of U.S. can mainly be owed to the high adoption of digital platform by U.S population, support from organizations in enhancing cancer treatment, and increasing discretionary funding for cancer research in the country.

Government in developed countries such as the U.S., have raised funds for cancer research to aid in the diagnosis and treatment. Clinical trials are funded by governments to support companies in developing effective treatment for cancer

In April 2021, The American Institute for Cancer Research has funded nearly $110 million for research continued with federal government investment in cancer research which is the key to ensuring a future without cancer. NCI do clinical trials on cancer patients who require treatment of cancer.

Additionally, factors such as government awareness program for cancer, are expected to drive the market growth.

Why is Germany Considered a Lucrative Neuroendocrine Carcinoma Treatment Market?

Germany is estimated to account for 21.7% of the Western Europe Neuroendocrine Carcinoma Treatment market in 2022.

Germany is expected to lead the market owing to technological advancements, rise in incidence of cancer and huge research and development facilities.

The ratio of new drug approvals for immunotherapy-based treatment as compared to standard treatment has consistently increased in the last 5 years due to extensive research and development activities in Germany. Moreover, rise in cancer incidence can boost the demand in country. For instances, As per World Health Organization 2021 data, In Germany, 6.9 million were the number of positive cases of cancer and 109,700 for the number of deaths.

What are the Factors Fueling the Demand for Neuroendocrine Carcinoma Treatment in China?

The neuroendocrine carcinoma treatment market in China is estimated to be worth US$ 65.3 Mn in 2022 in the global market.

Increasing number of clinical trials undertaken and increasing formation of professional neuroendocrine neoplasm (NEN) is driving demand in china. An increasing number of experts from NEN- related disciplines and fields have gradually gathered together and formed several professional NEN study groups. Chinese Study Group for Neuroendocrine Tumors (CSNET) have experts in various fields, such as medical pathology, nuclear medicine, oncology, gastroenterology, surgery, endocrinology, radiology. All these factors can drive demand in china market.

In March 2017, Hutchison China MediTech Limited announced that it has initiated a Phase II study of sulfatinib in second-line biliary tract cancer patients in China due to high population ease of clinical trial.

How will the Neuroendocrine Carcinoma Treatment Market Expand across France?

Demand for neuroendocrine carcinoma treatment in France is expected to grow at market share of 20.1% of the total Western European market. Clinical trial partnership helps to leverage on individuals core competencies and thus helps to speed up the clinical trial process. The partnership is expected to help both companies to explore the potential of the molecule in comparatively less time. This helps in gaining traction in France market.

Get the data you need at a Fraction of the cost

Personalize your report by choosing insights you need
and save 40%!

Category-wise Insights

Demand for Gastric Neuroendocrine Tumors continue gaining Traction

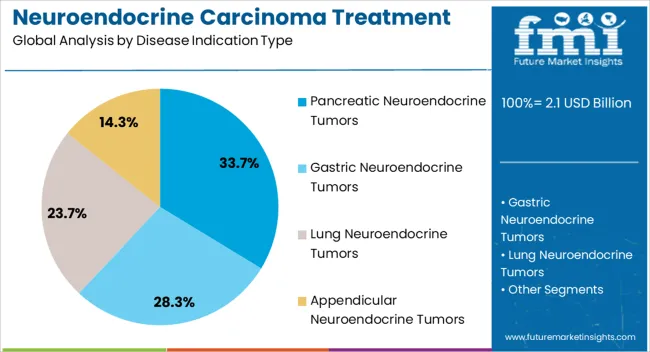
By Indication, gastric neuroendocrine tumors is anticipated to hold the maximum share of 46.8% in 2022.

Gastrointestinal carcinoid tumors is cancer that forms in the lining of the gastrointestinal (GI) tract and can occur in patients due to unhealthy lifestyle and improper eating habits. More number of patient is seen for gastric neuroendocrine tumors so there is growing popularity and demand leading this segment to take the highest share.

Why Somatostatin Analogs will hold the most of the market share?

By Treatment Type, Somatostatin analogs will lead the market and is projected to account for 61.2% of the total market revenue share in 2022.

Limited efficacy and significant toxicity of conventional chemotherapy an innovative non-cytotoxic and novel cytotoxic agents methodologies to cancer treatment are being developed. Among the various hormonal agent somatostatin analogs is showing promising results so they are highly used. Due to its advance quality, it is highly adopted, thereby, boosting the market growth.

Why Hospitals projected maximum growth in the Neuroendocrine Carcinoma Treatment Market?

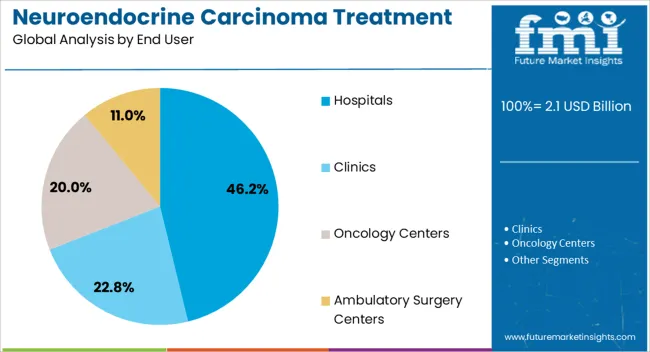
By End User, hospitals are anticipated to hold the maximum share of 45.9% in 2022.

The growing demand for diagnosis and treatment for cancer and high number of walk in patient in hospitals for many disorders leads to the growing market share of hospital. Factors availability of emergency care to the patient and wide treatment facility available for various chronic diseases is easily done in big hospitals which increases the patient preference. Hence, driving the market.

Competitive Landscape

Companies operating in the neuroendocrine carcinoma treatment market are fragmented by nature, with a presence of few players. These players are involved in a number of strategic alliances. The agreement and system automation accelerates the manufacturer’s strategy to capitalize on the market share and capture the significant share of market. Some of the recent instances include:

  • In December 2020, Pfizer Inc. and Post Era announced a strategic partnership with the goal of accelerating drug discovery by developing a platform technology based on generative chemistry.
  • In January 2021, acquisition of operations of Aspen in Japan. This acquisition strengthened Sandoz's position in world market of off-patent medicines and generic drugs.

Scope of the Report

Attribute Details
Forecast Period 2022 to 2029
Historical Data Available for 2012 to 2021
Market Analysis USD Billion for Value
Key Countries Covered USA, Canada, Brazil, Mexico, Argentina, Germany, UK, France, Italy, Spain, Russia, Nordic, China, Japan, South Korea, India,  Indonesia, Malaysia, Thailand, Australia, New Zealand, GCC Countries, South Africa, Turkey
Key Segments Covered Disease Indication, Treatment Type, End User and Region
Key Companies Profiled
  • Pfizer Inc.
  • Novartis AG
  • Chiasma Inc.
  • Ipsen
  • Abbvie Inc.
  • Valeant Pharmaceuticals International Inc.
  • Jubilant Life Sciences Ltd.
  • Teva Pharmaceutical Industries Ltd
  • F. Hoffmann-La Roche Ltd
  • Advanced Accelerator Applications
  • Mateon Therapeutics, Inc.
  • Lexicon Pharmaceuticals, Inc.
  • Isotopen Technologien München AGGlobal
  • Hutchison China MediTech Ltd
  • Amgen Inc
  • Celgene Corporation
Report Coverage Market Forecast, Competition Intelligence, DROT Analysis, Market Dynamics and Challenges, Strategic Growth Initiatives
Customization & Pricing Available upon Request

Neuroendocrine Carcinoma Treatment Market by Category

By Indication:

  • Gastric Neuroendocrine Tumors
  • Lung Neuroendocrine Tumors
  • Pancreatic Neuroendocrine Tumors
  • Appendicular Neuroendocrine Tumors

By Treatment Type:

  • Somatostatin Analogs
  • Targeted Therapy
    • Tyrosine Kinase Inhibitors
    • mTOR Inhibitors
  • Chemotherapy
    • Antimetabolites
    • Alkylating Agents
    • Natural Products

By End User:

  • Hospitals
  • Clinics
  • Oncology Centers
  • Ambulatory Surgery Centers

By Region:

  • North America
  • Latin America
  • Western Europe
  • Eastern Europe
  • APEJ
  • Japan
  • Middle-East & Africa

Frequently Asked Questions

How much is the Neuroendocrine Carcinoma Treatment market currently worth?

The global neuroendocrine carcinoma treatment market is worth US$ 1.6 Bn in 2021 and is set to expand 1.5X over the forecast years.

What was last 9 year market CAGR?

The sales of neuroendocrine carcinoma treatment in the market have grown at a CAGR of nearly 6.6% between 2012 and 2021.

What will be demand outlook/sales forecast of Neuroendocrine Carcinoma Treatment market?

The neuroendocrine carcinoma treatment market is expected to reach US$ 2.9 Bn by the end of 2029 with sales revenue expected to register CAGR of 8.0% over the forecast period.

Which is the most lucrative market for Neuroendocrine Carcinoma Treatment market?

North America currently holds the largest market share in the neuroendocrine carcinoma treatment. North America currently holds 37.6% in 2022 of the global market share in neuroendocrine carcinoma treatment market with U.S. being the leading contributor in this region.

At what percentage Neuroendocrine Carcinoma Treatment market is expected to register growth in Western Europe?

Demand of neuroendocrine carcinoma treatment market is expected to register growth in Western Europe with CAGR of 7.6%.

What are key trends driving sales of Neuroendocrine Carcinoma Treatment?

Increasing number of clinical trials in early phase development, identifying new solutions for fighting cancer, robust clinical pipeline and recent regulatory approvals prompting interest are key trends driving sales of neuroendocrine carcinoma treatment market across the globe.

What are the top 5 countries driving demand for Neuroendocrine Carcinoma Treatment market?

US, Canada, Japan, Germany, and France. Are the top 5 countries that are driving the demand for neuroendocrine carcinoma treatment market

Which are leading companies of Neuroendocrine Carcinoma Treatment market?

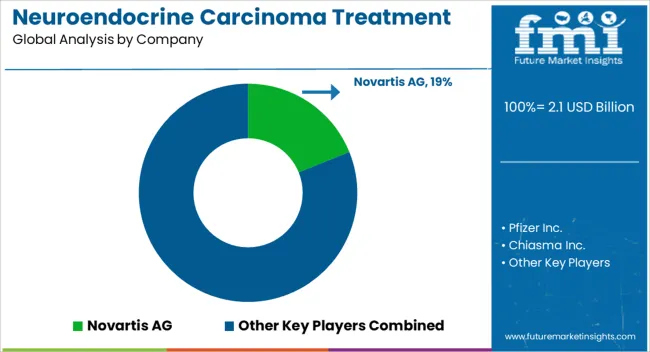
Leading companies of neuroendocrine carcinoma treatment are Pfizer Inc., Novartis AG, Chiasma Inc., Ipsen, Abbvie Inc., Valeant Pharmaceuticals International Inc., Jubilant Life Sciences Ltd., Teva Pharmaceutical Industries Ltd, F. Hoffmann-La Roche Ltd, Advanced Accelerator Applications, Mateon Therapeutics, Inc., Lexicon Pharmaceuticals, Inc., Isotopen Technologien München AGGlobal, Hutchison China MediTech Ltd, Amgen Inc, and Celgene Corporation.

Table of Content

1. Executive Summary

A gist of the report, highlighting the key takeaways

    1.1. Market Overview

    1.2. Market Analysis

    1.3. FMI Analysis and Recommendations

    1.4. Wheel of Fortune

2. Market Introduction

A definition of Neuroendocrine Carcinoma market taxonomy

    2.1. Market Taxonomy

    2.2. Market Definition

    2.3. Market Overview

3. Neuroendocrine Carcinoma Market View Point

    3.1. Macro-Economic Factors 

    3.2. Opportunity Analysis

    3.3. Neuroendocrine Carcinoma Pipeline Snapshot 

    3.4. Neuroendocrine Carcinoma Reimbursement Scenario

    3.5. Neuroendocrine Carcinoma Regulations

    3.6. Neuroendocrine Carcinoma Epidemiology

4. North America Neuroendocrine Carcinoma Market Analysis 2012–2021 and Forecast 2022–2029

Analysis highlighting historical trends, current market value, and future projections on the basis of key segments

    4.1. Introduction

    4.2. Regional Market Dynamics

        4.2.1. Drivers

        4.2.2. Restraints

        4.2.3. Trends

    4.3. Historical Market Size (US$ Mn) By Country, 2012-2021

        4.3.1. U.S.

        4.3.2. Canada

    4.4. Market Size (US$ Mn) Forecast By Country, 2022-2029

        4.4.1. U.S.

        4.4.2. Canada

    4.5. Historical Market Size (US$ Mn) Analysis By Disease Indication , 2012–2021

        4.5.1. Gastric Neuroendocrine Tumors

        4.5.2. Lung Neuroendocrine Tumors

        4.5.3. Pancreatic Neuroendocrine Tumors

        4.5.4. Appendiceal Neuroendocrine Tumors

    4.6. Market Size (US$ Mn) Forecast By Disease Indication , 2022–2029

        4.6.1. Gastric Neuroendocrine Tumors

        4.6.2. Lung Neuroendocrine Tumors

        4.6.3. Pancreatic Neuroendocrine Tumors

        4.6.4. Appendiceal Neuroendocrine Tumors

    4.7. Historical Market Size (US$ Mn) Analysis By Treatment Type , 2012–2021

        4.7.1. Chemotherapy 

        4.7.2. Antimetabolites

        4.7.3. Alkylating agents

        4.7.4. Natural Products

        4.7.5. Targeted Therapy

        4.7.6. Tyrosine Kinase Inhibitor

        4.7.7. mTOR Inhibitor

        4.7.8. Somatostatin Analogs 

    4.8. Market Size (US$ Mn) and Forecast, By Treatment Type , 2022–2029

        4.8.1. Chemotherapy 

        4.8.2. Antimetabolites

        4.8.3. Alkylating agents

        4.8.4. Natural Products

        4.8.5. Targeted Therapy

        4.8.6. Tyrosine Kinase Inhibitor

        4.8.7. mTOR Inhibitor

        4.8.8. Somatostatin Analogs 

    4.9. Historical Market Size (US$ Mn) Analysis By End User , 2012–2021

        4.9.1. Hospitals

        4.9.2. Clinics

        4.9.3. Oncology Centers 

        4.9.4. Ambulatory Surgery Centers 

    4.10. Market Size (US$ Mn) and Forecast, By End User , 2022–2029

        4.10.1. Hospitals

        4.10.2. Clinics

        4.10.3. Oncology Centers 

        4.10.4. Ambulatory Surgery Centers 

    4.11. Market Attractiveness Analysis

        4.11.1. By Country

        4.11.2. By Disease Indication 

        4.11.3. By Treatment Type 

        4.11.4. By End User 

    4.12. Key Representative Market Participants

    4.13. Key Participants Market Presence (Intensity Map)

5. Western Europe Neuroendocrine Carcinoma Market Analysis 2012–2021 and Forecast 2022–2029

Analysis highlighting historical trends, current market value, and future projections on the basis of key segments

    5.1. Introduction

    5.2. Regional Market Dynamics

        5.2.1. Drivers

        5.2.2. Restraints

        5.2.3. Trends

    5.3. Historical Market Size (US$ Mn) By Country, 2012-2021

        5.3.1. Germany

        5.3.2. United Kingdom

        5.3.3. France

        5.3.4. Italy

        5.3.5. Spain

        5.3.6. Rest of Western Europe

    5.4. Market Size (US$ Mn) Forecast By Country, 2022-2029

        5.4.1. Germany

        5.4.2. United Kingdom

        5.4.3. France

        5.4.4. Italy

        5.4.5. Spain

        5.4.6. Rest of Western Europe

    5.5. Historical Market Size (US$ Mn) Analysis By Disease Indication , 2012–2021

        5.5.1. Gastric Neuroendocrine Tumors

        5.5.2. Lung Neuroendocrine Tumors

        5.5.3. Pancreatic Neuroendocrine Tumors

        5.5.4. Appendiceal Neuroendocrine Tumors

    5.6. Market Size (US$ Mn) Forecast By Disease Indication , 2022–2029

        5.6.1. Gastric Neuroendocrine Tumors

        5.6.2. Lung Neuroendocrine Tumors

        5.6.3. Pancreatic Neuroendocrine Tumors

        5.6.4. Appendiceal Neuroendocrine Tumors

    5.7. Historical Market Size (US$ Mn) Analysis By Treatment Type , 2012–2021

        5.7.1. Chemotherapy 

        5.7.2. Antimetabolites

        5.7.3. Alkylating agents

        5.7.4. Natural Products

        5.7.5. Targeted Therapy

        5.7.6. Tyrosine Kinase Inhibitor

        5.7.7. mTOR Inhibitor

        5.7.8. Somatostatin Analogs 

    5.8. Market Size (US$ Mn) and Forecast, By Treatment Type , 2022–2029

        5.8.1. Chemotherapy 

        5.8.2. Antimetabolites

        5.8.3. Alkylating agents

        5.8.4. Natural Products

        5.8.5. Targeted Therapy

        5.8.6. Tyrosine Kinase Inhibitor

        5.8.7. mTOR Inhibitor

        5.8.8. Somatostatin Analogs 

    5.9. Historical Market Size (US$ Mn) Analysis By End User , 2012–2021

        5.9.1. Hospitals

        5.9.2. Clinics

        5.9.3. Oncology Centers 

        5.9.4. Ambulatory Surgery Centers 

    5.10. Market Size (US$ Mn) and Forecast, By End User , 2022–2029

        5.10.1. Hospitals

        5.10.2. Clinics

        5.10.3. Oncology Centers 

        5.10.4. Ambulatory Surgery Centers 

    5.11. Market Attractiveness Analysis

        5.11.1. By Country

        5.11.2. By Disease Indication 

        5.11.3. By Treatment Type 

        5.11.4. By End User 

    5.12. Key Representative Market Participants

    5.13. Key Participants Market Presence (Intensity Map)

6. Eastern Europe Neuroendocrine Carcinoma Market Analysis 2012–2021 and Forecast 2022–2029

Analysis highlighting historical trends, current market value, and future projections on the basis of key segments

    6.1. Introduction

    6.2. Regional Market Dynamics

        6.2.1. Drivers

        6.2.2. Restraints

        6.2.3. Trends

    6.3. Historical Market Size (US$ Mn) By Country, 2012-2021

        6.3.1. Russia

        6.3.2. Poland

        6.3.3. Rest of Eastern Europe

    6.4. Market Size (US$ Mn) Forecast By Country, 2022-2029

        6.4.1. Russia

        6.4.2. Poland

        6.4.3. Rest of Eastern Europe

    6.5. Historical Market Size (US$ Mn) Analysis By Disease Indication , 2012–2021

        6.5.1. Gastric Neuroendocrine Tumors

        6.5.2. Lung Neuroendocrine Tumors

        6.5.3. Pancreatic Neuroendocrine Tumors

        6.5.4. Appendiceal Neuroendocrine Tumors

    6.6. Market Size (US$ Mn) Forecast By Disease Indication , 2022–2029

        6.6.1. Gastric Neuroendocrine Tumors

        6.6.2. Lung Neuroendocrine Tumors

        6.6.3. Pancreatic Neuroendocrine Tumors

        6.6.4. Appendiceal Neuroendocrine Tumors

    6.7. Historical Market Size (US$ Mn) Analysis By Treatment Type , 2012–2021

        6.7.1. Chemotherapy 

        6.7.2. Antimetabolites

        6.7.3. Alkylating agents

        6.7.4. Natural Products

        6.7.5. Targeted Therapy

        6.7.6. Tyrosine Kinase Inhibitor

        6.7.7. mTOR Inhibitor

        6.7.8. Somatostatin Analogs 

    6.8. Market Size (US$ Mn) and Forecast, By Treatment Type , 2022–2029

        6.8.1. Chemotherapy 

        6.8.2. Antimetabolites

        6.8.3. Alkylating agents

        6.8.4. Natural Products

        6.8.5. Targeted Therapy

        6.8.6. Tyrosine Kinase Inhibitor

        6.8.7. mTOR Inhibitor

        6.8.8. Somatostatin Analogs 

    6.9. Historical Market Size (US$ Mn) Analysis By End User , 2012–2021

        6.9.1. Hospitals

        6.9.2. Clinics

        6.9.3. Oncology Centers 

        6.9.4. Ambulatory Surgery Centers 

    6.10. Market Size (US$ Mn) and Forecast, By End User , 2022–2029

        6.10.1. Hospitals

        6.10.2. Clinics

        6.10.3. Oncology Centers 

        6.10.4. Ambulatory Surgery Centers 

    6.11. Market Attractiveness Analysis

        6.11.1. By Country

        6.11.2. By Disease Indication 

        6.11.3. By Treatment Type 

        6.11.4. By End User 

    6.12. Key Representative Market Participants

    6.13. Key Participants Market Presence (Intensity Map)

7. Latin America Neuroendocrine Carcinoma Market Analysis 2012–2021 and Forecast 2022–2029

Analysis highlighting historical trends, current market value, and future projections on the basis of key segments

    7.1. Introduction

    7.2. Regional Market Dynamics

        7.2.1. Drivers

        7.2.2. Restraints

        7.2.3. Trends

    7.3. Historical Market Size (US$ Mn) Trend Analysis By Country, 2012–2021

        7.3.1. Brazil

        7.3.2. Mexico

        7.3.3. Rest of Latin America

    7.4. Market Size (US$ Mn) Forecast By Country, 2022–2029

        7.4.1. Brazil

        7.4.2. Mexico

        7.4.3. Rest of Latin America

    7.5. Historical Market Size (US$ Mn) Analysis By Disease Indication , 2012–2021

        7.5.1. Gastric Neuroendocrine Tumors

        7.5.2. Lung Neuroendocrine Tumors

        7.5.3. Pancreatic Neuroendocrine Tumors

        7.5.4. Appendiceal Neuroendocrine Tumors

    7.6. Market Size (US$ Mn) Forecast By Disease Indication , 2022–2029

        7.6.1. Gastric Neuroendocrine Tumors

        7.6.2. Lung Neuroendocrine Tumors

        7.6.3. Pancreatic Neuroendocrine Tumors

        7.6.4. Appendiceal Neuroendocrine Tumors

    7.7. Historical Market Size (US$ Mn) Analysis By Treatment Type , 2012–2021

        7.7.1. Chemotherapy 

        7.7.2. Antimetabolites

        7.7.3. Alkylating agents

        7.7.4. Natural Products

        7.7.5. Targeted Therapy

        7.7.6. Tyrosine Kinase Inhibitor

        7.7.7. mTOR Inhibitor

        7.7.8. Somatostatin Analogs 

    7.8. Market Size (US$ Mn) and Forecast, By Treatment Type , 2022–2029

        7.8.1. Chemotherapy 

        7.8.2. Antimetabolites

        7.8.3. Alkylating agents

        7.8.4. Natural Products

        7.8.5. Targeted Therapy

        7.8.6. Tyrosine Kinase Inhibitor

        7.8.7. mTOR Inhibitor

        7.8.8. Somatostatin Analogs 

    7.9. Historical Market Size (US$ Mn) Analysis By End User , 2012–2021

        7.9.1. Hospitals

        7.9.2. Clinics

        7.9.3. Oncology Centers 

        7.9.4. Ambulatory Surgery Centers 

    7.10. Market Size (US$ Mn) and Forecast, By End User , 2022–2029

        7.10.1. Hospitals

        7.10.2. Clinics

        7.10.3. Oncology Centers 

        7.10.4. Ambulatory Surgery Centers 

    7.11. Market Attractiveness Analysis

        7.11.1. By Country

        7.11.2. By Disease Indication 

        7.11.3. By Treatment Type 

        7.11.4. By End User 

    7.12. Key Representative Market Participants

    7.13. Key Participants Market Presence (Intensity Map)

8. Asia Pacific Excluding Japan Neuroendocrine Carcinoma Market Analysis 2012–2021 and Forecast 2022–2029

Analysis highlighting historical trends, current market value, and future projections on the basis of key segments

    8.1. Introduction

    8.2. Regional Market Dynamics

        8.2.1. Drivers

        8.2.2. Restraints

        8.2.3. Trends

    8.3. Historical Market Size (US$ Mn) By Country, 2012-2021

        8.3.1. China

        8.3.2. India

        8.3.3. Australia and New Zealand

        8.3.4. ASEAN

        8.3.5. Rest of APEJ

    8.4. Market Size (US$ Mn) Forecast By Country, 2022-2029

        8.4.1. China

        8.4.2. India

        8.4.3. Australia and New Zealand

        8.4.4. ASEAN

        8.4.5. Rest of APEJ

    8.5. Historical Market Size (US$ Mn) Analysis By Disease Indication , 2012–2021

        8.5.1. Gastric Neuroendocrine Tumors

        8.5.2. Lung Neuroendocrine Tumors

        8.5.3. Pancreatic Neuroendocrine Tumors

        8.5.4. Appendiceal Neuroendocrine Tumors

    8.6. Market Size (US$ Mn) Forecast By Disease Indication , 2022–2029

        8.6.1. Gastric Neuroendocrine Tumors

        8.6.2. Lung Neuroendocrine Tumors

        8.6.3. Pancreatic Neuroendocrine Tumors

        8.6.4. Appendiceal Neuroendocrine Tumors

    8.7. Historical Market Size (US$ Mn) Analysis By Treatment Type , 2012–2021

        8.7.1. Chemotherapy 

        8.7.2. Antimetabolites

        8.7.3. Alkylating agents

        8.7.4. Natural Products

        8.7.5. Targeted Therapy

        8.7.6. Tyrosine Kinase Inhibitor

        8.7.7. mTOR Inhibitor

        8.7.8. Somatostatin Analogs 

    8.8. Market Size (US$ Mn) and Forecast, By Treatment Type , 2022–2029

        8.8.1. Chemotherapy 

        8.8.2. Antimetabolites

        8.8.3. Alkylating agents

        8.8.4. Natural Products

        8.8.5. Targeted Therapy

        8.8.6. Tyrosine Kinase Inhibitor

        8.8.7. mTOR Inhibitor

        8.8.8. Somatostatin Analogs 

    8.9. Historical Market Size (US$ Mn) Analysis By End User , 2012–2021

        8.9.1. Hospitals

        8.9.2. Clinics

        8.9.3. Oncology Centers 

        8.9.4. Ambulatory Surgery Centers 

    8.10. Market Size (US$ Mn) and Forecast, By End User , 2022–2029

        8.10.1. Hospitals

        8.10.2. Clinics

        8.10.3. Oncology Centers 

        8.10.4. Ambulatory Surgery Centers 

    8.11. Market Attractiveness Analysis

        8.11.1. By Country

        8.11.2. By Disease Indication 

        8.11.3. By Treatment Type 

        8.11.4. By End User 

    8.12. Key Representative Market Participants

    8.13. Key Participants Market Presence (Intensity Map)

9. Japan Neuroendocrine Carcinoma Market Analysis 2012–2021 and Forecast 2022–2029

Analysis highlighting historical trends, current market value, and future projections on the basis of key segments

    9.1. Introduction

    9.2. Regional Market Dynamics

        9.2.1. Drivers

        9.2.2. Restraints

        9.2.3. Trends

    9.3. Historical Market Size (US$ Mn) Analysis By Disease Indication , 2012–2021

        9.3.1. Gastric Neuroendocrine Tumors

        9.3.2. Lung Neuroendocrine Tumors

        9.3.3. Pancreatic Neuroendocrine Tumors

        9.3.4. Appendiceal Neuroendocrine Tumors

    9.4. Market Size (US$ Mn) Forecast By Disease Indication , 2022–2029

        9.4.1. Gastric Neuroendocrine Tumors

        9.4.2. Lung Neuroendocrine Tumors

        9.4.3. Pancreatic Neuroendocrine Tumors

        9.4.4. Appendiceal Neuroendocrine Tumors

    9.5. Historical Market Size (US$ Mn) Analysis By Treatment Type , 2012–2021

        9.5.1. Chemotherapy 

        9.5.2. Antimetabolites

        9.5.3. Alkylating agents

        9.5.4. Natural Products

        9.5.5. Targeted Therapy

        9.5.6. Tyrosine Kinase Inhibitor

        9.5.7. mTOR Inhibitor

        9.5.8. Somatostatin Analogs 

    9.6. Market Size (US$ Mn) and Forecast, By Treatment Type , 2022–2029

        9.6.1. Chemotherapy 

        9.6.2. Antimetabolites

        9.6.3. Alkylating agents

        9.6.4. Natural Products

        9.6.5. Targeted Therapy

        9.6.6. Tyrosine Kinase Inhibitor

        9.6.7. mTOR Inhibitor

        9.6.8. Somatostatin Analogs 

    9.7. Historical Market Size (US$ Mn) Analysis By End User , 2012–2021

        9.7.1. Hospitals

        9.7.2. Clinics

        9.7.3. Oncology Centers 

        9.7.4. Ambulatory Surgery Centers 

    9.8. Market Size (US$ Mn) and Forecast, By End User , 2022–2029

        9.8.1. Hospitals

        9.8.2. Clinics

        9.8.3. Oncology Centers 

        9.8.4. Ambulatory Surgery Centers 

    9.9. Market Attractiveness Analysis

        9.9.1. By Country

        9.9.2. By Disease Indication 

        9.9.3. By Treatment Type 

        9.9.4. By End User 

    9.10. Key Representative Market Participants

    9.11. Key Participants Market Presence (Intensity Map)

10. Middle East and Africa Neuroendocrine Carcinoma Market Analysis 2012–2021 and Forecast 2022–2029

Analysis highlighting historical trends, current market value, and future projections on the basis of key segments

    10.1. Introduction

    10.2. Regional Market Dynamics

        10.2.1. Drivers

        10.2.2. Restraints

        10.2.3. Trends

    10.3. Historical Market Size (US$ Mn) Analysis By Country, 2012–2021

        10.3.1. GCC Countries

        10.3.2. South Africa

        10.3.3. Rest of MEA

    10.4. Market Size (US$ Mn) and Forecast By Country, , 2022–2029

        10.4.1. GCC Countries

        10.4.2. South Africa

        10.4.3. Rest of MEA

    10.5. Historical Market Size (US$ Mn) Analysis By Disease Indication , 2012–2021

        10.5.1. Gastric Neuroendocrine Tumors

        10.5.2. Lung Neuroendocrine Tumors

        10.5.3. Pancreatic Neuroendocrine Tumors

        10.5.4. Appendiceal Neuroendocrine Tumors

    10.6. Market Size (US$ Mn) Forecast By Disease Indication , 2022–2029

        10.6.1. Gastric Neuroendocrine Tumors

        10.6.2. Lung Neuroendocrine Tumors

        10.6.3. Pancreatic Neuroendocrine Tumors

        10.6.4. Appendiceal Neuroendocrine Tumors

    10.7. Historical Market Size (US$ Mn) Analysis By Treatment Type , 2012–2021

        10.7.1. Chemotherapy 

        10.7.2. Antimetabolites

        10.7.3. Alkylating agents

        10.7.4. Natural Products

        10.7.5. Targeted Therapy

        10.7.6. Tyrosine Kinase Inhibitor

        10.7.7. mTOR Inhibitor

        10.7.8. Somatostatin Analogs 

    10.8. Market Size (US$ Mn) and Forecast, By Treatment Type , 2022–2029

        10.8.1. Chemotherapy 

        10.8.2. Antimetabolites

        10.8.3. Alkylating agents

        10.8.4. Natural Products

        10.8.5. Targeted Therapy

        10.8.6. Tyrosine Kinase Inhibitor

        10.8.7. mTOR Inhibitor

        10.8.8. Somatostatin Analogs 

    10.9. Historical Market Size (US$ Mn) Analysis By End User , 2012–2021

        10.9.1. Hospitals

        10.9.2. Clinics

        10.9.3. Oncology Centers 

        10.9.4. Ambulatory Surgery Centers 

    10.10. Market Size (US$ Mn) and Forecast, By End User , 2022–2029

        10.10.1. Hospitals

        10.10.2. Clinics

        10.10.3. Oncology Centers 

        10.10.4. Ambulatory Surgery Centers 

    10.11. Market Attractiveness Analysis

        10.11.1. By Country

        10.11.2. By Disease Indication 

        10.11.3. By Treatment Type 

        10.11.4. By End User 

    10.12. Key Representative Market Participants

    10.13. Key Participants Market Presence (Intensity Map)

11. Forecast Factors: Relevance and Impact

12. Forecast Assumptions

13. Competition Landscape

Profile of some of the key market players, with specific focus on business and product strategy

    13.1. Market Structure

    13.2. Competition Dashboard

    13.3. Company Profiles (Details – Overview, Financials, Strategy, Recent Developments)

        13.3.1. Pfizer Inc. 

        13.3.2. Novartis AG 

        13.3.3. Chiasma Inc. 

        13.3.4. Ipsen 

        13.3.5. Abbvie Inc. 

        13.3.6. Valeant Pharmaceuticals International Inc. 

        13.3.7. Jubilant Life Sciences Ltd. 

        13.3.8. Teva Pharmaceutical Industries Ltd 

        13.3.9. F.Hoffmann-La Roche Ltd 

        13.3.10. Advanced Accelerator Applications 

        13.3.11. Mateon Therapeutics, Inc. 

        13.3.12. Lexicon Pharmaceuticals, Inc. 

        13.3.13. Isotopen Technologien München AGGlobal 

        13.3.14. Hutchison China MediTech Ltd 

        13.3.15. Amgen Inc 

        13.3.16. Celgene Corporation 

        13.3.17. Mallinckrodt plc. 

        13.3.18. Dauntless Pharmaceuticals, Inc. 

14. Global Neuroendocrine Carcinoma Market Analysis 2012–2021 and Forecast 2022–2029, By Region

    14.1. Introduction / Key Findings

    14.2. Historical Market Size (US$ Mn) By Region

        14.2.1. North America

        14.2.2. Western Europe

        14.2.3. Eastern Europe

        14.2.4. Latin America

        14.2.5. Asia Pacific Excluding Japan

        14.2.6. Japan

        14.2.7. Middle East and Africa

    14.3. Market Size (US$ Mn) Forecast By Region

        14.3.1. North America

        14.3.2. Western Europe

        14.3.3. Eastern Europe

        14.3.4. Latin America

        14.3.5. Asia Pacific Excluding Japan

        14.3.6. Japan

        14.3.7. Middle East and Africa

    14.4. Market Attractiveness Analysis By Region

15. Global Neuroendocrine Carcinoma Market Analysis 2012–2021 and Forecast 2022–2029, By Disease Indication  

    15.1. Introduction

    15.2. Historical Market Size (US$ Mn) Analysis By Disease Indication , 2012–2021

        15.2.1. Gastric Neuroendocrine Tumors

        15.2.2. Lung Neuroendocrine Tumors

        15.2.3. Pancreatic Neuroendocrine Tumors

        15.2.4. Appendiceal Neuroendocrine Tumors

    15.3. Market Size (US$ Mn) Forecast By Disease Indication , 2022–2029

        15.3.1. Gastric Neuroendocrine Tumors

        15.3.2. Lung Neuroendocrine Tumors

        15.3.3. Pancreatic Neuroendocrine Tumors

        15.3.4. Appendiceal Neuroendocrine Tumors

    15.4. Market Attractiveness Analysis By Disease Indication  

16. Global Neuroendocrine Carcinoma Market Analysis 2012–2021 and Forecast 2022–2029, By Treatment Type 

    16.1. Introduction

    16.2. Historical Market Size (US$ Mn) Analysis By Treatment Type , 2012–2021

        16.2.1. Chemotherapy 

        16.2.2. Antimetabolites

        16.2.3. Alkylating agents

        16.2.4. Natural Products

        16.2.5. Targeted Therapy

        16.2.6. Tyrosine Kinase Inhibitor

        16.2.7. mTOR Inhibitor

        16.2.8. Somatostatin Analogs 

    16.3. Market Size (US$ Mn) and Forecast, By Treatment Type , 2022–2029

        16.3.1. Chemotherapy 

        16.3.2. Antimetabolites

        16.3.3. Alkylating agents

        16.3.4. Natural Products

        16.3.5. Targeted Therapy

        16.3.6. Tyrosine Kinase Inhibitor

        16.3.7. mTOR Inhibitor

        16.3.8. Somatostatin Analogs 

    16.4. Market Attractive Analysis By End User 

17. Global Neuroendocrine Carcinoma Market Analysis 2012–2021 and Forecast 2022–2029, By End User 

    17.1. Introduction

    17.2. Historical Market Size (US$ Mn) Analysis By End User , 2012–2021

        17.2.1. Hospitals

        17.2.2. Clinics

        17.2.3. Oncology Centers 

        17.2.4. Ambulatory Surgery Centers 

    17.3. Market Size (US$ Mn) and Forecast, By End User , 2022–2029

        17.3.1. Hospitals

        17.3.2. Clinics

        17.3.3. Oncology Centers 

        17.3.4. Ambulatory Surgery Centers 

    17.4. Market Attractive Analysis By End User 

18. Global Neuroendocrine Carcinoma Market Analysis 2012–2021 and Forecast 2022–2029

    18.1. Market Size and Y-o-Y Growth

    18.2. Absolute $ Opportunity

19. Assumptions and Acronyms Used

A glossary of assumption and acronyms used in the report

20. Research Methodology

Don't pay for what you don't need

Customize your report by selecting specific countries or regions and save 30%!

List of Tables

Table 01: North America Neuroendocrine Carcinoma Market Size (US$ Mn) Trend Analysis 2012–2021 and Forecast 2022–2029, By Country

Table 02: North America Neuroendocrine Carcinoma Market Size (US$ Mn) Trend Analysis 2012–2021 and Forecast 2022–2029, By Disease Indication

Table 03: North America Neuroendocrine Carcinoma Market Size (US$ Mn) Trend Analysis 2012–2021 and Forecast 2022–2029, By Treatment Type

Table 04: North America Neuroendocrine Carcinoma Market Size (US$ Mn) Trend Analysis 2012–2021 and Forecast 2022–2029, By End User 

Table 05: Western Europe Neuroendocrine Carcinoma Market Size (US$ Mn) Trend Analysis 2012–2021 and Forecast 2022–2029, By Country

Table 06: Western Europe Neuroendocrine Carcinoma Market Size (US$ Mn) Trend Analysis 2012–2021 and Forecast 2022–2029, By Disease Indication

Table 07: Western Europe Neuroendocrine Carcinoma Market Size (US$ Mn) Trend Analysis 2012–2021 and Forecast 2022–2029, By Treatment Type

Table 08: Western Europe Neuroendocrine Carcinoma Market Size (US$ Mn) Trend Analysis 2012–2021 and Forecast 2022–2029, By End User 

Table 09: Eastern Europe Neuroendocrine Carcinoma Market Size (US$ Mn) Trend Analysis 2012–2021 and Forecast 2022–2029, By Country

Table 10: Eastern Europe Neuroendocrine Carcinoma Market Size (US$ Mn) Trend Analysis 2012–2021 and Forecast 2022–2029, By Disease Indication

Table 11: Eastern Europe Neuroendocrine Carcinoma Market Size (US$ Mn) Trend Analysis 2012–2021 and Forecast 2022–2029, By Treatment Type

Table 12: Eastern Europe Neuroendocrine Carcinoma Market Size (US$ Mn) Trend Analysis 2012–2021 and Forecast 2022–2029, By End User 

Table 13: APEJ Neuroendocrine Carcinoma Market Size (US$ Mn) Trend Analysis 2012–2021 and Forecast 2022–2029, By Country

Table 14: APEJ Neuroendocrine Carcinoma Market Size (US$ Mn) Trend Analysis 2012–2021 and Forecast 2022–2029, By Disease Indication

Table 15: APEJ Neuroendocrine Carcinoma Market Size (US$ Mn) Trend Analysis 2012–2021 and Forecast 2022–2029, By Treatment Type

Table 16: APEJ Neuroendocrine Carcinoma Market Size (US$ Mn) Trend Analysis 2012–2021 and Forecast 2022–2029, By End User 

Table 17: Japan Neuroendocrine Carcinoma Market Size (US$ Mn) Trend Analysis 2012–2021 and Forecast 2022–2029, By Disease Indication

Table 18: Japan Neuroendocrine Carcinoma Market Size (US$ Mn) Trend Analysis 2012–2021 and Forecast 2022–2029, By Treatment Type

Table 19: Japan Neuroendocrine Carcinoma Market Size (US$ Mn) Trend Analysis 2012–2021 and Forecast 2022–2029, By End User 

Table 20: Latin America Neuroendocrine Carcinoma Market Size (US$ Mn) Trend Analysis 2012–2021 and Forecast 2022–2029, By Country

Table 21: Latin America Neuroendocrine Carcinoma Market Size (US$ Mn) Trend Analysis 2012–2021 and Forecast 2022–2029, By Disease Indication

Table 22: Latin America Neuroendocrine Carcinoma Market Size (US$ Mn) Trend Analysis 2012–2021 and Forecast 2022–2029, By Treatment Type

Table 23: Latin America Neuroendocrine Carcinoma Market Size (US$ Mn) Trend Analysis 2012–2021 and Forecast 2022–2029, By End User 

Table 24: MEA Neuroendocrine Carcinoma Market Size (US$ Mn) Trend Analysis 2012–2021 and Forecast 2022–2029, By Country

Table 25: MEA Neuroendocrine Carcinoma Market Size (US$ Mn) Trend Analysis 2012–2021 and Forecast 2022–2029, By Disease Indication

Table 26: MEA Neuroendocrine Carcinoma Market Size (US$ Mn) Trend Analysis 2012–2021 and Forecast 2022–2029, By Treatment Type

Table 27: MEA Neuroendocrine Carcinoma Market Size (US$ Mn) Trend Analysis 2012–2021 and Forecast 2022–2029, By End User 

Table 28: Global Neuroendocrine Carcinoma Market Size (US$ Mn) Trend Analysis 2012–2021 and Forecast 2022–2029, By Disease Indication

Table 29: Global Neuroendocrine Carcinoma Market Size (US$ Mn) Trend Analysis 2012–2021 and Forecast 2022–2029, By Disease Indication

Table 30: Global Neuroendocrine Carcinoma Market Size (US$ Mn) Trend Analysis 2012–2021 and Forecast 2022–2029, By Treatment Type

Table 31: Global Neuroendocrine Carcinoma Market Size (US$ Mn) Trend Analysis 2012–2021 and Forecast 2022–2029, By End User
Sabyasachi Ghosh
Sabyasachi Ghosh

Principal Consultant

Talk to Analyst

Find your sweet spots for generating winning opportunities in this market.

List of Charts

Figure 01: North America Neuroendocrine Carcinoma Market Size Analysis, 2012-2021

Figure 02: North America Neuroendocrine Carcinoma Market Forecast, 2022–2029

Figure 03: North America Neuroendocrine Carcinoma Market Attractiveness Analysis, By Disease Indication

Figure 04: North America Neuroendocrine Carcinoma Market Attractiveness Analysis, By Treatment Type

Figure 05: North America Neuroendocrine Carcinoma Market Attractiveness Analysis, By End User 

Figure 06: Latin America Neuroendocrine Carcinoma Market Attractiveness Analysis By Country, 2022–2025

Figure 07: Western Europe Neuroendocrine Carcinoma Market Size Analysis, 2012-2021

Figure 08: Western Europe Neuroendocrine Carcinoma Market Forecast, 2022–2029

Figure 09: Western Europe Neuroendocrine Carcinoma Market Attractiveness Analysis, By Disease Indication

Figure 10: Western Europe Neuroendocrine Carcinoma Market Attractiveness Analysis, By Treatment Type

Figure 11: Western Europe Neuroendocrine Carcinoma Market Attractiveness Analysis, By End User 

Figure 12: Latin America Neuroendocrine Carcinoma Market Attractiveness Analysis By Country, 2022–2025

Figure 13: Eastern Europe  Neuroendocrine Carcinoma Market Size Analysis, 2012-2021

Figure 14: Eastern Europe  Neuroendocrine Carcinoma Market Forecast, 2022–2029

Figure 15: North America Neuroendocrine Carcinoma Market Attractiveness Analysis, By Disease Indication

Figure 16: North America Neuroendocrine Carcinoma Market Attractiveness Analysis, By Treatment Type

Figure 17: North America Neuroendocrine Carcinoma Market Attractiveness Analysis, By End User 

Figure 18: Latin America Neuroendocrine Carcinoma Market Attractiveness Analysis By Country, 2022–2025

Figure 19: APEJ Neuroendocrine Carcinoma Market Size Analysis, 2012-2021

Figure 20: APEJ Neuroendocrine Carcinoma Market Forecast, 2022–2029

Figure 21: APEJ Neuroendocrine Carcinoma Market Attractiveness Analysis, By Disease Indication

Figure 22: APEJ Neuroendocrine Carcinoma Market Attractiveness Analysis, By Treatment Type

Figure 23: APEJ Neuroendocrine Carcinoma Market Attractiveness Analysis, By End User 

Figure 24: Latin America Neuroendocrine Carcinoma Market Attractiveness Analysis By Country, 2022–2025

Figure 25: Japan Neuroendocrine Carcinoma Market Size Analysis, 2012-2021

Figure 26: Japan Neuroendocrine Carcinoma Market Forecast, 2022–2029

Figure 27: Japan Neuroendocrine Carcinoma Market Attractiveness Analysis, By Disease Indication

Figure 28: Japan Neuroendocrine Carcinoma Market Attractiveness Analysis, By Treatment Type

Figure 29: Japan Neuroendocrine Carcinoma Market Attractiveness Analysis, By End User 

Figure 30: Latin America Neuroendocrine Carcinoma Market Size Analysis, 2012-2021

Figure 31: Latin America Neuroendocrine Carcinoma Market Forecast, 2022–2029

Recommendations

Healthcare

Neurostimulation Market

Published : October 2023

Healthcare

Neurointerventional Device Market

Published : October 2023

Healthcare

MRI-Safe Neurostimulation Systems Market

Published : August 2023

Healthcare

Neurodegenerative Disease Market

Published : June 2022

Explore Healthcare Insights

View Reports

Neuroendocrine Carcinoma Treatment Market