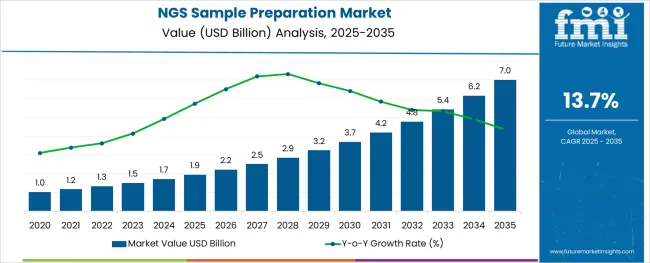
The NGS Sample Preparation Market is estimated to be valued at USD 1.9 billion in 2025 and is projected to reach USD 7.0 billion by 2035, registering a compound annual growth rate (CAGR) of 13.7% over the forecast period.
The NGS sample preparation market is witnessing significant advancements as genomics continues to influence diagnostics, personalized medicine, and clinical research. Rising demand for high-throughput sequencing, combined with the growing availability of genomic data, is accelerating the development of optimized, error-free sample preparation protocols.
Key drivers such as cost reduction in sequencing technologies, government funding for genomic projects, and increasing focus on rare disease diagnostics are contributing to the expansion of the market. Automation, miniaturization, and integration of preparation workflows are being prioritized to reduce turnaround times and improve reproducibility.
Moreover, collaborations between academic institutions and biotech firms are enabling technology standardization and driving adoption in both clinical and research environments. As regulatory compliance for NGS in clinical applications strengthens, sample prep solutions with built-in quality control and multiplexing capabilities are expected to gain wider traction across end-use domains.
The market is segmented by Type, Application, and End Use and region. By Type, the market is divided into Sequencing by Synthesis (SBS), Ion Semiconductor Sequencing, Single Molecule Real Time (SMRT) Sequencing, and Nanopore Sequencing. In terms of Application, the market is classified into Diagnostics, Drug Discovery, Biomarker Discovery, Precision Medicine, Agriculture and Animal Research, and Other Application.
Based on End Use, the market is segmented into Research Institutes, Biopharmaceutical Companies, Hospitals, CMOs, and CROs. Regionally, the market is classified into North America, Latin America, Western Europe, Eastern Europe, Balkan & Baltic Countries, Russia & Belarus, Central Asia, East Asia, South Asia & Pacific, and the Middle East & Africa.
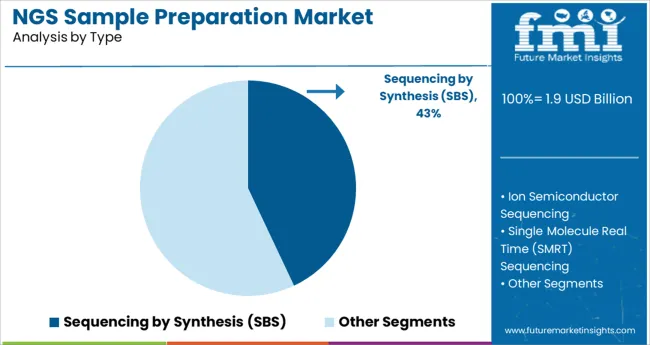
Sequencing by synthesis (SBS) is projected to account for 43.0% of the total revenue share in the NGS sample preparation market in 2025, establishing it as the leading technology segment. This dominance is being driven by SBS’s high base-calling accuracy, scalability, and broad compatibility with a wide range of DNA and RNA applications.
The process supports massively parallel sequencing with robust performance metrics, which has made it the preferred method in both research and diagnostic workflows. Strong manufacturer backing, continual chemistry enhancements, and availability of ready-to-use kits have further solidified its position.
SBS also enables efficient detection of genetic variants, copy number changes, and rare mutations capabilities that are increasingly demanded in precision medicine. Its adoption is expected to remain high as sequencing moves from research-heavy environments into regulated clinical settings.
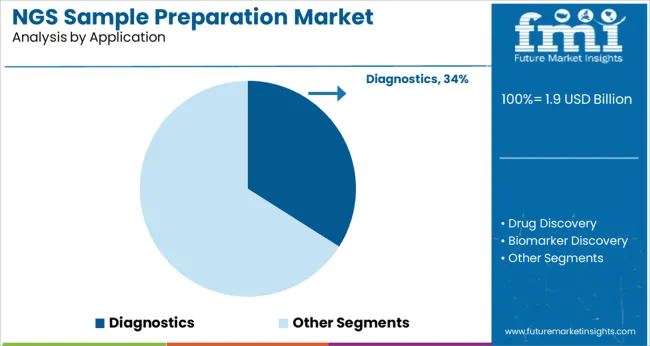
Diagnostics is expected to represent 34.0% of the overall NGS sample preparation market revenue in 2025, positioning it as the dominant application area. This growth is being fueled by the rising need for early and accurate disease detection, especially in oncology, infectious diseases, and genetic disorders.
The integration of NGS into clinical diagnostics workflows is gaining pace due to regulatory support, falling sequencing costs, and improvements in sample prep technologies that enable high-quality library preparation from low-input or degraded samples. Enhanced sensitivity and specificity in detecting clinically relevant variants are making NGS an indispensable tool for next-generation diagnostics.
As companion diagnostics and pharmacogenomics expand, demand for streamlined, automated sample preparation platforms tailored to clinical standards is expected to intensify.
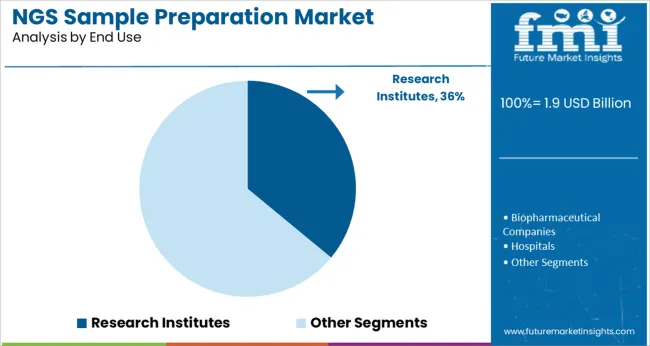
Research institutes are anticipated to account for 36.0% of the market revenue in 2025, making them the leading end-use segment in the NGS sample preparation landscape. This prominence is supported by the continued involvement of academic and government-funded institutions in large-scale sequencing initiatives, including human genome mapping, agricultural genomics, and infectious disease surveillance.
These institutes typically perform high-throughput sequencing with varied sample types, necessitating robust and flexible preparation systems. Access to grant-based funding and collaborative R&D ecosystems enables adoption of innovative technologies and pilot-scale solutions.
Additionally, research institutes often serve as validation sites for new sample prep protocols, influencing standardization and downstream commercial deployment. Their central role in translational research ensures steady demand for precise, reproducible, and high-yield preparation workflows.
Increasing prevalence of genetic disorders is driving the overall demand for NGS sample preparation.
Furthermore, rising need for the personalized medicines and clinical diagnosis is expected to shape the NGS sample preparation market trends.
The NGS sample preparation market key trends & opportunities are swayed by technological advancements in sample preparation procedures and kits to standardize and simplify steps.
By transitioning from a technology used for research to one used in clinical diagnostics, NGS sample preparation market outlook is going through a significant change.
However, companies, in order to consolidate their market position by expanding the NGS sample preparation market share, must deal with issues related to library preparation and various automation techniques.
NGS is revolutionising agricultural productivity and assisting in the assessment of its impact on air, soil, gut, and water microbiomes, as well as human health, in turn, fostering the NGS sample preparation market trends and forecast.
Moreover, the adoption of NGS sample preparation is also due to the fact that NGS is also assisting in locating the origin of plant diseases and making recommendations for their eradication.
The development of veterinary medicines has been sparked by the NGS-based metagenomic screening which is considered to considerably sway the NGS sample preparation market future trends.
However, the lack of veterinary-specific protocols is hindering the NGS sample preparation market from expanding.
Consequently, players in the market are creating NGS-based protocols for veterinary virology. As a result, businesses are expanding their research into porcine samples that have been contaminated with various DNA and RNA viruses.
Molecular diagnostic tests and devices typically require more time and money to receive FDA approval.
It could be argued that delays in the introduction of new treatments pose a significant barrier to the commercialization of potentially useful tests, in turn, the overall demand for NGS sample preparation.
The European Union (EU), China, and Japan all have regulations that are similar. This negatively impacts the NGS sample preparation adoption trends, ultimately stifling the market for NGS sample preparation.
The presence of major biopharmaceutical companies and technological advancements in North America make it the most alluring region for the NGS sample preparation market.
The NGS sample preparation market share of North America is anticipated to account for 37.6% in 2025.
The significant regional market share can be primarily attributed to the encouraging initiatives by public and private organisations for the development and, the rising number of NGS-based clinical applications in the region.
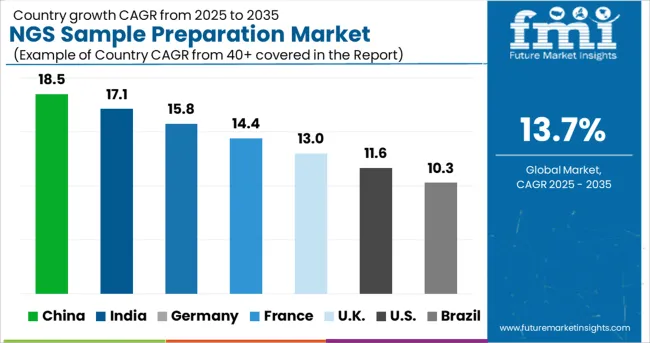
Europe is anticipated to hold a NGS sample preparation market share of 23.8% in 2025 due to the focus of research institutes on development of new methods of NGS sample preparation and aging population.
There is a variation in NGS processes carried out throughout Europe, particularly the absence of bioinformatic analysis standardisation.
To benefit patients, specialised biomedical personnel with the knowledge and abilities necessary to assure the patient that testing is carried out to the highest standard throughout Europe are needed.
A small start-up by the name of SimplSeq believes that its technology will revolutionise sequencing sample preparation and ultimately displace the industry's titans.
The company is currently beta testing a technology that it claims to be faster and simpler than conventional methods and can enable better use of priceless liquid biopsy sample material. It is a spinout of a new tech incubator called Murrieta Genomics.
SimplSeq's founder and CEO, Brandon Young, is also the creator of the patented core technology. He created a technique that eliminates the need for DNA and RNA purification and uses a library.
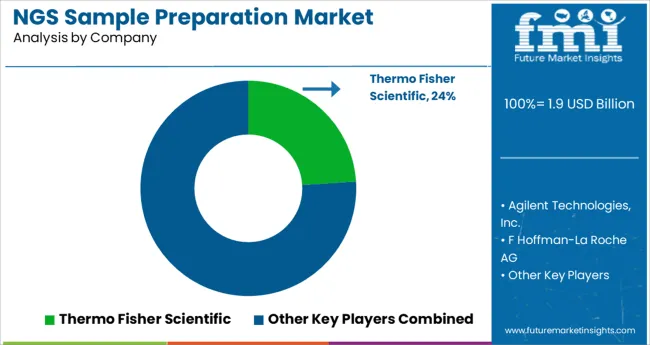
Some of the market participants in the global NGS sample preparation market is Thermo Fisher Scientific, Agilent Technologies, Inc., F Hoffman-La Roche AG, Illumina, Inc., Eurofins Scientific and Macrogen, Inc.
Companies in the NGS sample preparation market are utilising new opportunities in the areas of agriculture and animal research in addition to medical services to diversify their revenue sources.
In order to better understand multigenic disorders, companies in the market for NGS sample preparation are expanding their studies into the identification of novel disease genes in animals, in turn, expand the NGS sample preparation market share.
A few of the recent developments in NGS sample preparation market are as follows:
| Report Attribute | Details |
|---|---|
| Growth Rate | CAGR of 13.7% from 2025 to 2035 |
| Base Year for Estimation | 2024 |
| Historical Data | 2020 to 2024 |
| Forecast Period | 2025 to 2035 |
| Quantitative Units | Revenue in USD Million and CAGR from 2025 to 2035 |
| Report Coverage | Revenue Forecast, Volume Forecast, Company Ranking, Competitive Landscape, Growth Factors, Trends and Pricing Analysis |
| Segments Covered | Technology, Application, End Use, Region |
| Regions Covered | North America, Latin America, Europe, Asia Pacific &, Japan, The Middle East and Africa |
| Key Countries Profiled | USA, Canada, Brazil, Argentina, Germany, UK, France, Spain, Italy, Nordics, BENELUX, Australia &, New Zealand, China, India, ASEAN, GCC, South Africa |
| Key Companies Profiled | Thermo Fisher Scientific, Agilent Technologies, Inc., F Hoffman-La Roche AG, Illumina, Inc., Eurofins Scientific, Macrogen, Inc. |
| Customization | Available Upon Request |
The global ngs sample preparation market is estimated to be valued at USD 1.9 billion in 2025.
It is projected to reach USD 7.0 billion by 2035.
The market is expected to grow at a 13.7% CAGR between 2025 and 2035.
The key product types are sequencing by synthesis (sbs), ion semiconductor sequencing, single molecule real time (smrt) sequencing and nanopore sequencing.
diagnostics segment is expected to dominate with a 34.0% industry share in 2025.


Full Research Suite comprises of:
Market outlook & trends analysis
Interviews & case studies
Strategic recommendations
Vendor profiles & capabilities analysis
5-year forecasts
8 regions and 60+ country-level data splits
Market segment data splits
12 months of continuous data updates
DELIVERED AS:
PDF EXCEL ONLINE
NGS Solution for Early Cancer Screening Market Size and Share Forecast Outlook 2025 to 2035
NGS-based AMR Detection Market Analysis Size and Share Forecast Outlook 2025 to 2035
Tungsten Disulphide Nanoparticles Market
Tungsten Metal Powder Market
Tungsten Carbide Market
Slingshot/3 Wheeled Motorcycle Market Size and Share Forecast Outlook 2025 to 2035
Coatings and Application Technologies for Robotics Market Outlook – Trends & Innovations 2025-2035
Industry Share Analysis for Fillings and Toppings Companies
Smart Rings Market Size and Share Forecast Outlook 2025 to 2035
Shortenings Market Size, Growth, and Forecast for 2025 to 2035
UV Coatings Market Growth & Forecast 2025 to 2035
2K Coatings Market Growth – Trends & Forecast 2025 to 2035
Phosphotungstic Acid Market Size and Share Forecast Outlook 2025 to 2035
Gas Fittings & Components Market – Market Demand & Safety Insights 2025 to 2035
Coil Coatings Market Size and Share Forecast Outlook 2025 to 2035
Grid Packings Market Size and Share Forecast Outlook 2025 to 2035
Pipe Coatings Market Size and Share Forecast Outlook 2025 to 2035
Wood Coatings Market Size, Growth, and Forecast for 2025 to 2035
Smart Coatings Market Size and Share Forecast Outlook 2025 to 2035
Green Coatings Market Analysis by Technology, Application, and Region Forecast through 2035

Thank you!
You will receive an email from our Business Development Manager. Please be sure to check your SPAM/JUNK folder too.
Chat With
MaRIA