Phosphotungstic Acid Market Size and Share Forecast Outlook 2025 to 2035

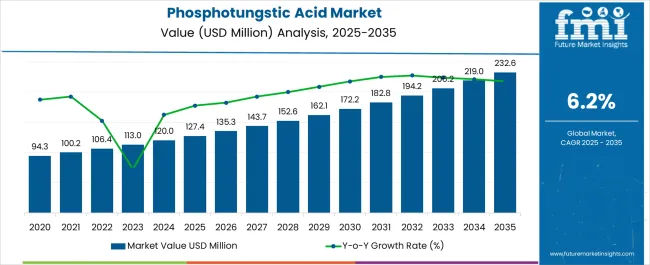
The Phosphotungstic Acid Market is estimated to be valued at USD 127.4 million in 2025 and is projected to reach USD 232.6 million by 2035, registering a compound annual growth rate (CAGR) of 6.2% over the forecast period.
Quick Stats for Phosphotungstic Acid Market

  • Phosphotungstic Acid Market Value (2025): USD 127.4 million
  • Phosphotungstic Acid Market Forecast Value (2035): USD 232.6 million
  • Phosphotungstic Acid Market Forecast CAGR: 6.2%
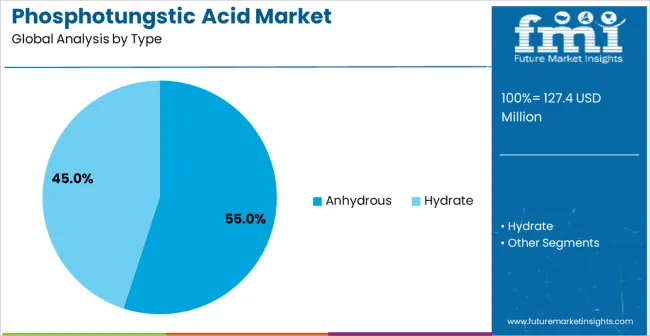
  • Leading Segment in Phosphotungstic Acid Market in 2025: Anhydrous (55.0%)
  • Key Growth Regions in Phosphotungstic Acid Market: North America, Asia-Pacific, Europe
  • Top Key Players in Phosphotungstic Acid Market: Merck, TCS Biosciences, Alfa Aesar, MP Biomedicals, BeanTown Chemicals, Toronto Research Chemicals, American Elements, Meryer, Jiangsu Guangming New Materials, Taizhou Anda Nonferrous Metals, Quzhou Mingfeng Chemical
Phosphotungstic Acid Market Market Value Analysis

Phosphotungstic Acid Market Key Takeaways

Metric Value
Phosphotungstic Acid Market Estimated Value in (2025 E) USD 127.4 million
Phosphotungstic Acid Market Forecast Value in (2035 F) USD 232.6 million
Forecast CAGR (2025 to 2035) 6.2%

Why is the Phosphotungstic Acid Market Growing?

The Phosphotungstic Acid market is witnessing steady growth driven by its extensive application in chemical synthesis, analytical chemistry, and biological research. The market is influenced by the increasing demand for high-purity reagents in research laboratories and industrial processes. The future outlook is shaped by advancements in analytical and material science, which require precise and reliable chemical compounds.

Rising investments in pharmaceutical research, biotechnology, and nanotechnology further support the demand for Phosphotungstic Acid. Additionally, the growing emphasis on high-quality reagents for experimental accuracy is contributing to market expansion. The market benefits from the widespread adoption of research-grade chemicals across academic and industrial laboratories.

Increasing awareness regarding process optimization and product quality in chemical industries is expected to further boost demand As technological development in chemical analysis and material science continues, the market for Phosphotungstic Acid is anticipated to expand steadily, with both research and industrial sectors driving sustained growth.

Segmental Analysis

The phosphotungstic acid market is segmented by type, grade, purity, application, end-use industry, and geographic regions. By type, phosphotungstic acid market is divided into Anhydrous and Hydrate. In terms of grade, phosphotungstic acid market is classified into Research Grade and Regular Grade. Based on purity, phosphotungstic acid market is segmented into 0.99 and >99% (Ultra-Pure). By application, phosphotungstic acid market is segmented into Catalyst, Dyes And Pigments, Biology And Life Sciences, Proton Donors, Precipitation Of Proteins, and Others. By end-use industry, phosphotungstic acid market is segmented into Pharmaceutical and Biotech And Microbiology. Regionally, the phosphotungstic acid industry is classified into North America, Latin America, Western Europe, Eastern Europe, Balkan & Baltic Countries, Russia & Belarus, Central Asia, East Asia, South Asia & Pacific, and the Middle East & Africa.
Insights into the Anhydrous Type Segment

Phosphotungstic Acid Market Analysis By Type

The anhydrous type segment is projected to hold 55.00% of the Phosphotungstic Acid market revenue share in 2025, establishing it as the leading type. This dominance is driven by its stability and versatility in various chemical applications, which include catalysis and material synthesis. The segment benefits from high demand in laboratories requiring water-free conditions for accurate experimental outcomes.

The capability of anhydrous phosphotungstic acid to maintain consistent chemical properties under diverse conditions has enhanced its adoption. Additionally, industries focused on high-precision processes prefer anhydrous compounds to ensure reliability and reproducibility in formulations.

The growth is further supported by the increasing use of phosphotungstic acid in advanced research, where control over moisture content is critical As industrial and research applications continue to expand, the anhydrous type is expected to retain a dominant position in the market.
Insights into the Research Grade Segment

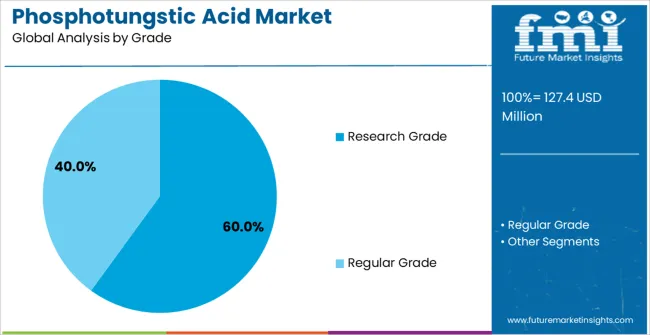
Phosphotungstic Acid Market Analysis By Grade

The research grade segment is expected to account for 60.00% of the Phosphotungstic Acid market revenue share in 2025, highlighting its leading role in the market. This growth is driven by the need for high-purity reagents in experimental research, where accuracy and reproducibility are critical. The segment has been propelled by the adoption of research-grade chemicals in pharmaceutical, biotechnology, and material science laboratories.

The high quality and consistency of research-grade phosphotungstic acid ensure reliability in sensitive analytical procedures and chemical reactions. Furthermore, regulatory and safety standards in laboratory environments have reinforced the preference for research-grade chemicals.

The segment’s dominance is supported by increasing investments in academic and industrial research activities that demand precise chemical reagents As research intensity rises globally, the use of research-grade phosphotungstic acid is expected to continue its strong growth trajectory.
Insights into the 99% Purity Segment

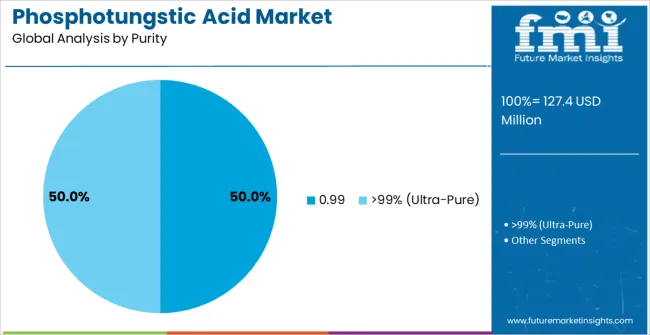
Phosphotungstic Acid Market Analysis By Purity

The 99% purity segment is projected to hold 50.00% of the market revenue share in 2025, reflecting its leading position in the Phosphotungstic Acid market. This growth is attributed to the critical requirement for high-purity compounds in analytical and synthetic applications.

The 99% purity ensures minimal interference in chemical reactions and enhances the accuracy of experimental results. Industries and research laboratories prioritize this level of purity to meet stringent quality standards and achieve reliable outcomes.

The segment benefits from its extensive use in advanced material synthesis, microscopy staining, and catalyst development As demand for precision and reproducibility increases across pharmaceutical and chemical research, the 99% purity segment is expected to maintain its leading position, supporting the overall expansion of the Phosphotungstic Acid market.

Market Overview

Phosphotungstic Acid Market Overview 2025 - 2035

Phosphotungstic acid is a chemical reagent usually prepared by the reaction of sodium tungstate with phosphoric acid, acidified with HCL. It is mostly used in histology for staining of cell specimens along with some other chemical compounds. It has the potential to bind to collagen, fibrin, and fibres of connective tissues, and effectively replaces the anions of dyes from these materials, thereby selectively decoloring them.

Traditionally, the use of phosphotungstic was limited to certain areas. However, with rapid advancement and growing awareness about the benefits of this acid, people are gradually adopting it for various purposes. Driven by this, sales of phosphotungstic acid are slated to rise substantially during the forecast period.

Phosphotungstic acid is considered as the strongest of heteropolyacids due to its ability to fully dissociate even at low pH. In fact, it has become one of the most preferred catalysts used in research on account of its high acidity and thermal stability.

Growing adoption of phosphotungstic acid for a wide range of applications such as dyeing, catalyst, precipitation of proteins, and several other medicinal applications is anticipated to boost the growth of phosphotungstic acid market during the forecast period.

Phosphotungstics acid plays a key role in precipitation of proteins across various end use verticals. It is for this reason that it is often called a universal precipitant for polar proteins. Rising need for precipitation of proteins will therefore boost the sales of phosphotungstic acids over the assessment period.

In addition to this, rising investments in biotechnology and histology across the world will further create growth avenues for phosphotungstic acid market in the future.
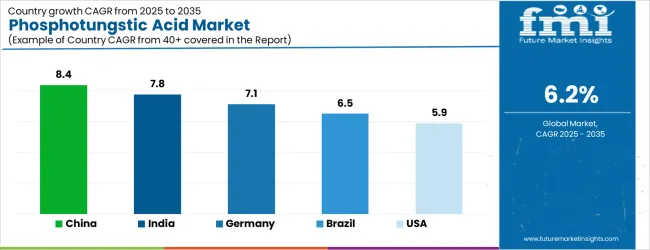
Analysis of Phosphotungstic Acid Market By Key Countries

Phosphotungstic Acid Market Cagr Analysis By Country
Country CAGR
China 8.4%
India 7.8%
Germany 7.1%
Brazil 6.5%
USA 5.9%
UK 5.3%
Japan 4.7%

Country-wise Analysis

The Phosphotungstic Acid Market is expected to register a CAGR of 6.2% during the forecast period, exhibiting varied country level momentum. China leads with the highest CAGR of 8.4%, followed by India at 7.8%. Developed markets such as Germany, France, and the UK continue to expand steadily, while the USA is likely to grow at consistent rates. Japan posts the lowest CAGR at 4.7%, yet still underscores a broadly positive trajectory for the global Phosphotungstic Acid Market. In 2024, Germany held a dominant revenue in the Western Europe market and is expected to grow with a CAGR of 7.1%. The USA Phosphotungstic Acid Market is estimated to be valued at USD 46.8 million in 2025 and is anticipated to reach a valuation of USD 46.8 million by 2035. Sales are projected to rise at a CAGR of 0.0% over the forecast period between 2025 and 2035. While Japan and South Korea markets are estimated to be valued at USD 6.6 million and USD 3.3 million respectively in 2025.
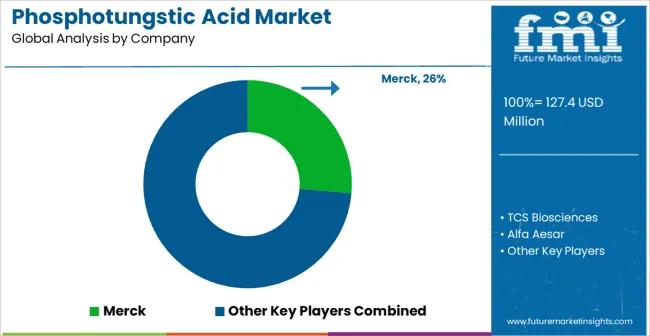
Key Players in the Phosphotungstic Acid Market

Phosphotungstic Acid Market Analysis By Company
  • Merck
  • TCS Biosciences
  • Alfa Aesar
  • MP Biomedicals
  • BeanTown Chemicals
  • Toronto Research Chemicals
  • American Elements
  • Meryer
  • Jiangsu Guangming New Materials
  • Taizhou Anda Nonferrous Metals
  • Quzhou Mingfeng Chemical

Scope of the Report

Item Value
Quantitative Units USD 127.4 Million
Type Anhydrous and Hydrate
Grade Research Grade and Regular Grade
Purity 0.99 and >99% (Ultra-Pure)
Application Catalyst, Dyes And Pigments, Biology And Life Sciences, Proton Donors, Precipitation Of Proteins, and Others
End-Use Industry Pharmaceutical and Biotech And Microbiology
Regions Covered North America, Europe, Asia-Pacific, Latin America, Middle East & Africa
Country Covered United States, Canada, Germany, France, United Kingdom, China, Japan, India, Brazil, South Africa
Key Companies Profiled Merck, TCS Biosciences, Alfa Aesar, MP Biomedicals, BeanTown Chemicals, Toronto Research Chemicals, American Elements, Meryer, Jiangsu Guangming New Materials, Taizhou Anda Nonferrous Metals, and Quzhou Mingfeng Chemical

Phosphotungstic Acid Market by Segments

Type:

  • Anhydrous
  • Hydrate

Grade:

  • Research Grade
  • Regular Grade

Purity:

  • 0.99
  • >99% (Ultra-Pure)

Application:

  • Catalyst
  • Dyes And Pigments
  • Biology And Life Sciences
  • Proton Donors
  • Precipitation Of Proteins
  • Others

End-Use Industry:

  • Pharmaceutical
  • Biotech And Microbiology

Region:

  • North America
    • USA
    • Canada
    • Mexico
  • Latin America
    • Brazil
    • Chile
    • Rest of Latin America
  • Western Europe
    • Germany
    • UK
    • Italy
    • Spain
    • France
    • Nordic
    • BENELUX
    • Rest of Western Europe
  • Eastern Europe
    • Russia
    • Poland
    • Hungary
    • Balkan & Baltic
    • Rest of Eastern Europe
  • East Asia
    • China
    • Japan
    • South Korea
  • South Asia and Pacific
    • India
    • ASEAN
    • Australia & New Zealand
    • Rest of South Asia and Pacific
  • Middle East & Africa
    • Kingdom of Saudi Arabia
    • Other GCC Countries
    • Turkiye
    • South Africa
    • Other African Union
    • Rest of Middle East & Africa

Frequently Asked Questions

How big is the phosphotungstic acid market in 2025?

The global phosphotungstic acid market is estimated to be valued at USD 127.4 million in 2025.

What will be the size of phosphotungstic acid market in 2035?

The market size for the phosphotungstic acid market is projected to reach USD 232.6 million by 2035.

How much will be the phosphotungstic acid market growth between 2025 and 2035?

The phosphotungstic acid market is expected to grow at a 6.2% CAGR between 2025 and 2035.

What are the key product types in the phosphotungstic acid market?

The key product types in phosphotungstic acid market are anhydrous and hydrate.

Which grade segment to contribute significant share in the phosphotungstic acid market in 2025?

In terms of grade, research grade segment to command 60.0% share in the phosphotungstic acid market in 2025.

Table of Content

  1. Executive Summary
    • Global Market Outlook
    • Demand-side Trends
    • Supply-side Trends
    • Technology Roadmap Analysis
    • Analysis and Recommendations
  2. Market Overview
    • Market Coverage / Taxonomy
    • Market Definition / Scope / Limitations
  3. Market Background
    • Market Dynamics
      • Drivers
      • Restraints
      • Opportunity
      • Trends
    • Scenario Forecast
      • Demand in Optimistic Scenario
      • Demand in Likely Scenario
      • Demand in Conservative Scenario
    • Opportunity Map Analysis
    • Product Life Cycle Analysis
    • Supply Chain Analysis
    • Investment Feasibility Matrix
    • Value Chain Analysis
    • PESTLE and Porter’s Analysis
    • Regulatory Landscape
    • Regional Parent Market Outlook
    • Production and Consumption Statistics
    • Import and Export Statistics
  4. Global Market Analysis 2020 to 2024 and Forecast, 2025 to 2035
    • Historical Market Size Value (USD Million) Analysis, 2020 to 2024
    • Current and Future Market Size Value (USD Million) Projections, 2025 to 2035
      • Y-o-Y Growth Trend Analysis
      • Absolute $ Opportunity Analysis
  5. Global Market Pricing Analysis 2020 to 2024 and Forecast 2025 to 2035
  6. Global Market Analysis 2020 to 2024 and Forecast 2025 to 2035, By Type
    • Introduction / Key Findings
    • Historical Market Size Value (USD Million) Analysis By Type , 2020 to 2024
    • Current and Future Market Size Value (USD Million) Analysis and Forecast By Type , 2025 to 2035
      • Anhydrous
      • Hydrate
    • Y-o-Y Growth Trend Analysis By Type , 2020 to 2024
    • Absolute $ Opportunity Analysis By Type , 2025 to 2035
  7. Global Market Analysis 2020 to 2024 and Forecast 2025 to 2035, By Grade
    • Introduction / Key Findings
    • Historical Market Size Value (USD Million) Analysis By Grade, 2020 to 2024
    • Current and Future Market Size Value (USD Million) Analysis and Forecast By Grade, 2025 to 2035
      • Research Grade
      • Regular Grade
    • Y-o-Y Growth Trend Analysis By Grade, 2020 to 2024
    • Absolute $ Opportunity Analysis By Grade, 2025 to 2035
  8. Global Market Analysis 2020 to 2024 and Forecast 2025 to 2035, By Purity
    • Introduction / Key Findings
    • Historical Market Size Value (USD Million) Analysis By Purity, 2020 to 2024
    • Current and Future Market Size Value (USD Million) Analysis and Forecast By Purity, 2025 to 2035
      • 0.99
      • >99% (Ultra-Pure)
    • Y-o-Y Growth Trend Analysis By Purity, 2020 to 2024
    • Absolute $ Opportunity Analysis By Purity, 2025 to 2035
  9. Global Market Analysis 2020 to 2024 and Forecast 2025 to 2035, By Application
    • Introduction / Key Findings
    • Historical Market Size Value (USD Million) Analysis By Application, 2020 to 2024
    • Current and Future Market Size Value (USD Million) Analysis and Forecast By Application, 2025 to 2035
      • Catalyst
      • Dyes And Pigments
      • Biology And Life Sciences
      • Proton Donors
      • Precipitation Of Proteins
      • Others
    • Y-o-Y Growth Trend Analysis By Application, 2020 to 2024
    • Absolute $ Opportunity Analysis By Application, 2025 to 2035
  10. Global Market Analysis 2020 to 2024 and Forecast 2025 to 2035, By End-Use Industry
    • Introduction / Key Findings
    • Historical Market Size Value (USD Million) Analysis By End-Use Industry, 2020 to 2024
    • Current and Future Market Size Value (USD Million) Analysis and Forecast By End-Use Industry, 2025 to 2035
      • Pharmaceutical
      • Biotech And Microbiology
    • Y-o-Y Growth Trend Analysis By End-Use Industry, 2020 to 2024
    • Absolute $ Opportunity Analysis By End-Use Industry, 2025 to 2035
  11. Global Market Analysis 2020 to 2024 and Forecast 2025 to 2035, By Region
    • Introduction
    • Historical Market Size Value (USD Million) Analysis By Region, 2020 to 2024
    • Current Market Size Value (USD Million) Analysis and Forecast By Region, 2025 to 2035
      • North America
      • Latin America
      • Western Europe
      • Eastern Europe
      • East Asia
      • South Asia and Pacific
      • Middle East & Africa
    • Market Attractiveness Analysis By Region
  12. North America Market Analysis 2020 to 2024 and Forecast 2025 to 2035, By Country
    • Historical Market Size Value (USD Million) Trend Analysis By Market Taxonomy, 2020 to 2024
    • Market Size Value (USD Million) Forecast By Market Taxonomy, 2025 to 2035
      • By Country
        • USA
        • Canada
        • Mexico
      • By Type
      • By Grade
      • By Purity
      • By Application
      • By End-Use Industry
    • Market Attractiveness Analysis
      • By Country
      • By Type
      • By Grade
      • By Purity
      • By Application
      • By End-Use Industry
    • Key Takeaways
  13. Latin America Market Analysis 2020 to 2024 and Forecast 2025 to 2035, By Country
    • Historical Market Size Value (USD Million) Trend Analysis By Market Taxonomy, 2020 to 2024
    • Market Size Value (USD Million) Forecast By Market Taxonomy, 2025 to 2035
      • By Country
        • Brazil
        • Chile
        • Rest of Latin America
      • By Type
      • By Grade
      • By Purity
      • By Application
      • By End-Use Industry
    • Market Attractiveness Analysis
      • By Country
      • By Type
      • By Grade
      • By Purity
      • By Application
      • By End-Use Industry
    • Key Takeaways
  14. Western Europe Market Analysis 2020 to 2024 and Forecast 2025 to 2035, By Country
    • Historical Market Size Value (USD Million) Trend Analysis By Market Taxonomy, 2020 to 2024
    • Market Size Value (USD Million) Forecast By Market Taxonomy, 2025 to 2035
      • By Country
        • Germany
        • UK
        • Italy
        • Spain
        • France
        • Nordic
        • BENELUX
        • Rest of Western Europe
      • By Type
      • By Grade
      • By Purity
      • By Application
      • By End-Use Industry
    • Market Attractiveness Analysis
      • By Country
      • By Type
      • By Grade
      • By Purity
      • By Application
      • By End-Use Industry
    • Key Takeaways
  15. Eastern Europe Market Analysis 2020 to 2024 and Forecast 2025 to 2035, By Country
    • Historical Market Size Value (USD Million) Trend Analysis By Market Taxonomy, 2020 to 2024
    • Market Size Value (USD Million) Forecast By Market Taxonomy, 2025 to 2035
      • By Country
        • Russia
        • Poland
        • Hungary
        • Balkan & Baltic
        • Rest of Eastern Europe
      • By Type
      • By Grade
      • By Purity
      • By Application
      • By End-Use Industry
    • Market Attractiveness Analysis
      • By Country
      • By Type
      • By Grade
      • By Purity
      • By Application
      • By End-Use Industry
    • Key Takeaways
  16. East Asia Market Analysis 2020 to 2024 and Forecast 2025 to 2035, By Country
    • Historical Market Size Value (USD Million) Trend Analysis By Market Taxonomy, 2020 to 2024
    • Market Size Value (USD Million) Forecast By Market Taxonomy, 2025 to 2035
      • By Country
        • China
        • Japan
        • South Korea
      • By Type
      • By Grade
      • By Purity
      • By Application
      • By End-Use Industry
    • Market Attractiveness Analysis
      • By Country
      • By Type
      • By Grade
      • By Purity
      • By Application
      • By End-Use Industry
    • Key Takeaways
  17. South Asia and Pacific Market Analysis 2020 to 2024 and Forecast 2025 to 2035, By Country
    • Historical Market Size Value (USD Million) Trend Analysis By Market Taxonomy, 2020 to 2024
    • Market Size Value (USD Million) Forecast By Market Taxonomy, 2025 to 2035
      • By Country
        • India
        • ASEAN
        • Australia & New Zealand
        • Rest of South Asia and Pacific
      • By Type
      • By Grade
      • By Purity
      • By Application
      • By End-Use Industry
    • Market Attractiveness Analysis
      • By Country
      • By Type
      • By Grade
      • By Purity
      • By Application
      • By End-Use Industry
    • Key Takeaways
  18. Middle East & Africa Market Analysis 2020 to 2024 and Forecast 2025 to 2035, By Country
    • Historical Market Size Value (USD Million) Trend Analysis By Market Taxonomy, 2020 to 2024
    • Market Size Value (USD Million) Forecast By Market Taxonomy, 2025 to 2035
      • By Country
        • Kingdom of Saudi Arabia
        • Other GCC Countries
        • Turkiye
        • South Africa
        • Other African Union
        • Rest of Middle East & Africa
      • By Type
      • By Grade
      • By Purity
      • By Application
      • By End-Use Industry
    • Market Attractiveness Analysis
      • By Country
      • By Type
      • By Grade
      • By Purity
      • By Application
      • By End-Use Industry
    • Key Takeaways
  19. Key Countries Market Analysis
    • USA
      • Pricing Analysis
      • Market Share Analysis, 2024
        • By Type
        • By Grade
        • By Purity
        • By Application
        • By End-Use Industry
    • Canada
      • Pricing Analysis
      • Market Share Analysis, 2024
        • By Type
        • By Grade
        • By Purity
        • By Application
        • By End-Use Industry
    • Mexico
      • Pricing Analysis
      • Market Share Analysis, 2024
        • By Type
        • By Grade
        • By Purity
        • By Application
        • By End-Use Industry
    • Brazil
      • Pricing Analysis
      • Market Share Analysis, 2024
        • By Type
        • By Grade
        • By Purity
        • By Application
        • By End-Use Industry
    • Chile
      • Pricing Analysis
      • Market Share Analysis, 2024
        • By Type
        • By Grade
        • By Purity
        • By Application
        • By End-Use Industry
    • Germany
      • Pricing Analysis
      • Market Share Analysis, 2024
        • By Type
        • By Grade
        • By Purity
        • By Application
        • By End-Use Industry
    • UK
      • Pricing Analysis
      • Market Share Analysis, 2024
        • By Type
        • By Grade
        • By Purity
        • By Application
        • By End-Use Industry
    • Italy
      • Pricing Analysis
      • Market Share Analysis, 2024
        • By Type
        • By Grade
        • By Purity
        • By Application
        • By End-Use Industry
    • Spain
      • Pricing Analysis
      • Market Share Analysis, 2024
        • By Type
        • By Grade
        • By Purity
        • By Application
        • By End-Use Industry
    • France
      • Pricing Analysis
      • Market Share Analysis, 2024
        • By Type
        • By Grade
        • By Purity
        • By Application
        • By End-Use Industry
    • India
      • Pricing Analysis
      • Market Share Analysis, 2024
        • By Type
        • By Grade
        • By Purity
        • By Application
        • By End-Use Industry
    • ASEAN
      • Pricing Analysis
      • Market Share Analysis, 2024
        • By Type
        • By Grade
        • By Purity
        • By Application
        • By End-Use Industry
    • Australia & New Zealand
      • Pricing Analysis
      • Market Share Analysis, 2024
        • By Type
        • By Grade
        • By Purity
        • By Application
        • By End-Use Industry
    • China
      • Pricing Analysis
      • Market Share Analysis, 2024
        • By Type
        • By Grade
        • By Purity
        • By Application
        • By End-Use Industry
    • Japan
      • Pricing Analysis
      • Market Share Analysis, 2024
        • By Type
        • By Grade
        • By Purity
        • By Application
        • By End-Use Industry
    • South Korea
      • Pricing Analysis
      • Market Share Analysis, 2024
        • By Type
        • By Grade
        • By Purity
        • By Application
        • By End-Use Industry
    • Russia
      • Pricing Analysis
      • Market Share Analysis, 2024
        • By Type
        • By Grade
        • By Purity
        • By Application
        • By End-Use Industry
    • Poland
      • Pricing Analysis
      • Market Share Analysis, 2024
        • By Type
        • By Grade
        • By Purity
        • By Application
        • By End-Use Industry
    • Hungary
      • Pricing Analysis
      • Market Share Analysis, 2024
        • By Type
        • By Grade
        • By Purity
        • By Application
        • By End-Use Industry
    • Kingdom of Saudi Arabia
      • Pricing Analysis
      • Market Share Analysis, 2024
        • By Type
        • By Grade
        • By Purity
        • By Application
        • By End-Use Industry
    • Turkiye
      • Pricing Analysis
      • Market Share Analysis, 2024
        • By Type
        • By Grade
        • By Purity
        • By Application
        • By End-Use Industry
    • South Africa
      • Pricing Analysis
      • Market Share Analysis, 2024
        • By Type
        • By Grade
        • By Purity
        • By Application
        • By End-Use Industry
  20. Market Structure Analysis
    • Competition Dashboard
    • Competition Benchmarking
    • Market Share Analysis of Top Players
      • By Regional
      • By Type
      • By Grade
      • By Purity
      • By Application
      • By End-Use Industry
  21. Competition Analysis
    • Competition Deep Dive
      • Merck
        • Overview
        • Product Portfolio
        • Profitability by Market Segments (Product/Age /Sales Channel/Region)
        • Sales Footprint
        • Strategy Overview
          • Marketing Strategy
          • Product Strategy
          • Channel Strategy
      • TCS Biosciences
      • Alfa Aesar
      • MP Biomedicals
      • BeanTown Chemicals
      • Toronto Research Chemicals
      • American Elements
      • Meryer
      • Jiangsu Guangming New Materials
      • Taizhou Anda Nonferrous Metals
      • Quzhou Mingfeng Chemical
  22. Assumptions & Acronyms Used
  23. Research Methodology

List of Tables

  • Table 1: Global Market Value (USD Million) Forecast by Region, 2020-2035
  • Table 2: Global Market Value (USD Million) Forecast by Type , 2020-2035
  • Table 3: Global Market Value (USD Million) Forecast by Grade, 2020-2035
  • Table 4: Global Market Value (USD Million) Forecast by Purity, 2020-2035
  • Table 5: Global Market Value (USD Million) Forecast by Application, 2020-2035
  • Table 6: Global Market Value (USD Million) Forecast by End-Use Industry, 2020-2035
  • Table 7: North America Market Value (USD Million) Forecast by Country, 2020-2035
  • Table 8: North America Market Value (USD Million) Forecast by Type , 2020-2035
  • Table 9: North America Market Value (USD Million) Forecast by Grade, 2020-2035
  • Table 10: North America Market Value (USD Million) Forecast by Purity, 2020-2035
  • Table 11: North America Market Value (USD Million) Forecast by Application, 2020-2035
  • Table 12: North America Market Value (USD Million) Forecast by End-Use Industry, 2020-2035
  • Table 13: Latin America Market Value (USD Million) Forecast by Country, 2020-2035
  • Table 14: Latin America Market Value (USD Million) Forecast by Type , 2020-2035
  • Table 15: Latin America Market Value (USD Million) Forecast by Grade, 2020-2035
  • Table 16: Latin America Market Value (USD Million) Forecast by Purity, 2020-2035
  • Table 17: Latin America Market Value (USD Million) Forecast by Application, 2020-2035
  • Table 18: Latin America Market Value (USD Million) Forecast by End-Use Industry, 2020-2035
  • Table 19: Western Europe Market Value (USD Million) Forecast by Country, 2020-2035
  • Table 20: Western Europe Market Value (USD Million) Forecast by Type , 2020-2035
  • Table 21: Western Europe Market Value (USD Million) Forecast by Grade, 2020-2035
  • Table 22: Western Europe Market Value (USD Million) Forecast by Purity, 2020-2035
  • Table 23: Western Europe Market Value (USD Million) Forecast by Application, 2020-2035
  • Table 24: Western Europe Market Value (USD Million) Forecast by End-Use Industry, 2020-2035
  • Table 25: Eastern Europe Market Value (USD Million) Forecast by Country, 2020-2035
  • Table 26: Eastern Europe Market Value (USD Million) Forecast by Type , 2020-2035
  • Table 27: Eastern Europe Market Value (USD Million) Forecast by Grade, 2020-2035
  • Table 28: Eastern Europe Market Value (USD Million) Forecast by Purity, 2020-2035
  • Table 29: Eastern Europe Market Value (USD Million) Forecast by Application, 2020-2035
  • Table 30: Eastern Europe Market Value (USD Million) Forecast by End-Use Industry, 2020-2035
  • Table 31: East Asia Market Value (USD Million) Forecast by Country, 2020-2035
  • Table 32: East Asia Market Value (USD Million) Forecast by Type , 2020-2035
  • Table 33: East Asia Market Value (USD Million) Forecast by Grade, 2020-2035
  • Table 34: East Asia Market Value (USD Million) Forecast by Purity, 2020-2035
  • Table 35: East Asia Market Value (USD Million) Forecast by Application, 2020-2035
  • Table 36: East Asia Market Value (USD Million) Forecast by End-Use Industry, 2020-2035
  • Table 37: South Asia and Pacific Market Value (USD Million) Forecast by Country, 2020-2035
  • Table 38: South Asia and Pacific Market Value (USD Million) Forecast by Type , 2020-2035
  • Table 39: South Asia and Pacific Market Value (USD Million) Forecast by Grade, 2020-2035
  • Table 40: South Asia and Pacific Market Value (USD Million) Forecast by Purity, 2020-2035
  • Table 41: South Asia and Pacific Market Value (USD Million) Forecast by Application, 2020-2035
  • Table 42: South Asia and Pacific Market Value (USD Million) Forecast by End-Use Industry, 2020-2035
  • Table 43: Middle East & Africa Market Value (USD Million) Forecast by Country, 2020-2035
  • Table 44: Middle East & Africa Market Value (USD Million) Forecast by Type , 2020-2035
  • Table 45: Middle East & Africa Market Value (USD Million) Forecast by Grade, 2020-2035
  • Table 46: Middle East & Africa Market Value (USD Million) Forecast by Purity, 2020-2035
  • Table 47: Middle East & Africa Market Value (USD Million) Forecast by Application, 2020-2035
  • Table 48: Middle East & Africa Market Value (USD Million) Forecast by End-Use Industry, 2020-2035

List of Figures

  • Figure 1: Global Market Pricing Analysis
  • Figure 2: Global Market Value (USD Million) Forecast 2020-2035
  • Figure 3: Global Market Value Share and BPS Analysis by Type , 2025 and 2035
  • Figure 4: Global Market Y-o-Y Growth Comparison by Type , 2025-2035
  • Figure 5: Global Market Attractiveness Analysis by Type
  • Figure 6: Global Market Value Share and BPS Analysis by Grade, 2025 and 2035
  • Figure 7: Global Market Y-o-Y Growth Comparison by Grade, 2025-2035
  • Figure 8: Global Market Attractiveness Analysis by Grade
  • Figure 9: Global Market Value Share and BPS Analysis by Purity, 2025 and 2035
  • Figure 10: Global Market Y-o-Y Growth Comparison by Purity, 2025-2035
  • Figure 11: Global Market Attractiveness Analysis by Purity
  • Figure 12: Global Market Value Share and BPS Analysis by Application, 2025 and 2035
  • Figure 13: Global Market Y-o-Y Growth Comparison by Application, 2025-2035
  • Figure 14: Global Market Attractiveness Analysis by Application
  • Figure 15: Global Market Value Share and BPS Analysis by End-Use Industry, 2025 and 2035
  • Figure 16: Global Market Y-o-Y Growth Comparison by End-Use Industry, 2025-2035
  • Figure 17: Global Market Attractiveness Analysis by End-Use Industry
  • Figure 18: Global Market Value (USD Million) Share and BPS Analysis by Region, 2025 and 2035
  • Figure 19: Global Market Y-o-Y Growth Comparison by Region, 2025-2035
  • Figure 20: Global Market Attractiveness Analysis by Region
  • Figure 21: North America Market Incremental Dollar Opportunity, 2025-2035
  • Figure 22: Latin America Market Incremental Dollar Opportunity, 2025-2035
  • Figure 23: Western Europe Market Incremental Dollar Opportunity, 2025-2035
  • Figure 24: Eastern Europe Market Incremental Dollar Opportunity, 2025-2035
  • Figure 25: East Asia Market Incremental Dollar Opportunity, 2025-2035
  • Figure 26: South Asia and Pacific Market Incremental Dollar Opportunity, 2025-2035
  • Figure 27: Middle East & Africa Market Incremental Dollar Opportunity, 2025-2035
  • Figure 28: North America Market Value Share and BPS Analysis by Country, 2025 and 2035
  • Figure 29: North America Market Value Share and BPS Analysis by Type , 2025 and 2035
  • Figure 30: North America Market Y-o-Y Growth Comparison by Type , 2025-2035
  • Figure 31: North America Market Attractiveness Analysis by Type
  • Figure 32: North America Market Value Share and BPS Analysis by Grade, 2025 and 2035
  • Figure 33: North America Market Y-o-Y Growth Comparison by Grade, 2025-2035
  • Figure 34: North America Market Attractiveness Analysis by Grade
  • Figure 35: North America Market Value Share and BPS Analysis by Purity, 2025 and 2035
  • Figure 36: North America Market Y-o-Y Growth Comparison by Purity, 2025-2035
  • Figure 37: North America Market Attractiveness Analysis by Purity
  • Figure 38: North America Market Value Share and BPS Analysis by Application, 2025 and 2035
  • Figure 39: North America Market Y-o-Y Growth Comparison by Application, 2025-2035
  • Figure 40: North America Market Attractiveness Analysis by Application
  • Figure 41: North America Market Value Share and BPS Analysis by End-Use Industry, 2025 and 2035
  • Figure 42: North America Market Y-o-Y Growth Comparison by End-Use Industry, 2025-2035
  • Figure 43: North America Market Attractiveness Analysis by End-Use Industry
  • Figure 44: Latin America Market Value Share and BPS Analysis by Country, 2025 and 2035
  • Figure 45: Latin America Market Value Share and BPS Analysis by Type , 2025 and 2035
  • Figure 46: Latin America Market Y-o-Y Growth Comparison by Type , 2025-2035
  • Figure 47: Latin America Market Attractiveness Analysis by Type
  • Figure 48: Latin America Market Value Share and BPS Analysis by Grade, 2025 and 2035
  • Figure 49: Latin America Market Y-o-Y Growth Comparison by Grade, 2025-2035
  • Figure 50: Latin America Market Attractiveness Analysis by Grade
  • Figure 51: Latin America Market Value Share and BPS Analysis by Purity, 2025 and 2035
  • Figure 52: Latin America Market Y-o-Y Growth Comparison by Purity, 2025-2035
  • Figure 53: Latin America Market Attractiveness Analysis by Purity
  • Figure 54: Latin America Market Value Share and BPS Analysis by Application, 2025 and 2035
  • Figure 55: Latin America Market Y-o-Y Growth Comparison by Application, 2025-2035
  • Figure 56: Latin America Market Attractiveness Analysis by Application
  • Figure 57: Latin America Market Value Share and BPS Analysis by End-Use Industry, 2025 and 2035
  • Figure 58: Latin America Market Y-o-Y Growth Comparison by End-Use Industry, 2025-2035
  • Figure 59: Latin America Market Attractiveness Analysis by End-Use Industry
  • Figure 60: Western Europe Market Value Share and BPS Analysis by Country, 2025 and 2035
  • Figure 61: Western Europe Market Value Share and BPS Analysis by Type , 2025 and 2035
  • Figure 62: Western Europe Market Y-o-Y Growth Comparison by Type , 2025-2035
  • Figure 63: Western Europe Market Attractiveness Analysis by Type
  • Figure 64: Western Europe Market Value Share and BPS Analysis by Grade, 2025 and 2035
  • Figure 65: Western Europe Market Y-o-Y Growth Comparison by Grade, 2025-2035
  • Figure 66: Western Europe Market Attractiveness Analysis by Grade
  • Figure 67: Western Europe Market Value Share and BPS Analysis by Purity, 2025 and 2035
  • Figure 68: Western Europe Market Y-o-Y Growth Comparison by Purity, 2025-2035
  • Figure 69: Western Europe Market Attractiveness Analysis by Purity
  • Figure 70: Western Europe Market Value Share and BPS Analysis by Application, 2025 and 2035
  • Figure 71: Western Europe Market Y-o-Y Growth Comparison by Application, 2025-2035
  • Figure 72: Western Europe Market Attractiveness Analysis by Application
  • Figure 73: Western Europe Market Value Share and BPS Analysis by End-Use Industry, 2025 and 2035
  • Figure 74: Western Europe Market Y-o-Y Growth Comparison by End-Use Industry, 2025-2035
  • Figure 75: Western Europe Market Attractiveness Analysis by End-Use Industry
  • Figure 76: Eastern Europe Market Value Share and BPS Analysis by Country, 2025 and 2035
  • Figure 77: Eastern Europe Market Value Share and BPS Analysis by Type , 2025 and 2035
  • Figure 78: Eastern Europe Market Y-o-Y Growth Comparison by Type , 2025-2035
  • Figure 79: Eastern Europe Market Attractiveness Analysis by Type
  • Figure 80: Eastern Europe Market Value Share and BPS Analysis by Grade, 2025 and 2035
  • Figure 81: Eastern Europe Market Y-o-Y Growth Comparison by Grade, 2025-2035
  • Figure 82: Eastern Europe Market Attractiveness Analysis by Grade
  • Figure 83: Eastern Europe Market Value Share and BPS Analysis by Purity, 2025 and 2035
  • Figure 84: Eastern Europe Market Y-o-Y Growth Comparison by Purity, 2025-2035
  • Figure 85: Eastern Europe Market Attractiveness Analysis by Purity
  • Figure 86: Eastern Europe Market Value Share and BPS Analysis by Application, 2025 and 2035
  • Figure 87: Eastern Europe Market Y-o-Y Growth Comparison by Application, 2025-2035
  • Figure 88: Eastern Europe Market Attractiveness Analysis by Application
  • Figure 89: Eastern Europe Market Value Share and BPS Analysis by End-Use Industry, 2025 and 2035
  • Figure 90: Eastern Europe Market Y-o-Y Growth Comparison by End-Use Industry, 2025-2035
  • Figure 91: Eastern Europe Market Attractiveness Analysis by End-Use Industry
  • Figure 92: East Asia Market Value Share and BPS Analysis by Country, 2025 and 2035
  • Figure 93: East Asia Market Value Share and BPS Analysis by Type , 2025 and 2035
  • Figure 94: East Asia Market Y-o-Y Growth Comparison by Type , 2025-2035
  • Figure 95: East Asia Market Attractiveness Analysis by Type
  • Figure 96: East Asia Market Value Share and BPS Analysis by Grade, 2025 and 2035
  • Figure 97: East Asia Market Y-o-Y Growth Comparison by Grade, 2025-2035
  • Figure 98: East Asia Market Attractiveness Analysis by Grade
  • Figure 99: East Asia Market Value Share and BPS Analysis by Purity, 2025 and 2035
  • Figure 100: East Asia Market Y-o-Y Growth Comparison by Purity, 2025-2035
  • Figure 101: East Asia Market Attractiveness Analysis by Purity
  • Figure 102: East Asia Market Value Share and BPS Analysis by Application, 2025 and 2035
  • Figure 103: East Asia Market Y-o-Y Growth Comparison by Application, 2025-2035
  • Figure 104: East Asia Market Attractiveness Analysis by Application
  • Figure 105: East Asia Market Value Share and BPS Analysis by End-Use Industry, 2025 and 2035
  • Figure 106: East Asia Market Y-o-Y Growth Comparison by End-Use Industry, 2025-2035
  • Figure 107: East Asia Market Attractiveness Analysis by End-Use Industry
  • Figure 108: South Asia and Pacific Market Value Share and BPS Analysis by Country, 2025 and 2035
  • Figure 109: South Asia and Pacific Market Value Share and BPS Analysis by Type , 2025 and 2035
  • Figure 110: South Asia and Pacific Market Y-o-Y Growth Comparison by Type , 2025-2035
  • Figure 111: South Asia and Pacific Market Attractiveness Analysis by Type
  • Figure 112: South Asia and Pacific Market Value Share and BPS Analysis by Grade, 2025 and 2035
  • Figure 113: South Asia and Pacific Market Y-o-Y Growth Comparison by Grade, 2025-2035
  • Figure 114: South Asia and Pacific Market Attractiveness Analysis by Grade
  • Figure 115: South Asia and Pacific Market Value Share and BPS Analysis by Purity, 2025 and 2035
  • Figure 116: South Asia and Pacific Market Y-o-Y Growth Comparison by Purity, 2025-2035
  • Figure 117: South Asia and Pacific Market Attractiveness Analysis by Purity
  • Figure 118: South Asia and Pacific Market Value Share and BPS Analysis by Application, 2025 and 2035
  • Figure 119: South Asia and Pacific Market Y-o-Y Growth Comparison by Application, 2025-2035
  • Figure 120: South Asia and Pacific Market Attractiveness Analysis by Application
  • Figure 121: South Asia and Pacific Market Value Share and BPS Analysis by End-Use Industry, 2025 and 2035
  • Figure 122: South Asia and Pacific Market Y-o-Y Growth Comparison by End-Use Industry, 2025-2035
  • Figure 123: South Asia and Pacific Market Attractiveness Analysis by End-Use Industry
  • Figure 124: Middle East & Africa Market Value Share and BPS Analysis by Country, 2025 and 2035
  • Figure 125: Middle East & Africa Market Value Share and BPS Analysis by Type , 2025 and 2035
  • Figure 126: Middle East & Africa Market Y-o-Y Growth Comparison by Type , 2025-2035
  • Figure 127: Middle East & Africa Market Attractiveness Analysis by Type
  • Figure 128: Middle East & Africa Market Value Share and BPS Analysis by Grade, 2025 and 2035
  • Figure 129: Middle East & Africa Market Y-o-Y Growth Comparison by Grade, 2025-2035
  • Figure 130: Middle East & Africa Market Attractiveness Analysis by Grade
  • Figure 131: Middle East & Africa Market Value Share and BPS Analysis by Purity, 2025 and 2035
  • Figure 132: Middle East & Africa Market Y-o-Y Growth Comparison by Purity, 2025-2035
  • Figure 133: Middle East & Africa Market Attractiveness Analysis by Purity
  • Figure 134: Middle East & Africa Market Value Share and BPS Analysis by Application, 2025 and 2035
  • Figure 135: Middle East & Africa Market Y-o-Y Growth Comparison by Application, 2025-2035
  • Figure 136: Middle East & Africa Market Attractiveness Analysis by Application
  • Figure 137: Middle East & Africa Market Value Share and BPS Analysis by End-Use Industry, 2025 and 2035
  • Figure 138: Middle East & Africa Market Y-o-Y Growth Comparison by End-Use Industry, 2025-2035
  • Figure 139: Middle East & Africa Market Attractiveness Analysis by End-Use Industry
  • Figure 140: Global Market - Tier Structure Analysis
  • Figure 141: Global Market - Company Share Analysis
Dashboard
Dashboard
Dashboard
Dashboard
Dashboard
Dashboard

Full Research Suite comprises of:

Market outlook & trends analysis

Market outlook & trends analysis

Interviews & case studies

Interviews & case studies

Strategic recommendations

Strategic recommendations

Vendor profiles & capabilities analysis

Vendor profiles & capabilities analysis

5-year forecasts

5-year forecasts

8 regions and 60+ country-level data splits

8 regions and 60+ country-level data splits

Market segment data splits

Market segment data splits

12 months of continuous data updates

12 months of continuous data updates

DELIVERED AS:

PDF EXCEL ONLINE

Full Research Suite


$5000

$7500

$10000

Buy Report Now
Similar Industry Reports

Similar Industry Reports

Acid Coil Cleaner Market

Acid Coil Cleaner Market Size and Share Forecast Outlook 2025 to 2035

Acid Filling and Leveling Machine Market

Acid Filling and Leveling Machine Market Size and Share Forecast Outlook 2025 to 2035

Acid Chlorides Market

Acid Chlorides Market Size and Share Forecast Outlook 2025 to 2035

Acid-Sensitive APIs Market

Acid-Sensitive APIs Market Analysis - Size, Share, and Forecast Outlook 2025 to 2035

Acidified Whey Protein Market

Acidified Whey Protein Market Analysis - Size, Share & Trends 2025 to 2035

Acid Dyes Market
Acid Dyes Market

Acid Dyes Market Growth - Trends & Forecast 2025 to 2035

Acidity Regulator Market

Acidity Regulator Market Growth - Trends & Forecast 2025 to 2035

Acid Proof Lining Market

Acid Proof Lining Market Trends 2025 to 2035

Acid Citrate Dextrose Tube Market

Acid Citrate Dextrose Tube Market Trends – Growth & Industry Outlook 2024-2034

Acid Orange Market
Acid Orange Market

Acid Orange Market

Antacids Market
Antacids Market

Antacids Market Analysis – Size, Trends & Forecast 2025 to 2035

Lead Acid Battery Recycling Market

Lead Acid Battery Recycling Market Size and Share Forecast Outlook 2025 to 2035

Feed Acidifier Market

Feed Acidifier Market Analysis Size Share and Forecast Outlook 2025 to 2035

Food Acidulants Market

Food Acidulants Market Growth - Key Trends, Size & Forecast 2024 to 2034

Lead Acid Battery Market

Lead Acid Battery Market Growth - Trends & Forecast 2024 to 2034

Oleic Acid Market
Oleic Acid Market

Oleic Acid Market Size and Share Forecast Outlook 2025 to 2035

Dimer Acid-based (DAB) Polyamide Resin Market

Dimer Acid-based (DABa) Polyamide Resin Market Size and Share Forecast Outlook 2025 to 2035

Humic Acid Market
Humic Acid Market

Humic Acid Market Size and Share Forecast Outlook 2025 to 2035

Fatty Acids Market
Fatty Acids Market

Fatty Acids Market Size and Share Forecast Outlook 2025 to 2035

Fatty Acid Supplements Market

Fatty Acid Supplements Market Size and Share Forecast Outlook 2025 to 2035

Future Market Insights

Phosphotungstic Acid Market

Chat With MaRIA

Chat With

MaRIA

Hi There, I am MaRIA, Your Market Research Intelligence Assistant. How may I help you?