Nootropic Energy Bars Market Size and Share Forecast Outlook 2025 to 2035

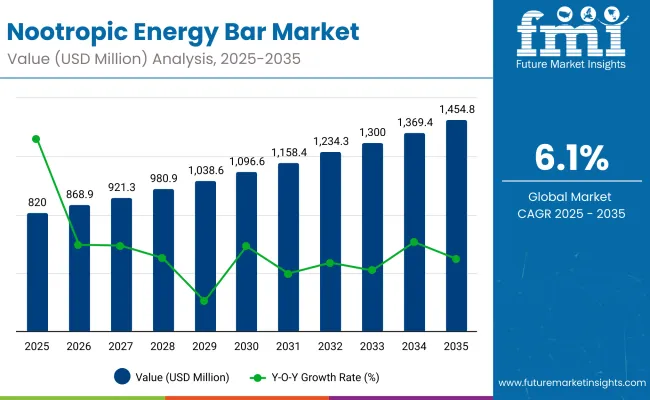
A valuation of USD 820.0 million is projected for the Nootropic Energy Bars Market in 2025, with expansion anticipated to reach USD 1,475.8 million by 2035. The absolute gain of USD 655.8 million across the decade represents a compound annual growth rate (CAGR) of 6.1%, underscoring steady expansion as functional snacking with cognitive benefits moves into mainstream adoption.
Quick Stats for Nootropic Energy Bars Market

  • • Nootropic Energy Bars Market Value (2025): USD 820.0 million
  • Nootropic Energy Bars Market Forecast Value (2035): USD 1,475.8 million
  • Nootropic Energy Bars Market Forecast CAGR (2025 to 2035): 6.1%
  • Leading Segment in Nootropic Energy Bars Market in 2025: Snack Bars (70%)
  • Key Growth Regions in the Nootropic Energy Bars Market: North America, Europe, South Asia & Pacific
  • Top Key Players in Nootropic Energy Bars Market: IQBAR, HVMN, NooWave, Bulletproof 360, Mindright

Nootropic Energy Bars Market

Nootropic Energy Bars Market Key Takeaways

Metric Value
Market Estimated Value in (2025E) USD 820 Million
Market Forecast Value in (2035F) USD 1,475.8 Million
Forecast CAGR (2025 to 2035) 6.1%

Between 2025 and 2030, the market is forecast to grow from USD 820.0 million to USD 1,100.8 million, adding nearly USD 280.8 million, which accounts for around 43% of the total expected growth for the decade. This phase will be characterized by strong uptake among students, professionals, and gamers as demand for portable mental performance solutions accelerates. Snack bars, holding a dominant 70% share, are anticipated to anchor this early-stage growth, while the focus and cognitive boost functionality is expected to lead with a 35% share in 2025, reflecting clear consumer preference for productivity-enhancing formats.

The second phase, from 2030 to 2035, is projected to contribute an additional USD 375.0 million, equal to nearly 57% of decade growth, as the market advances from USD 1,100.8 million to USD 1,475.8 million. Rising interest in adaptogens and nootropic compounds, each forecast with growth rates above 10%, is expected to reinforce premiumization trends. Mini-bites and powder-to-bar kits, despite smaller bases, are anticipated to grow faster than traditional bars, reflecting diversification of consumption occasions. By the end of the decade, regional expansion in South Asia and Europe is expected to further solidify the global footprint of nootropic energy bars.

From 2020 to 2024, the Nootropic Energy Bars Market advanced from an emerging niche category to a structured functional snacking segment, supported by growing consumer demand for cognitive performance and stress management. During this period, revenue growth was driven primarily by snack bar formats, which accounted for nearly 70% of sales in 2025, while early innovation was concentrated among specialized brands such as IQBAR, HVMN, and Bulletproof 360. Competitive differentiation relied on ingredient transparency, formulation efficacy, and distribution through direct-to-consumer and online marketplaces, while broader retail penetration was still in early stages. Services and ancillary wellness ecosystems contributed minimally, accounting for less than 10% of the value proposition.

Demand for nootropic energy bars is projected to reach USD 820.0 million in 2025, marking the transition toward mainstream adoption. The revenue mix is expected to shift as adaptogen- and nootropic compound-based formulations gain double-digit growth momentum, gradually expanding their share beyond caffeine-dominated formats. Traditional category leaders are anticipated to face rising competition from agile, digital-first brands leveraging direct consumer engagement, subscription delivery models, and performance-driven claims. Larger players are expected to pivot toward hybrid strategies, combining functional innovation with convenience-led formats such as mini-bites and powder-to-bar kits. Emerging entrants focusing on stress reduction, mental clarity, and personalized nutrition are projected to gain share. The competitive advantage is expected to evolve from single-ingredient positioning to ecosystem strength, regulatory credibility, and consumer trust reinforced through scientific substantiation and transparent labeling.

Growth in the Nootropic Energy Bars Market is being fueled by rising consumer awareness of functional nutrition and the increasing demand for convenient products that deliver cognitive support. Expansion is being supported by the adoption of clean-label formulations featuring natural stimulants, adaptogens, amino acids, and nootropic compounds that align with health-focused lifestyles.

Students, professionals, and gamers are driving demand for focus, mental clarity, and sustained alertness, while athletes and fitness enthusiasts are embracing bars for performance and recovery benefits. Stress reduction and memory enhancement claims are also gaining visibility, reinforced by growing interest in adaptogens and botanicals. The trend toward plant-based, protein-fortified, and keto-friendly bases is strengthening adoption across diverse diet groups, while online retail platforms are enabling rapid product reach and consumer education. Continued innovation in formats such as mini-bites and DIY powder-to-bar kits is expected to diversify consumption occasions, supporting broad-based category expansion over the coming decade.

Segmental Analysis

The market is segmented by ingredient type, functionality, format, base composition, consumer group, sales channel, and region. Within ingredients, categories include caffeine-based extracts, adaptogens, amino acids, nootropic compounds, and vitamins & minerals. Among these, caffeine-based bars are projected to dominate with a 28% share in 2025, supported by their well-established role in boosting alertness and mental performance.

Consumer familiarity with caffeine sources such as coffee, guarana, and green tea extract has reinforced adoption, particularly in Western markets where functional snacking is rapidly mainstreaming. Growth is also being driven by effective stacking with L-theanine and other amino acids, ensuring smoother energy release without the crash effect. While caffeine-based formulations lead, adaptogens and nootropic compounds are forecasted to expand at higher growth rates above 10% CAGR, suggesting a gradual diversification of the ingredient mix.
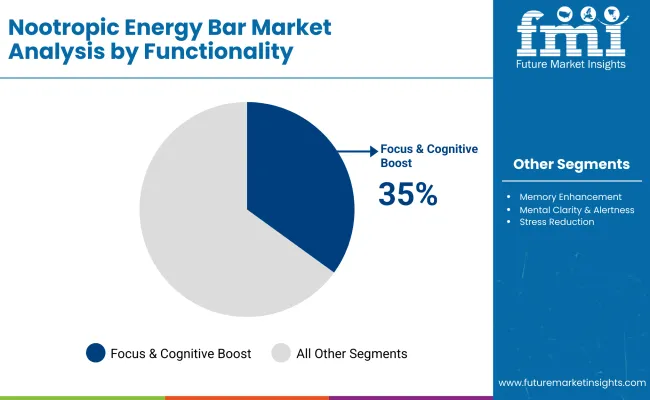
Insights into the Functionality Segment with Focus & Cognitive Boost Dominating the Demand

Nootropic Energy Bars Market By Functionality

Functionality 2025 Share
Focus & Cognitive Boost 35%
Memory Enhancement 20%
Mental Clarity & Alertness 25%
Stress Reduction 20%

Functional positioning of nootropic energy bars spans focus and cognitive boost, memory enhancement, mental clarity and alertness, and stress reduction. The focus and cognitive boost category is projected to lead in 2025 with a 35% share, driven by demand from students, professionals, and gamers seeking performance-driven outcomes. This segment has been strengthened by consumer preference for products that deliver immediate, perceptible benefits, often tied to ingredients such as caffeine, amino acids, and citicoline.

Stress reduction is expected to record the fastest growth at 10.1% CAGR, reflecting rising adoption of adaptogen-based bars containing ashwagandha and rhodiola to combat modern lifestyle pressures. Over the decade, demand is anticipated to broaden from focus-centric claims toward holistic benefits, with brands expected to integrate multiple functionalities within single products to capture wider consumer bases.
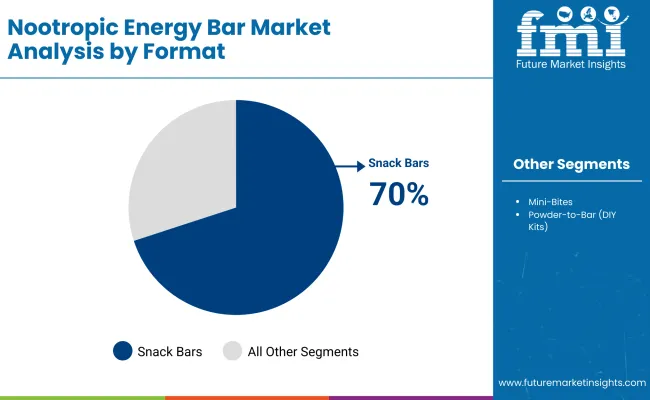
Insights into the Format Segment with Snack Bars Leading in Market Share

Nootropic Energy Bars Market By Format

Format 2025 Share
Snack Bars 70%
Mini-Bites 20%
Powder-to-Bar (DIY Kits) 10%

The format segmentation includes snack bars, mini-bites, and powder-to-bar DIY kits. Snack bars are expected to dominate with a commanding 70% share in 2025, reflecting their convenience, portability, and compatibility with established consumer snacking habits. This dominance is being reinforced by widespread retail availability and strong brand positioning around energy and productivity.

Mini-bites, although representing a smaller 20% share, are forecasted to achieve a robust 10% CAGR, as portion control and flexible dosing gain popularity among health-conscious consumers. The fastest expansion is anticipated in powder-to-bar DIY kits with 11% CAGR, offering customization and aligning with the growing do-it-yourself wellness trend. Over the decade, diversification in formats is expected to complement the core dominance of snack bars, broadening the appeal of nootropic energy bars across demographic segments and use occasions.
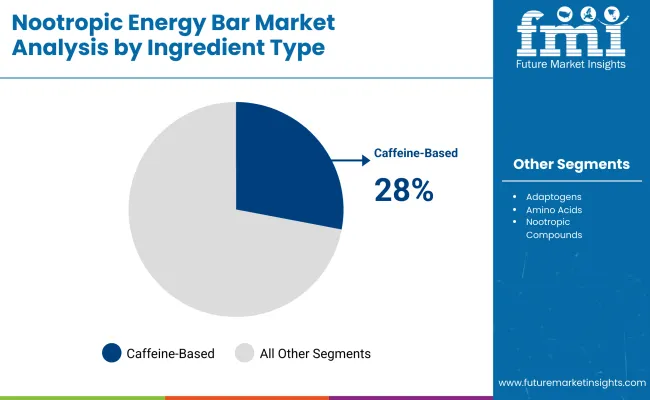
Insights into the Ingredient Segment with Caffeine-Based Leading in Market Share

Nootropic Energy Bars Market By Ingrediant

Ingredient Type 2025 Share
Caffeine-Based 28%
Adaptogens 18%
Amino Acids 15%
Nootropic Compounds 25%
Vitamins & Minerals 14%

The market is segmented by ingredient type, functionality, format, base composition, consumer group, sales channel, and region. Within ingredients, categories include caffeine-based extracts, adaptogens, amino acids, nootropic compounds, and vitamins & minerals. Among these, caffeine-based bars are projected to dominate with a 28% share in 2025, supported by their well-established role in boosting alertness and mental performance.

Consumer familiarity with caffeine sources such as coffee, guarana, and green tea extract has reinforced adoption, particularly in Western markets where functional snacking is rapidly mainstreaming. Growth is also being driven by effective stacking with L-theanine and other amino acids, ensuring smoother energy release without the crash effect. While caffeine-based formulations lead, adaptogens and nootropic compounds are forecasted to expand at higher growth rates above 10% CAGR, suggesting a gradual diversification of the ingredient mix.

What are the Drivers, Restraints, and Key Trends of the Nootropic Energy Bars Market?

The Nootropic Energy Bars Market is being shaped by complex consumer dynamics, where evolving health priorities and scientific validation are intersecting with challenges around regulatory scrutiny and premium pricing in functional food categories.

Convergence of Cognitive Nutrition and Preventive Health

Growth in the market is being accelerated by the convergence of cognitive nutrition with preventive health strategies. Consumers are increasingly perceiving mental performance as a component of overall wellness, and this shift is creating demand for functional snacking that addresses both focus and resilience. Unlike traditional energy products, nootropic bars are positioned as daily-use solutions that integrate seamlessly into dietary routines. This convergence is supported by scientific exploration of amino acids, adaptogens, and nootropic compounds, which is reinforcing consumer trust when substantiated transparently. Over the forecast period, integration with broader preventive health narratives, such as stress management and long-term brain health, is expected to redefine category relevance across multiple demographic groups.

Regulatory Ambiguity in Cognitive Claims

Market expansion is being moderated by the absence of harmonized regulatory frameworks governing nootropic claims. While caffeine-related benefits have established recognition in markets like the EU, gray zones exist around adaptogens and cognitive enhancers such as bacopa or alpha-GPC. Regulatory ambiguity introduces risks of product recalls, delisting, and reputational challenges when claims overreach scientific consensus. This dynamic is anticipated to constrain aggressive marketing strategies and compel brands to rely heavily on evidence-backed communication. As the category matures, compliance costs and claim substantiation requirements are projected to remain critical hurdles, particularly for new entrants seeking rapid scale in competitive markets.
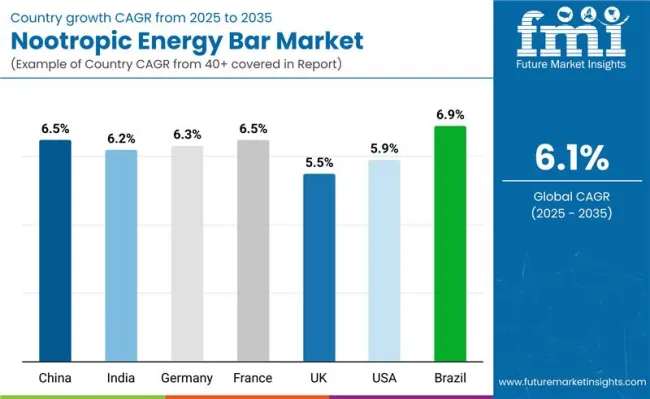
Analysis of Nootropic Energy Bars Market By Key Countries

Nootropic Energy Bars Market By Country

Countries CAGR
China 6.50%
India 6.21%
Germany 6.33%
France 6.51%
UK 5.58%
USA 5.17%
Brazil 6.91%

The Nootropic Energy Bars Market demonstrates clear disparities in country-level growth, shaped by consumer health priorities, innovation ecosystems, and regulatory climates. Brazil is forecasted to lead with a 6.91% CAGR, reflecting rapid urban adoption of functional snacks alongside increasing retail penetration in Latin America. China follows with 6.50% CAGR, where functional food categories are being accelerated by government-backed wellness initiatives and widespread consumer acceptance of adaptogens and herbal nootropics. France also shows resilience with 6.51% CAGR, supported by strong dietary supplement traditions and demand for stress reduction formulations.

Germany, at 6.33% CAGR, is projected to expand as functional snacking integrates into sports nutrition and active lifestyle categories. India, recording 6.21% CAGR, is expected to advance with a younger population base adopting cognitive nutrition for productivity and exam preparation. In contrast, the UK (5.58% CAGR) and USA (5.17% CAGR) reflect mature but slower markets, where established energy and protein bars dominate shelf space, limiting incremental share for nootropic formats. Growth in these regions is anticipated to be driven by premiumization, cleaner labels, and integration with e-commerce subscriptions. Overall, momentum is projected to be strongest in emerging economies, while Europe continues to balance tradition with innovation in functional foods.
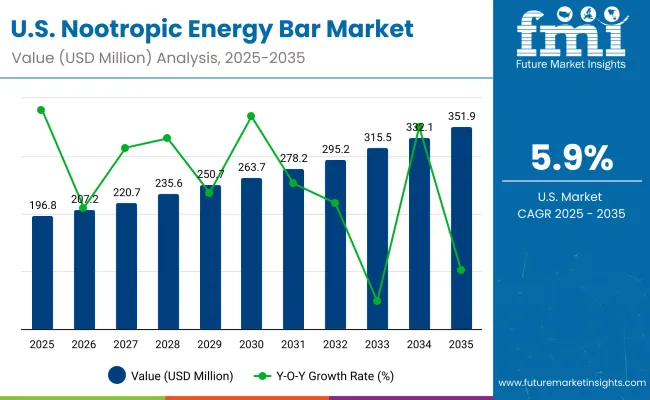
Sales Outlook for Nootropic Energy Bar in the United States

Nootropic Energy Bars Market Usa

Year USA Nootropic Energy Bars Market (USD Million)
2025 196.80
2026 207.2
2027 220.7
2028 235.6
2029 250.7
2030 263.7
2031 278.2
2032 295.2
2033 315.5
2034 332.1
2035 351.9

The Nootropic Energy Bars Market in the United States is projected to expand from USD 196.8 million in 2025 to USD 351.9 million in 2035, reflecting a CAGR of 6.0%. Growth will be underpinned by the rising alignment of cognitive nutrition with mainstream wellness trends and by consumer preference for functional snacking formats over traditional supplements.

  • Functional positioning toward focus and cognitive boost is expected to dominate, particularly among knowledge workers, gamers, and students seeking reliable performance enhancement.
  • Expanding retail penetration across convenience stores and pharmacies is anticipated to complement direct-to-consumer channels, strengthening accessibility.
  • Innovation in mini-bite formats and protein-fortified bases is likely to attract health-conscious demographics, creating incremental value.
  • Regulatory clarity around permissible claims for caffeine and amino acid combinations is projected to strengthen consumer trust and sustain premium pricing.

By the end of the decade, the USA is expected to remain a mature but steadily expanding market, with product differentiation shifting from ingredient lists toward experience-driven outcomes, transparent labeling, and recurring subscription models.

Growth and Expansion Outlook for Nootropic Energy Bars Market in the United Kingdom

The Nootropic Energy Bars Market in the UK is projected to grow at a CAGR of 5.58% between 2025 and 2035, reflecting steady adoption in a mature functional food landscape. Growth is expected to be shaped by rising interest in clean-label snacking, where cognitive and stress-relief benefits are aligned with broader wellness consumption.

  • Expansion is anticipated to be driven by mental clarity and stress reduction bars, positioned for urban professionals balancing hybrid work models.
  • Retail integration into supermarkets and convenience chains is projected to enhance reach beyond niche health stores.
  • Premiumization through adaptogen- and amino acid-based formulations is expected to gain share despite higher price sensitivity.
  • Regulatory compliance with strict UK labeling norms is forecast to reinforce consumer trust, consolidating category credibility.

Growth and Expansion Outlook for Nootropic Energy Bars Market in India

The Nootropic Energy Bars Market in India is forecasted to expand at a CAGR of 6.21% from 2025 to 2035, reflecting one of the fastest regional trajectories. Growth will be supported by a young population base, rapid urbanization, and increasing reliance on functional foods to enhance productivity and academic performance.

  • Demand is expected to be strongest among students and professionals, driving uptake of focus and alertness formulations.
  • Plant-based and protein-fortified bases are anticipated to gain momentum as vegetarian consumers adopt functional snacking.
  • Distribution growth through online marketplaces and D2C models is projected to accelerate awareness and trial.
  • Integration of adaptogens rooted in Ayurvedic heritage is expected to create culturally resonant innovation pathways.

Sales Outlook for Nootropic Energy Bar in China

The Nootropic Energy Bars Market in China is projected to record a CAGR of 6.50% between 2025 and 2035, making it a key driver of Asia’s functional food expansion. Growth is being reinforced by consumer acceptance of herbal nootropics and government-backed wellness campaigns.

  • Adoption of adaptogen- and mushroom-based bars is expected to expand, aligning with traditional medicine awareness.
  • Digital retail ecosystems and social commerce platforms are projected to dominate product discovery and engagement.
  • Young professionals in tier-1 and tier-2 cities are expected to drive volume, seeking portable formats for focus and energy.
  • Premium-positioned nootropic compounds are forecast to gain share, supported by transparency and efficacy-based marketing.

In-depth Analysis of Nootropic Energy Bar in Germany

Countries 2025
UK 18.16%
Germany 20.23%
Italy 9.10%
France 14.83%
Spain 9.36%
BENELUX 6.07%
Nordic 5.94%
Rest of Europe 16%
Countries 2035
UK 18.44%
Germany 20.92%
Italy 10.42%
France 14.70%
Spain 11.42%
BENELUX 5.25%
Nordic 5.03%
Rest of Europe 14%

The Nootropic Energy Bars Market in Germany is expected to grow at a CAGR of 6.33% during 2025-2035, reflecting robust demand in Europe’s largest functional food market. The trajectory is supported by consumer emphasis on performance nutrition and preventive health.
  • Adoption is forecasted to be highest in athletes and fitness enthusiasts, reinforcing Germany’s strong sports nutrition ecosystem.
  • Focus and memory enhancement functionalities are projected to dominate, particularly among aging populations seeking long-term cognitive support.
  • Expansion of specialty nutrition retail chains and pharmacies is anticipated to strengthen accessibility.
  • Regulatory rigor under EU frameworks is expected to favor brands with transparent labeling and scientific substantiation, reinforcing premium positioning.

Growth Outlook for Nootropic Energy Bars Market in Japan

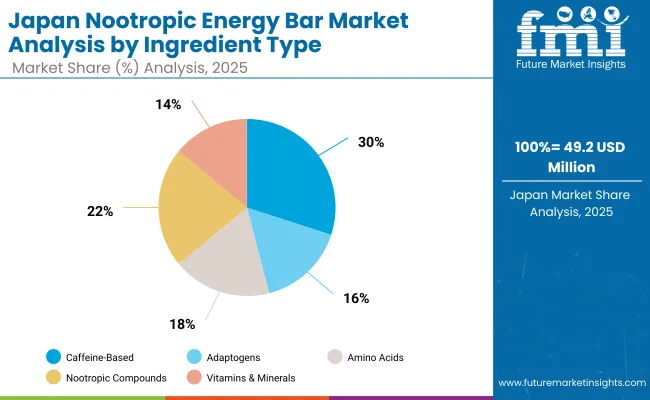
Nootropic Energy Bars Market Japan

Japan Ingredient Type 2025 Share
Caffeine-Based 30%
Adaptogens 16%
Amino Acids 18%
Nootropic Compounds 22%
Vitamins & Minerals 14%

The Nootropic Energy Bars Market in Japan is projected at USD 49.2 million in 2025, accounting for nearly 6% of the global market. Caffeine-based products contribute the largest share at 30%, while nootropic compounds hold 22%, reflecting a balanced mix between traditional stimulants and advanced cognitive enhancers. This dual dominance stems from consumer trust in familiar caffeine sources and a parallel interest in scientifically validated nootropic ingredients that promise longer-term cognitive benefits. Unlike caffeine, which provides immediate performance effects, adaptogens and amino acids are being positioned for stress resilience and sustained mental health, broadening the category’s relevance to an aging population.

Growth is further reinforced by Japan’s cultural alignment with functional foods and preventive health, where evidence-backed claims and regulatory compliance are essential for consumer adoption. As innovation in adaptogen blends and amino acid formulations deepens, the competitive landscape is expected to shift toward multi-functional bars that integrate focus, clarity, and stress reduction. By 2035, rising demand for premium, science-driven products is forecast to elevate nootropic compounds and adaptogens as stronger challengers to caffeine-led dominance.
  • Market in Japan is valued at USD 49.2 million in 2025, nearly 6% of global value
  • Caffeine-based bars lead with 30% share, but adaptogens and nootropic compounds expand fastest
  • Growth supported by preventive health culture and demand for evidence-backed cognitive nutrition

Opportunity Analysis of South Korea Nootropic Energy Bars Market

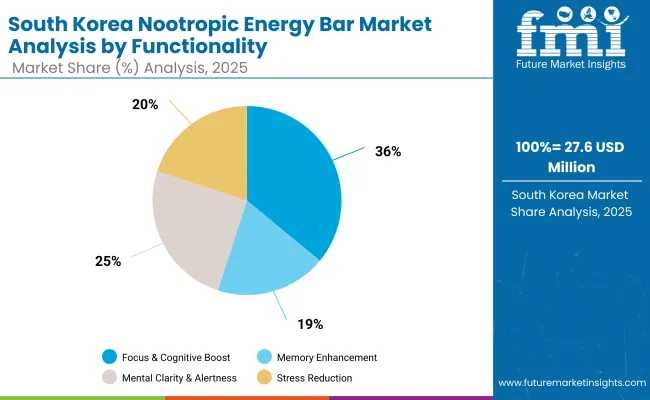
Nootropic Energy Bars Market South Korea

South Korea Functionality 2025 Share
Focus & Cognitive Boost 36%
Memory Enhancement 19%
Mental Clarity & Alertness 25%
Stress Reduction 20%

The Nootropic Energy Bars Market in South Korea is projected to hold a significant position within the Asia-Pacific region by 2025, supported by a strong culture of functional food consumption and rapid adoption of performance-driven nutrition. Focus and cognitive boost bars are expected to dominate with a 36% share, reflecting demand from students, professionals, and the highly competitive gaming community. Mental clarity and alertness products, accounting for 25%, also show strong traction, supported by consumer emphasis on productivity and balanced energy release. Stress reduction, with a 20% share, is being fueled by adaptogen-rich formulations, resonating with younger demographics facing lifestyle pressures.

Growth is anticipated to be reinforced by South Korea’s advanced retail and e-commerce ecosystem, which accelerates consumer education and trial of functional products. Regulatory frameworks requiring scientific substantiation are expected to favor brands delivering evidence-backed claims, particularly in focus and stress resilience categories. Over the coming decade, the market is projected to diversify further, with multi-functional bars that combine focus, clarity, and stress management emerging as key drivers of sustained adoption.
  • South Korea accounts for a growing share of Asia-Pacific nootropic bar sales in 2025
  • Focus & cognitive boost leads with 36%, followed by mental clarity at 25%
  • Growth supported by gaming culture, urban professional demand, and adaptogen-based stress relief

Competitive Landscape of Nootropic Energy Bars Market

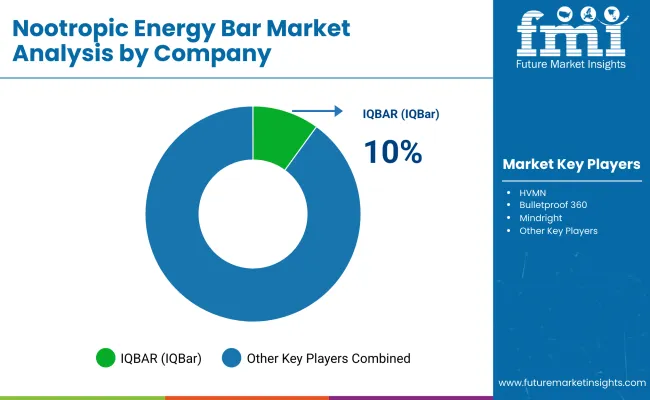
Nootropic Energy Bars Market By Company

The Nootropic Energy Bars Market is moderately fragmented, with global leaders, mid-sized innovators, and niche-focused specialists competing across diverse consumer groups and regional markets. Global leaders such as IQBAR, HVMN, and Bulletproof 360 hold significant visibility, supported by early entry advantages, established brand credibility, and strong direct-to-consumer distribution models. Their strategies are increasingly emphasizing premium formulations with amino acids, adaptogens, and nootropic compounds, while subscription-based delivery is being scaled to secure recurring revenue.

Established mid-sized innovators such as NooWave and Mindright are catering to demand for lifestyle-driven products with differentiated positioning around mental clarity, calm energy, and stress management. These brands are accelerating adoption through format innovation, including snack-sized bars and hybrid blends, while leveraging digital platforms for consumer education and engagement.

Specialized regional players are focusing on culturally resonant formulations, such as plant-based adaptogen blends in Asia and protein-fortified formats in Europe, aiming for consumer trust through local ingredient sourcing and transparent labeling. Their strength lies in agility, customization, and alignment with emerging diet trends rather than global scale.

Competitive differentiation is shifting away from simple stimulant-led propositions toward integrated wellness ecosystems, where efficacy validation, clean-label transparency, and digital engagement platforms are expected to define long-term leadership in the category.

Key Developments in Nootropic Energy Bars Market

  • In May 2025, a partnership was announced between IQBAR and Michelin-starred Chef Thomas Keller, resulting in limited-edition Salted Caramel Chip protein bars and Yuzu Mango hydration sticks. The collaboration was positioned to enhance flavor innovation while reinforcing IQBAR’s reputation for clean, functional, and performance-driven formulations.
  • In January 2025, IQBAR’s science-first strategy was spotlighted by its CEO, who emphasized formulations guided by clinically substantiated nutrients such as lion’s mane, vitamin E, and flavonoids. The approach was promoted as a differentiator, strengthening consumer trust and positioning the brand as credibility-driven within the nootropic energy bars market.

Scope of the Report

Item Value
Quantitative Units USD 820.0 Million
Ingredient Type Caffeine-Based, Adaptogens, Amino Acids, Nootropic Compounds, Vitamins & Minerals
Functionality Focus & Cognitive Boost, Memory Enhancement, Mental Clarity & Alertness, Stress Reduction
Format Snack Bars, Mini-Bites, Powder-to-Bar (DIY Kits)
Base Composition Plant-Based, Protein-Fortified, Keto -Friendly, High-Fiber
Consumer Groups Students & Professionals, Gamers & Streamers, Athletes & Fitness Enthusiasts, Senior Adults
Sales Channels Online Retail (DTC, Marketplaces), Health Stores & Pharmacies, Convenience Stores, Specialty Nutrition Chains
Regions Covered North America, Europe, Asia-Pacific, Latin America, Middle East & Africa
Country Covered United States, Canada, Germany, France, United Kingdom, China, Japan, India, Brazil, South Korea
Key Companies Profiled IQBAR, HVMN, NooWave, Bulletproof 360, Mindright
Additional Attributes Dollar sales by ingredient and functionality, adoption trends in gaming and professional productivity, demand for clean-label and plant-based formats, growth in adaptogen and amino acid formulations, rise of DIY personalization kits, regional trends in Asia and Europe, subscription-based D2C models, and emphasis on regulatory-compliant claims supported by scientific evidence.

Key Segments

By Ingredient Type:

  • Caffeine-Based (Green tea extract, Guarana, Coffee)
  • Adaptogens (Rhodiola, Ashwagandha, Ginseng)
  • Amino Acids (L-Theanine, L-Tyrosine)
  • Nootropic Compounds (Citicoline, Bacopa Monnieri, Alpha-GPC, Lion’s Mane)
  • Vitamins & Minerals (B-Vitamins, Magnesium, Zinc)

By Functionality:

  • Focus & Cognitive Boost
  • Memory Enhancement
  • Mental Clarity & Alertness
  • Stress Reduction

By Format:

  • Snack Bars
  • Mini-Bites
  • Powder-to-Bar (DIY Kits)

By Base Composition:

  • Plant-Based (Nuts, Seeds, Fruits)
  • Protein-Fortified (Whey, Pea, Brown Rice)
  • Keto-Friendly
  • High-Fiber

By Consumer Group:

  • Students & Professionals
  • Gamers & Streamers
  • Athletes & Fitness Enthusiasts
  • Senior Adults

By Sales Channel:

  • Online Retail (DTC, Marketplaces)
  • Health Stores & Pharmacies
  • Convenience Stores
  • Specialty Nutrition Chains

By Region:

  • North America
  • Latin America
  • South Asia & Pacific
  • Europe
  • East Asia
  • Middle East and Africa

Table of Content

  1. Executive Summary
    • Global Market Outlook
    • Demand-side Trends
    • Supply-side Trends
    • Technology Roadmap Analysis
    • Analysis and Recommendations
  2. Market Overview
    • Market Coverage / Taxonomy
    • Market Definition / Scope / Limitations
  3. Market Background
    • Market Dynamics
      • Drivers
      • Restraints
      • Opportunity
      • Trends
    • Scenario Forecast
      • Demand in Optimistic Scenario
      • Demand in Likely Scenario
      • Demand in Conservative Scenario
    • Opportunity Map Analysis
    • Product Life Cycle Analysis
    • Supply Chain Analysis
    • Investment Feasibility Matrix
    • Value Chain Analysis
    • PESTLE and Porter’s Analysis
    • Regulatory Landscape
    • Regional Parent Market Outlook
    • Production and Consumption Statistics
    • Import and Export Statistics
  4. Global Market Analysis 2020 to 2024 and Forecast, 2025 to 2035
    • Historical Market Size Value (USD Million) & Volume (Units) Analysis, 2020 to 2024
    • Current and Future Market Size Value (USD Million) & Volume (Units) Projections, 2025 to 2035
      • Y-o-Y Growth Trend Analysis
      • Absolute $ Opportunity Analysis
  5. Global Market Pricing Analysis 2020 to 2024 and Forecast 2025 to 2035
  6. Global Market Analysis 2020 to 2024 and Forecast 2025 to 2035, By Ingredient Type
    • Introduction / Key Findings
    • Historical Market Size Value (USD Million) & Volume (Units) Analysis By Ingredient Type, 2020 to 2024
    • Current and Future Market Size Value (USD Million) & Volume (Units) Analysis and Forecast By Ingredient Type, 2025 to 2035
      • Caffeine-Based (Green tea extract, Guarana, Coffee)
      • Adaptogens (Rhodiola, Ashwagandha, Ginseng)
      • Amino Acids (L-Theanine, L-Tyrosine)
      • Nootropic Compounds (Citicoline, Bacopa Monnieri, Alpha-GPC, Lion’s Mane)
      • Vitamins & Minerals (B-Vitamins, Magnesium, Zinc)
    • Y-o-Y Growth Trend Analysis By Ingredient Type, 2020 to 2024
    • Absolute $ Opportunity Analysis By Ingredient Type, 2025 to 2035
  7. Global Market Analysis 2020 to 2024 and Forecast 2025 to 2035, By Functionality
    • Introduction / Key Findings
    • Historical Market Size Value (USD Million) & Volume (Units) Analysis By Functionality, 2020 to 2024
    • Current and Future Market Size Value (USD Million) & Volume (Units) Analysis and Forecast By Functionality, 2025 to 2035
      • Focus & Cognitive Boost
      • Memory Enhancement
      • Mental Clarity & Alertness
      • Stress Reduction
    • Y-o-Y Growth Trend Analysis By Functionality, 2020 to 2024
    • Absolute $ Opportunity Analysis By Functionality, 2025 to 2035
  8. Global Market Analysis 2020 to 2024 and Forecast 2025 to 2035, By Format
    • Introduction / Key Findings
    • Historical Market Size Value (USD Million) & Volume (Units) Analysis By Format, 2020 to 2024
    • Current and Future Market Size Value (USD Million) & Volume (Units) Analysis and Forecast By Format, 2025 to 2035
      • Snack Bars
      • Mini-Bites
      • Powder-to-Bar (DIY Kits)
    • Y-o-Y Growth Trend Analysis By Format, 2020 to 2024
    • Absolute $ Opportunity Analysis By Format, 2025 to 2035
  9. Global Market Analysis 2020 to 2024 and Forecast 2025 to 2035, By Base Composition
    • Introduction / Key Findings
    • Historical Market Size Value (USD Million) & Volume (Units) Analysis By Base Composition, 2020 to 2024
    • Current and Future Market Size Value (USD Million) & Volume (Units) Analysis and Forecast By Base Composition, 2025 to 2035
      • Plant-Based (Nuts, Seeds, Fruits)
      • Protein-Fortified (Whey, Pea, Brown Rice)
      • Keto-Friendly
      • High-Fiber
    • Y-o-Y Growth Trend Analysis By Base Composition, 2020 to 2024
    • Absolute $ Opportunity Analysis By Base Composition, 2025 to 2035
  10. Global Market Analysis 2020 to 2024 and Forecast 2025 to 2035, By Consumer Group
    • Introduction / Key Findings
    • Historical Market Size Value (USD Million) & Volume (Units) Analysis By Consumer Group, 2020 to 2024
    • Current and Future Market Size Value (USD Million) & Volume (Units) Analysis and Forecast By Consumer Group, 2025 to 2035
      • Students & Professionals
      • Gamers & Streamers
      • Athletes & Fitness Enthusiasts
      • Senior Adults
    • Y-o-Y Growth Trend Analysis By Consumer Group, 2020 to 2024
    • Absolute $ Opportunity Analysis By Consumer Group, 2025 to 2035
  11. Global Market Analysis 2020 to 2024 and Forecast 2025 to 2035, By Sales Channel
    • Introduction / Key Findings
    • Historical Market Size Value (USD Million) & Volume (Units) Analysis By Sales Channel, 2020 to 2024
    • Current and Future Market Size Value (USD Million) & Volume (Units) Analysis and Forecast By Sales Channel, 2025 to 2035
      • Online Retail (DTC, Marketplaces)
      • Health Stores & Pharmacies
      • Convenience Stores
      • Specialty Nutrition Chains
    • Y-o-Y Growth Trend Analysis By Sales Channel, 2020 to 2024
    • Absolute $ Opportunity Analysis By Sales Channel, 2025 to 2035
  12. Global Market Analysis 2020 to 2024 and Forecast 2025 to 2035, By Region
    • Introduction
    • Historical Market Size Value (USD Million) & Volume (Units) Analysis By Region, 2020 to 2024
    • Current Market Size Value (USD Million) & Volume (Units) Analysis and Forecast By Region, 2025 to 2035
      • North America
      • Latin America
      • South Asia & Pacific
      • Europe
      • East Asia
      • Middle East and Africa
    • Market Attractiveness Analysis By Region
  13. North America Market Analysis 2020 to 2024 and Forecast 2025 to 2035, By Country
    • Historical Market Size Value (USD Million) & Volume (Units) Trend Analysis By Market Taxonomy, 2020 to 2024
    • Market Size Value (USD Million) & Volume (Units) Forecast By Market Taxonomy, 2025 to 2035
      • By Country
        • USA
        • Canada
      • By Ingredient Type
      • By Functionality
      • By Format
      • By Base Composition
      • By Consumer Group
      • By Sales Channel
    • Market Attractiveness Analysis
      • By Country
      • By Ingredient Type
      • By Functionality
      • By Format
      • By Base Composition
      • By Consumer Group
      • By Sales Channel
    • Key Takeaways
  14. Latin America Market Analysis 2020 to 2024 and Forecast 2025 to 2035, By Country
    • Historical Market Size Value (USD Million) & Volume (Units) Trend Analysis By Market Taxonomy, 2020 to 2024
    • Market Size Value (USD Million) & Volume (Units) Forecast By Market Taxonomy, 2025 to 2035
      • By Country
        • Brazil
        • Mexico
        • Colombia
        • Rest of Latin America
      • By Ingredient Type
      • By Functionality
      • By Format
      • By Base Composition
      • By Consumer Group
      • By Sales Channel
    • Market Attractiveness Analysis
      • By Country
      • By Ingredient Type
      • By Functionality
      • By Format
      • By Base Composition
      • By Consumer Group
      • By Sales Channel
    • Key Takeaways
  15. South Asia & Pacific Market Analysis 2020 to 2024 and Forecast 2025 to 2035, By Country
    • Historical Market Size Value (USD Million) & Volume (Units) Trend Analysis By Market Taxonomy, 2020 to 2024
    • Market Size Value (USD Million) & Volume (Units) Forecast By Market Taxonomy, 2025 to 2035
      • By Country
        • India
        • Thailand
        • Malaysia
        • Indonesia
        • Singapore
        • Vietnam
        • Australia
        • New Zealand
        • Rest of South Asia
      • By Ingredient Type
      • By Functionality
      • By Format
      • By Base Composition
      • By Consumer Group
      • By Sales Channel
    • Market Attractiveness Analysis
      • By Country
      • By Ingredient Type
      • By Functionality
      • By Format
      • By Base Composition
      • By Consumer Group
      • By Sales Channel
    • Key Takeaways
  16. Europe Market Analysis 2020 to 2024 and Forecast 2025 to 2035, By Country
    • Historical Market Size Value (USD Million) & Volume (Units) Trend Analysis By Market Taxonomy, 2020 to 2024
    • Market Size Value (USD Million) & Volume (Units) Forecast By Market Taxonomy, 2025 to 2035
      • By Country
        • Germany
        • UK
        • France
        • Italy
        • Spain
        • Belgium
        • Netherlands
        • Nordic
        • Switzerland
        • Russia
        • Poland
        • Rest of Europe
      • By Ingredient Type
      • By Functionality
      • By Format
      • By Base Composition
      • By Consumer Group
      • By Sales Channel
    • Market Attractiveness Analysis
      • By Country
      • By Ingredient Type
      • By Functionality
      • By Format
      • By Base Composition
      • By Consumer Group
      • By Sales Channel
    • Key Takeaways
  17. East Asia Market Analysis 2020 to 2024 and Forecast 2025 to 2035, By Country
    • Historical Market Size Value (USD Million) & Volume (Units) Trend Analysis By Market Taxonomy, 2020 to 2024
    • Market Size Value (USD Million) & Volume (Units) Forecast By Market Taxonomy, 2025 to 2035
      • By Country
        • China
        • Japan
        • South Korea
      • By Ingredient Type
      • By Functionality
      • By Format
      • By Base Composition
      • By Consumer Group
      • By Sales Channel
    • Market Attractiveness Analysis
      • By Country
      • By Ingredient Type
      • By Functionality
      • By Format
      • By Base Composition
      • By Consumer Group
      • By Sales Channel
    • Key Takeaways
  18. Middle East and Africa Market Analysis 2020 to 2024 and Forecast 2025 to 2035, By Country
    • Historical Market Size Value (USD Million) & Volume (Units) Trend Analysis By Market Taxonomy, 2020 to 2024
    • Market Size Value (USD Million) & Volume (Units) Forecast By Market Taxonomy, 2025 to 2035
      • By Country
        • Turkey
        • UAE
        • Saudi Arabia
        • Israel
        • Other GCC Countries
        • North Africa
        • South Africa
      • By Ingredient Type
      • By Functionality
      • By Format
      • By Base Composition
      • By Consumer Group
      • By Sales Channel
    • Market Attractiveness Analysis
      • By Country
      • By Ingredient Type
      • By Functionality
      • By Format
      • By Base Composition
      • By Consumer Group
      • By Sales Channel
    • Key Takeaways
  19. Key Countries Market Analysis
    • USA
      • Pricing Analysis
      • Market Share Analysis, 2024
        • By Ingredient Type
        • By Functionality
        • By Format
        • By Base Composition
        • By Consumer Group
        • By Sales Channel
    • Canada
      • Pricing Analysis
      • Market Share Analysis, 2024
        • By Ingredient Type
        • By Functionality
        • By Format
        • By Base Composition
        • By Consumer Group
        • By Sales Channel
    • Mexico
      • Pricing Analysis
      • Market Share Analysis, 2024
        • By Ingredient Type
        • By Functionality
        • By Format
        • By Base Composition
        • By Consumer Group
        • By Sales Channel
    • Brazil
      • Pricing Analysis
      • Market Share Analysis, 2024
        • By Ingredient Type
        • By Functionality
        • By Format
        • By Base Composition
        • By Consumer Group
        • By Sales Channel
    • Colombia
      • Pricing Analysis
      • Market Share Analysis, 2024
        • By Ingredient Type
        • By Functionality
        • By Format
        • By Base Composition
        • By Consumer Group
        • By Sales Channel
    • Germany
      • Pricing Analysis
      • Market Share Analysis, 2024
        • By Ingredient Type
        • By Functionality
        • By Format
        • By Base Composition
        • By Consumer Group
        • By Sales Channel
    • UK
      • Pricing Analysis
      • Market Share Analysis, 2024
        • By Ingredient Type
        • By Functionality
        • By Format
        • By Base Composition
        • By Consumer Group
        • By Sales Channel
    • Italy
      • Pricing Analysis
      • Market Share Analysis, 2024
        • By Ingredient Type
        • By Functionality
        • By Format
        • By Base Composition
        • By Consumer Group
        • By Sales Channel
    • Spain
      • Pricing Analysis
      • Market Share Analysis, 2024
        • By Ingredient Type
        • By Functionality
        • By Format
        • By Base Composition
        • By Consumer Group
        • By Sales Channel
    • France
      • Pricing Analysis
      • Market Share Analysis, 2024
        • By Ingredient Type
        • By Functionality
        • By Format
        • By Base Composition
        • By Consumer Group
        • By Sales Channel
    • India
      • Pricing Analysis
      • Market Share Analysis, 2024
        • By Ingredient Type
        • By Functionality
        • By Format
        • By Base Composition
        • By Consumer Group
        • By Sales Channel
    • Belgium
      • Pricing Analysis
      • Market Share Analysis, 2024
        • By Ingredient Type
        • By Functionality
        • By Format
        • By Base Composition
        • By Consumer Group
        • By Sales Channel
    • Australia
      • Pricing Analysis
      • Market Share Analysis, 2024
        • By Ingredient Type
        • By Functionality
        • By Format
        • By Base Composition
        • By Consumer Group
        • By Sales Channel
    • China
      • Pricing Analysis
      • Market Share Analysis, 2024
        • By Ingredient Type
        • By Functionality
        • By Format
        • By Base Composition
        • By Consumer Group
        • By Sales Channel
    • Japan
      • Pricing Analysis
      • Market Share Analysis, 2024
        • By Ingredient Type
        • By Functionality
        • By Format
        • By Base Composition
        • By Consumer Group
        • By Sales Channel
    • South Korea
      • Pricing Analysis
      • Market Share Analysis, 2024
        • By Ingredient Type
        • By Functionality
        • By Format
        • By Base Composition
        • By Consumer Group
        • By Sales Channel
    • Russia
      • Pricing Analysis
      • Market Share Analysis, 2024
        • By Ingredient Type
        • By Functionality
        • By Format
        • By Base Composition
        • By Consumer Group
        • By Sales Channel
    • Poland
      • Pricing Analysis
      • Market Share Analysis, 2024
        • By Ingredient Type
        • By Functionality
        • By Format
        • By Base Composition
        • By Consumer Group
        • By Sales Channel
    • Hungary
      • Pricing Analysis
      • Market Share Analysis, 2024
        • By Ingredient Type
        • By Functionality
        • By Format
        • By Base Composition
        • By Consumer Group
        • By Sales Channel
    • Saudi Arabia
      • Pricing Analysis
      • Market Share Analysis, 2024
        • By Ingredient Type
        • By Functionality
        • By Format
        • By Base Composition
        • By Consumer Group
        • By Sales Channel
    • Turkey
      • Pricing Analysis
      • Market Share Analysis, 2024
        • By Ingredient Type
        • By Functionality
        • By Format
        • By Base Composition
        • By Consumer Group
        • By Sales Channel
    • South Africa
      • Pricing Analysis
      • Market Share Analysis, 2024
        • By Ingredient Type
        • By Functionality
        • By Format
        • By Base Composition
        • By Consumer Group
        • By Sales Channel
    • New Zealand
      • Pricing Analysis
      • Market Share Analysis, 2024
        • By Ingredient Type
        • By Functionality
        • By Format
        • By Base Composition
        • By Consumer Group
        • By Sales Channel
  20. Market Structure Analysis
    • Competition Dashboard
    • Competition Benchmarking
    • Market Share Analysis of Top Players
      • By Regional
      • By Ingredient Type
      • By Functionality
      • By Format
      • By Base Composition
      • By Consumer Group
      • By Sales Channel
  21. Competition Analysis
    • Competition Deep Dive
      • IQBAR (IQBar)
        • Overview
        • Product Portfolio
        • Profitability by Market Segments (Product/Age /Sales Channel/Region)
        • Sales Footprint
        • Strategy Overview
        • HVMN (Ketone-IQ, Nootropic Bars)
        • NooWave (Flow State Bar)
        • Bulletproof 360 (Bulletproof Bars)
        • Mindright (Mindright Snack Bars)
    • Assumptions & Acronyms Used
    • Research Methodology

List of Tables

  • Table 1: Global Market Value (USD Million) Forecast by Region, 2020-2035
  • Table 2: Global Market Volume (Units) Forecast by Region, 2020-2035
  • Table 3: Global Market Value (USD Million) Forecast by Ingredient Type, 2020-2035
  • Table 4: Global Market Volume (Units) Forecast by Ingredient Type, 2020-2035
  • Table 5: Global Market Value (USD Million) Forecast by Functionality, 2020-2035
  • Table 6: Global Market Volume (Units) Forecast by Functionality, 2020-2035
  • Table 7: Global Market Value (USD Million) Forecast by Format, 2020-2035
  • Table 8: Global Market Volume (Units) Forecast by Format, 2020-2035
  • Table 9: Global Market Value (USD Million) Forecast by Base Composition, 2020-2035
  • Table 10: Global Market Volume (Units) Forecast by Base Composition, 2020-2035
  • Table 11: Global Market Value (USD Million) Forecast by Consumer Group, 2020-2035
  • Table 12: Global Market Volume (Units) Forecast by Consumer Group, 2020-2035
  • Table 13: Global Market Value (USD Million) Forecast by Sales Channel, 2020-2035
  • Table 14: Global Market Volume (Units) Forecast by Sales Channel, 2020-2035
  • Table 15: North America Market Value (USD Million) Forecast by Country, 2020-2035
  • Table 16: North America Market Volume (Units) Forecast by Country, 2020-2035
  • Table 17: North America Market Value (USD Million) Forecast by Ingredient Type, 2020-2035
  • Table 18: North America Market Volume (Units) Forecast by Ingredient Type, 2020-2035
  • Table 19: North America Market Value (USD Million) Forecast by Functionality, 2020-2035
  • Table 20: North America Market Volume (Units) Forecast by Functionality, 2020-2035
  • Table 21: North America Market Value (USD Million) Forecast by Format, 2020-2035
  • Table 22: North America Market Volume (Units) Forecast by Format, 2020-2035
  • Table 23: North America Market Value (USD Million) Forecast by Base Composition, 2020-2035
  • Table 24: North America Market Volume (Units) Forecast by Base Composition, 2020-2035
  • Table 25: North America Market Value (USD Million) Forecast by Consumer Group, 2020-2035
  • Table 26: North America Market Volume (Units) Forecast by Consumer Group, 2020-2035
  • Table 27: North America Market Value (USD Million) Forecast by Sales Channel, 2020-2035
  • Table 28: North America Market Volume (Units) Forecast by Sales Channel, 2020-2035
  • Table 29: Latin America Market Value (USD Million) Forecast by Country, 2020-2035
  • Table 30: Latin America Market Volume (Units) Forecast by Country, 2020-2035
  • Table 31: Latin America Market Value (USD Million) Forecast by Ingredient Type, 2020-2035
  • Table 32: Latin America Market Volume (Units) Forecast by Ingredient Type, 2020-2035
  • Table 33: Latin America Market Value (USD Million) Forecast by Functionality, 2020-2035
  • Table 34: Latin America Market Volume (Units) Forecast by Functionality, 2020-2035
  • Table 35: Latin America Market Value (USD Million) Forecast by Format, 2020-2035
  • Table 36: Latin America Market Volume (Units) Forecast by Format, 2020-2035
  • Table 37: Latin America Market Value (USD Million) Forecast by Base Composition, 2020-2035
  • Table 38: Latin America Market Volume (Units) Forecast by Base Composition, 2020-2035
  • Table 39: Latin America Market Value (USD Million) Forecast by Consumer Group, 2020-2035
  • Table 40: Latin America Market Volume (Units) Forecast by Consumer Group, 2020-2035
  • Table 41: Latin America Market Value (USD Million) Forecast by Sales Channel, 2020-2035
  • Table 42: Latin America Market Volume (Units) Forecast by Sales Channel, 2020-2035
  • Table 43: South Asia & Pacific Market Value (USD Million) Forecast by Country, 2020-2035
  • Table 44: South Asia & Pacific Market Volume (Units) Forecast by Country, 2020-2035
  • Table 45: South Asia & Pacific Market Value (USD Million) Forecast by Ingredient Type, 2020-2035
  • Table 46: South Asia & Pacific Market Volume (Units) Forecast by Ingredient Type, 2020-2035
  • Table 47: South Asia & Pacific Market Value (USD Million) Forecast by Functionality, 2020-2035
  • Table 48: South Asia & Pacific Market Volume (Units) Forecast by Functionality, 2020-2035
  • Table 49: South Asia & Pacific Market Value (USD Million) Forecast by Format, 2020-2035
  • Table 50: South Asia & Pacific Market Volume (Units) Forecast by Format, 2020-2035
  • Table 51: South Asia & Pacific Market Value (USD Million) Forecast by Base Composition, 2020-2035
  • Table 52: South Asia & Pacific Market Volume (Units) Forecast by Base Composition, 2020-2035
  • Table 53: South Asia & Pacific Market Value (USD Million) Forecast by Consumer Group, 2020-2035
  • Table 54: South Asia & Pacific Market Volume (Units) Forecast by Consumer Group, 2020-2035
  • Table 55: South Asia & Pacific Market Value (USD Million) Forecast by Sales Channel, 2020-2035
  • Table 56: South Asia & Pacific Market Volume (Units) Forecast by Sales Channel, 2020-2035
  • Table 57: Europe Market Value (USD Million) Forecast by Country, 2020-2035
  • Table 58: Europe Market Volume (Units) Forecast by Country, 2020-2035
  • Table 59: Europe Market Value (USD Million) Forecast by Ingredient Type, 2020-2035
  • Table 60: Europe Market Volume (Units) Forecast by Ingredient Type, 2020-2035
  • Table 61: Europe Market Value (USD Million) Forecast by Functionality, 2020-2035
  • Table 62: Europe Market Volume (Units) Forecast by Functionality, 2020-2035
  • Table 63: Europe Market Value (USD Million) Forecast by Format, 2020-2035
  • Table 64: Europe Market Volume (Units) Forecast by Format, 2020-2035
  • Table 65: Europe Market Value (USD Million) Forecast by Base Composition, 2020-2035
  • Table 66: Europe Market Volume (Units) Forecast by Base Composition, 2020-2035
  • Table 67: Europe Market Value (USD Million) Forecast by Consumer Group, 2020-2035
  • Table 68: Europe Market Volume (Units) Forecast by Consumer Group, 2020-2035
  • Table 69: Europe Market Value (USD Million) Forecast by Sales Channel, 2020-2035
  • Table 70: Europe Market Volume (Units) Forecast by Sales Channel, 2020-2035
  • Table 71: East Asia Market Value (USD Million) Forecast by Country, 2020-2035
  • Table 72: East Asia Market Volume (Units) Forecast by Country, 2020-2035
  • Table 73: East Asia Market Value (USD Million) Forecast by Ingredient Type, 2020-2035
  • Table 74: East Asia Market Volume (Units) Forecast by Ingredient Type, 2020-2035
  • Table 75: East Asia Market Value (USD Million) Forecast by Functionality, 2020-2035
  • Table 76: East Asia Market Volume (Units) Forecast by Functionality, 2020-2035
  • Table 77: East Asia Market Value (USD Million) Forecast by Format, 2020-2035
  • Table 78: East Asia Market Volume (Units) Forecast by Format, 2020-2035
  • Table 79: East Asia Market Value (USD Million) Forecast by Base Composition, 2020-2035
  • Table 80: East Asia Market Volume (Units) Forecast by Base Composition, 2020-2035
  • Table 81: East Asia Market Value (USD Million) Forecast by Consumer Group, 2020-2035
  • Table 82: East Asia Market Volume (Units) Forecast by Consumer Group, 2020-2035
  • Table 83: East Asia Market Value (USD Million) Forecast by Sales Channel, 2020-2035
  • Table 84: East Asia Market Volume (Units) Forecast by Sales Channel, 2020-2035
  • Table 85: Middle East and Africa Market Value (USD Million) Forecast by Country, 2020-2035
  • Table 86: Middle East and Africa Market Volume (Units) Forecast by Country, 2020-2035
  • Table 87: Middle East and Africa Market Value (USD Million) Forecast by Ingredient Type, 2020-2035
  • Table 88: Middle East and Africa Market Volume (Units) Forecast by Ingredient Type, 2020-2035
  • Table 89: Middle East and Africa Market Value (USD Million) Forecast by Functionality, 2020-2035
  • Table 90: Middle East and Africa Market Volume (Units) Forecast by Functionality, 2020-2035
  • Table 91: Middle East and Africa Market Value (USD Million) Forecast by Format, 2020-2035
  • Table 92: Middle East and Africa Market Volume (Units) Forecast by Format, 2020-2035
  • Table 93: Middle East and Africa Market Value (USD Million) Forecast by Base Composition, 2020-2035
  • Table 94: Middle East and Africa Market Volume (Units) Forecast by Base Composition, 2020-2035
  • Table 95: Middle East and Africa Market Value (USD Million) Forecast by Consumer Group, 2020-2035
  • Table 96: Middle East and Africa Market Volume (Units) Forecast by Consumer Group, 2020-2035
  • Table 97: Middle East and Africa Market Value (USD Million) Forecast by Sales Channel, 2020-2035
  • Table 98: Middle East and Africa Market Volume (Units) Forecast by Sales Channel, 2020-2035

List of Figures

  • Figure 1: Global Market Volume (Units) Forecast 2020-2035
  • Figure 2: Global Market Pricing Analysis
  • Figure 3: Global Market Value (USD Million) Forecast 2020-2035
  • Figure 4: Global Market Value Share and BPS Analysis by Ingredient Type, 2025 and 2035
  • Figure 5: Global Market Y-o-Y Growth Comparison by Ingredient Type, 2025-2035
  • Figure 6: Global Market Attractiveness Analysis by Ingredient Type
  • Figure 7: Global Market Value Share and BPS Analysis by Functionality, 2025 and 2035
  • Figure 8: Global Market Y-o-Y Growth Comparison by Functionality, 2025-2035
  • Figure 9: Global Market Attractiveness Analysis by Functionality
  • Figure 10: Global Market Value Share and BPS Analysis by Format, 2025 and 2035
  • Figure 11: Global Market Y-o-Y Growth Comparison by Format, 2025-2035
  • Figure 12: Global Market Attractiveness Analysis by Format
  • Figure 13: Global Market Value Share and BPS Analysis by Base Composition, 2025 and 2035
  • Figure 14: Global Market Y-o-Y Growth Comparison by Base Composition, 2025-2035
  • Figure 15: Global Market Attractiveness Analysis by Base Composition
  • Figure 16: Global Market Value Share and BPS Analysis by Consumer Group, 2025 and 2035
  • Figure 17: Global Market Y-o-Y Growth Comparison by Consumer Group, 2025-2035
  • Figure 18: Global Market Attractiveness Analysis by Consumer Group
  • Figure 19: Global Market Value Share and BPS Analysis by Sales Channel, 2025 and 2035
  • Figure 20: Global Market Y-o-Y Growth Comparison by Sales Channel, 2025-2035
  • Figure 21: Global Market Attractiveness Analysis by Sales Channel
  • Figure 22: Global Market Value (USD Million) Share and BPS Analysis by Region, 2025 and 2035
  • Figure 23: Global Market Y-o-Y Growth Comparison by Region, 2025-2035
  • Figure 24: Global Market Attractiveness Analysis by Region
  • Figure 25: North America Market Incremental $ Opportunity, 2025-2035
  • Figure 26: Latin America Market Incremental $ Opportunity, 2025-2035
  • Figure 27: South Asia & Pacific Market Incremental $ Opportunity, 2025-2035
  • Figure 28: Europe Market Incremental $ Opportunity, 2025-2035
  • Figure 29: East Asia Market Incremental $ Opportunity, 2025-2035
  • Figure 30: Middle East and Africa Market Incremental $ Opportunity, 2025-2035
  • Figure 31: North America Market Value Share and BPS Analysis by Country, 2025 and 2035
  • Figure 32: North America Market Value Share and BPS Analysis by Ingredient Type, 2025 and 2035
  • Figure 33: North America Market Y-o-Y Growth Comparison by Ingredient Type, 2025-2035
  • Figure 34: North America Market Attractiveness Analysis by Ingredient Type
  • Figure 35: North America Market Value Share and BPS Analysis by Functionality, 2025 and 2035
  • Figure 36: North America Market Y-o-Y Growth Comparison by Functionality, 2025-2035
  • Figure 37: North America Market Attractiveness Analysis by Functionality
  • Figure 38: North America Market Value Share and BPS Analysis by Format, 2025 and 2035
  • Figure 39: North America Market Y-o-Y Growth Comparison by Format, 2025-2035
  • Figure 40: North America Market Attractiveness Analysis by Format
  • Figure 41: North America Market Value Share and BPS Analysis by Base Composition, 2025 and 2035
  • Figure 42: North America Market Y-o-Y Growth Comparison by Base Composition, 2025-2035
  • Figure 43: North America Market Attractiveness Analysis by Base Composition
  • Figure 44: North America Market Value Share and BPS Analysis by Consumer Group, 2025 and 2035
  • Figure 45: North America Market Y-o-Y Growth Comparison by Consumer Group, 2025-2035
  • Figure 46: North America Market Attractiveness Analysis by Consumer Group
  • Figure 47: North America Market Value Share and BPS Analysis by Sales Channel, 2025 and 2035
  • Figure 48: North America Market Y-o-Y Growth Comparison by Sales Channel, 2025-2035
  • Figure 49: North America Market Attractiveness Analysis by Sales Channel
  • Figure 50: Latin America Market Value Share and BPS Analysis by Country, 2025 and 2035
  • Figure 51: Latin America Market Value Share and BPS Analysis by Ingredient Type, 2025 and 2035
  • Figure 52: Latin America Market Y-o-Y Growth Comparison by Ingredient Type, 2025-2035
  • Figure 53: Latin America Market Attractiveness Analysis by Ingredient Type
  • Figure 54: Latin America Market Value Share and BPS Analysis by Functionality, 2025 and 2035
  • Figure 55: Latin America Market Y-o-Y Growth Comparison by Functionality, 2025-2035
  • Figure 56: Latin America Market Attractiveness Analysis by Functionality
  • Figure 57: Latin America Market Value Share and BPS Analysis by Format, 2025 and 2035
  • Figure 58: Latin America Market Y-o-Y Growth Comparison by Format, 2025-2035
  • Figure 59: Latin America Market Attractiveness Analysis by Format
  • Figure 60: Latin America Market Value Share and BPS Analysis by Base Composition, 2025 and 2035
  • Figure 61: Latin America Market Y-o-Y Growth Comparison by Base Composition, 2025-2035
  • Figure 62: Latin America Market Attractiveness Analysis by Base Composition
  • Figure 63: Latin America Market Value Share and BPS Analysis by Consumer Group, 2025 and 2035
  • Figure 64: Latin America Market Y-o-Y Growth Comparison by Consumer Group, 2025-2035
  • Figure 65: Latin America Market Attractiveness Analysis by Consumer Group
  • Figure 66: Latin America Market Value Share and BPS Analysis by Sales Channel, 2025 and 2035
  • Figure 67: Latin America Market Y-o-Y Growth Comparison by Sales Channel, 2025-2035
  • Figure 68: Latin America Market Attractiveness Analysis by Sales Channel
  • Figure 69: South Asia & Pacific Market Value Share and BPS Analysis by Country, 2025 and 2035
  • Figure 70: South Asia & Pacific Market Value Share and BPS Analysis by Ingredient Type, 2025 and 2035
  • Figure 71: South Asia & Pacific Market Y-o-Y Growth Comparison by Ingredient Type, 2025-2035
  • Figure 72: South Asia & Pacific Market Attractiveness Analysis by Ingredient Type
  • Figure 73: South Asia & Pacific Market Value Share and BPS Analysis by Functionality, 2025 and 2035
  • Figure 74: South Asia & Pacific Market Y-o-Y Growth Comparison by Functionality, 2025-2035
  • Figure 75: South Asia & Pacific Market Attractiveness Analysis by Functionality
  • Figure 76: South Asia & Pacific Market Value Share and BPS Analysis by Format, 2025 and 2035
  • Figure 77: South Asia & Pacific Market Y-o-Y Growth Comparison by Format, 2025-2035
  • Figure 78: South Asia & Pacific Market Attractiveness Analysis by Format
  • Figure 79: South Asia & Pacific Market Value Share and BPS Analysis by Base Composition, 2025 and 2035
  • Figure 80: South Asia & Pacific Market Y-o-Y Growth Comparison by Base Composition, 2025-2035
  • Figure 81: South Asia & Pacific Market Attractiveness Analysis by Base Composition
  • Figure 82: South Asia & Pacific Market Value Share and BPS Analysis by Consumer Group, 2025 and 2035
  • Figure 83: South Asia & Pacific Market Y-o-Y Growth Comparison by Consumer Group, 2025-2035
  • Figure 84: South Asia & Pacific Market Attractiveness Analysis by Consumer Group
  • Figure 85: South Asia & Pacific Market Value Share and BPS Analysis by Sales Channel, 2025 and 2035
  • Figure 86: South Asia & Pacific Market Y-o-Y Growth Comparison by Sales Channel, 2025-2035
  • Figure 87: South Asia & Pacific Market Attractiveness Analysis by Sales Channel
  • Figure 88: Europe Market Value Share and BPS Analysis by Country, 2025 and 2035
  • Figure 89: Europe Market Value Share and BPS Analysis by Ingredient Type, 2025 and 2035
  • Figure 90: Europe Market Y-o-Y Growth Comparison by Ingredient Type, 2025-2035
  • Figure 91: Europe Market Attractiveness Analysis by Ingredient Type
  • Figure 92: Europe Market Value Share and BPS Analysis by Functionality, 2025 and 2035
  • Figure 93: Europe Market Y-o-Y Growth Comparison by Functionality, 2025-2035
  • Figure 94: Europe Market Attractiveness Analysis by Functionality
  • Figure 95: Europe Market Value Share and BPS Analysis by Format, 2025 and 2035
  • Figure 96: Europe Market Y-o-Y Growth Comparison by Format, 2025-2035
  • Figure 97: Europe Market Attractiveness Analysis by Format
  • Figure 98: Europe Market Value Share and BPS Analysis by Base Composition, 2025 and 2035
  • Figure 99: Europe Market Y-o-Y Growth Comparison by Base Composition, 2025-2035
  • Figure 100: Europe Market Attractiveness Analysis by Base Composition
  • Figure 101: Europe Market Value Share and BPS Analysis by Consumer Group, 2025 and 2035
  • Figure 102: Europe Market Y-o-Y Growth Comparison by Consumer Group, 2025-2035
  • Figure 103: Europe Market Attractiveness Analysis by Consumer Group
  • Figure 104: Europe Market Value Share and BPS Analysis by Sales Channel, 2025 and 2035
  • Figure 105: Europe Market Y-o-Y Growth Comparison by Sales Channel, 2025-2035
  • Figure 106: Europe Market Attractiveness Analysis by Sales Channel
  • Figure 107: East Asia Market Value Share and BPS Analysis by Country, 2025 and 2035
  • Figure 108: East Asia Market Value Share and BPS Analysis by Ingredient Type, 2025 and 2035
  • Figure 109: East Asia Market Y-o-Y Growth Comparison by Ingredient Type, 2025-2035
  • Figure 110: East Asia Market Attractiveness Analysis by Ingredient Type
  • Figure 111: East Asia Market Value Share and BPS Analysis by Functionality, 2025 and 2035
  • Figure 112: East Asia Market Y-o-Y Growth Comparison by Functionality, 2025-2035
  • Figure 113: East Asia Market Attractiveness Analysis by Functionality
  • Figure 114: East Asia Market Value Share and BPS Analysis by Format, 2025 and 2035
  • Figure 115: East Asia Market Y-o-Y Growth Comparison by Format, 2025-2035
  • Figure 116: East Asia Market Attractiveness Analysis by Format
  • Figure 117: East Asia Market Value Share and BPS Analysis by Base Composition, 2025 and 2035
  • Figure 118: East Asia Market Y-o-Y Growth Comparison by Base Composition, 2025-2035
  • Figure 119: East Asia Market Attractiveness Analysis by Base Composition
  • Figure 120: East Asia Market Value Share and BPS Analysis by Consumer Group, 2025 and 2035
  • Figure 121: East Asia Market Y-o-Y Growth Comparison by Consumer Group, 2025-2035
  • Figure 122: East Asia Market Attractiveness Analysis by Consumer Group
  • Figure 123: East Asia Market Value Share and BPS Analysis by Sales Channel, 2025 and 2035
  • Figure 124: East Asia Market Y-o-Y Growth Comparison by Sales Channel, 2025-2035
  • Figure 125: East Asia Market Attractiveness Analysis by Sales Channel
  • Figure 126: Middle East and Africa Market Value Share and BPS Analysis by Country, 2025 and 2035
  • Figure 127: Middle East and Africa Market Value Share and BPS Analysis by Ingredient Type, 2025 and 2035
  • Figure 128: Middle East and Africa Market Y-o-Y Growth Comparison by Ingredient Type, 2025-2035
  • Figure 129: Middle East and Africa Market Attractiveness Analysis by Ingredient Type
  • Figure 130: Middle East and Africa Market Value Share and BPS Analysis by Functionality, 2025 and 2035
  • Figure 131: Middle East and Africa Market Y-o-Y Growth Comparison by Functionality, 2025-2035
  • Figure 132: Middle East and Africa Market Attractiveness Analysis by Functionality
  • Figure 133: Middle East and Africa Market Value Share and BPS Analysis by Format, 2025 and 2035
  • Figure 134: Middle East and Africa Market Y-o-Y Growth Comparison by Format, 2025-2035
  • Figure 135: Middle East and Africa Market Attractiveness Analysis by Format
  • Figure 136: Middle East and Africa Market Value Share and BPS Analysis by Base Composition, 2025 and 2035
  • Figure 137: Middle East and Africa Market Y-o-Y Growth Comparison by Base Composition, 2025-2035
  • Figure 138: Middle East and Africa Market Attractiveness Analysis by Base Composition
  • Figure 139: Middle East and Africa Market Value Share and BPS Analysis by Consumer Group, 2025 and 2035
  • Figure 140: Middle East and Africa Market Y-o-Y Growth Comparison by Consumer Group, 2025-2035
  • Figure 141: Middle East and Africa Market Attractiveness Analysis by Consumer Group
  • Figure 142: Middle East and Africa Market Value Share and BPS Analysis by Sales Channel, 2025 and 2035
  • Figure 143: Middle East and Africa Market Y-o-Y Growth Comparison by Sales Channel, 2025-2035
  • Figure 144: Middle East and Africa Market Attractiveness Analysis by Sales Channel
  • Figure 145: Global Market - Tier Structure Analysis
  • Figure 146: Global Market - Company Share Analysis

Frequently Asked Questions

How big is the Nootropic Energy Bars Market in 2025?

The global Nootropic Energy Bars Market is estimated to be valued at USD 820.0 million in 2025.

What will be the size of the Nootropic Energy Bars Market in 2035?

The market size for the Nootropic Energy Bars Market is projected to reach USD 1,475.8 million by 2035.

How much will the Nootropic Energy Bars Market grow between 2025 and 2035?

The Nootropic Energy Bars Market is expected to grow at a 6.1% CAGR between 2025 and 2035.

What are the key product types in the Nootropic Energy Bars Market?

The key product types in the Nootropic Energy Bars Market are Snack Bars, Mini-Bites, and Powder-to-Bar DIY Kits.

Which functionality segment will contribute the most in the Nootropic Energy Bars Market in 2025?

In terms of functionality, the Focus & Cognitive Boost segment is projected to command a 35% share in the Nootropic Energy Bars Market in 2025.

Explore Similar Insights

Future Market Insights

Nootropic Energy Bars Market