The On-orbit Satellite Servicing Market is estimated to be valued at USD 3.1 billion in 2025 and is projected to reach USD 9.5 billion by 2035, registering a compound annual growth rate (CAGR) of 11.7% over the forecast period.
The on-orbit satellite servicing market is gaining strong momentum due to increasing satellite deployment, rising demand for extended operational lifespans, and growing emphasis on in-orbit sustainability. The market is being shaped by advancements in autonomous robotics, propulsion systems, and artificial intelligence that enable precise servicing operations. Current conditions reflect steady investments from both government agencies and private space enterprises seeking to reduce replacement costs and improve asset utilization.
The market outlook remains positive as satellite constellations expand and the need for maintenance, refueling, and repositioning grows. Strategic collaborations between satellite operators and service providers are enhancing mission reliability and service coverage.
Regulatory frameworks promoting responsible orbital management and debris mitigation are further strengthening industry development The overall growth rationale is built upon the economic efficiency of extending satellite utility, technological maturity of in-orbit operations, and increasing government interest in orbital sustainability, positioning the sector for sustained global expansion.
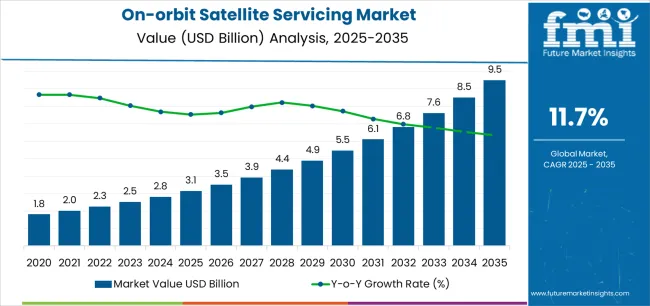
| Metric | Value |
|---|---|
| On-orbit Satellite Servicing Market Estimated Value in (2025 E) | USD 3.1 billion |
| On-orbit Satellite Servicing Market Forecast Value in (2035 F) | USD 9.5 billion |
| Forecast CAGR (2025 to 2035) | 11.7% |
The market is segmented by Type, Service, and End User and region. By Type, the market is divided into Small Satellites, Medium Satellites, and Large Satellites. In terms of Service, the market is classified into Active Debris Removal (ADR) and Orbit Adjustment, Robotic Servicing, Refueling, and Assembly. Based on End User, the market is segmented into Military And Government and Commercial. Regionally, the market is classified into North America, Latin America, Western Europe, Eastern Europe, Balkan & Baltic Countries, Russia & Belarus, Central Asia, East Asia, South Asia & Pacific, and the Middle East & Africa.
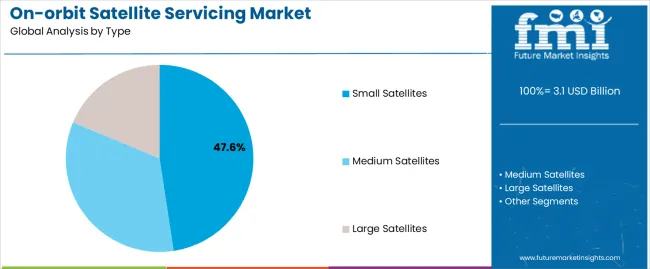
The small satellites segment, holding 47.60% of the type category, has emerged as the leading type due to its widespread adoption in communication, Earth observation, and defense applications. Market leadership is being driven by the rapid increase in small satellite launches and the cost-effectiveness of deploying and servicing such systems.
Compact design, modular configurations, and standardized interfaces have made small satellites more compatible with in-orbit servicing missions. Demand is further supported by constellation operators seeking routine maintenance, refueling, and component replacement to extend mission life.
Technological innovation in propulsion and docking mechanisms is enhancing maneuverability and service compatibility As private and governmental entities continue to expand low Earth orbit networks, small satellites are expected to remain the cornerstone of service-oriented missions, ensuring scalability and flexibility in orbital operations.
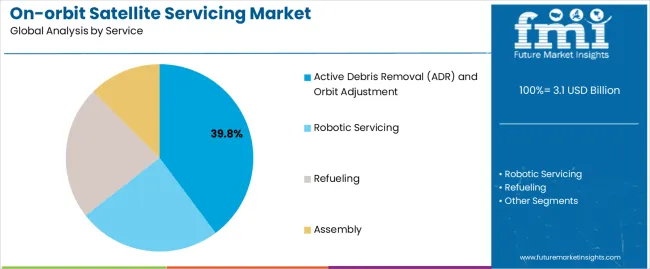
The active debris removal (ADR) and orbit adjustment segment, accounting for 39.80% of the service category, has been leading due to growing concerns over space congestion and the operational risks posed by orbital debris. The increasing number of decommissioned satellites and fragmentation debris has necessitated active removal and repositioning services.
Technological advancements in robotic capture, laser propulsion, and tether-based retrieval systems are improving service precision and reliability. Government initiatives and international collaborations focused on sustainable orbital management have been fostering service adoption.
Commercial interest in maintaining clear orbital paths for high-value assets has also strengthened demand As the volume of satellite deployments accelerates, the importance of debris mitigation and orbit optimization is expected to intensify, ensuring that ADR and orbit adjustment services remain central to long-term market development.
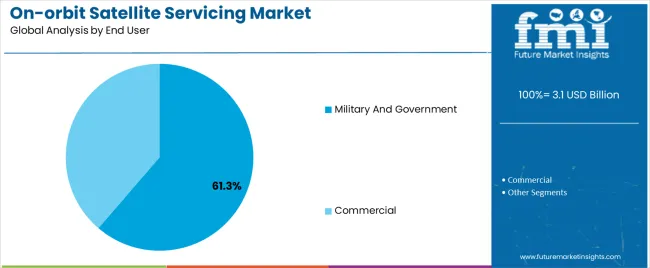
The military and government segment, representing 61.30% of the end user category, dominates the market due to substantial investment in national security, surveillance, and strategic communication programs. Adoption has been driven by the need to enhance satellite resilience, maintain operational readiness, and extend mission lifespans without full replacements.
Governments are prioritizing on-orbit servicing to protect critical assets and maintain situational awareness in contested orbital environments. The segment benefits from well-established funding channels, regulatory control, and access to advanced technologies developed through defense collaborations.
Increased participation from space agencies and defense departments in on-orbit servicing demonstrations has reinforced confidence in mission feasibility and reliability Continued investment in secure, autonomous servicing platforms is expected to sustain the segment’s dominance and strengthen its influence on global market evolution.
The small satellites segment is anticipated to experience a CAGR of 12.1% until 2035.
| Attributes | Details |
|---|---|
| Top Type | Small Satellites |
| CAGR (2025 to 2035) | 12.1% |
This rising popularity of the segment is attributed to the following reasons:
Active debris removal (ADR) and orbit adjustment services are poised to grow at a CAGR of 11.8% from 2025 to 2035.
| Attributes | Details |
|---|---|
| Top Services | Active Debris Removal (ADR) and Orbit Adjustment |
| CAGR ( 2025 to 2035) | 11.8% |
This segment examines the on-orbit satellite servicing market across various countries, encompassing the United Kingdom, the United States, China, South Korea, and Japan. The table provides CAGR projections for each country, reflecting anticipated market expansion until 2035.
| Countries | CAGR (2025 to 2035) |
|---|---|
| South Korea | 14.1% |
| Japan | 13.9% |
| United Kingdom | 13.6% |
| China | 12.9% |
| United States | 12.5% |
South Korea is emerging as a global player in the on-orbit satellite servicing market and is expected to register a CAGR of 14.1% from 2025 to 2035.
South Korea's emergence as a major player in the on-orbit satellite servicing market is driven by its cutting-edge technology, strong manufacturing base, and government support for space industry development. Korean firms leverage their expertise in robotics, electronics, and telecommunications to offer innovative servicing capabilities, which have enhanced the country's market presence.
The South Korean government has played a key role in supporting the development of the country's space industry through funding and regulatory support, which has further contributed to the country's growth in the on-orbit satellite servicing market.
Japan maintains its position as a key contributor to the on-orbit satellite servicing market, which is projected to rise at a CAGR of 13.9% through 2035.
Japan's leadership in space technology and commitment to innovation have propelled its growth in the on-orbit satellite servicing market. Japanese companies capitalize on advanced engineering capabilities, research partnerships, and government investments to deliver reliable and efficient servicing solutions.
As a result, Japan has positioned itself as a key contributor to the servicing industry. With its focus on research and development, innovative technologies, and supportive policies, Japan will likely remain a leader in the on-orbit satellite servicing market.
The United Kingdom is becoming a prominent global on-orbit satellite servicing market. With a CAGR of 13.6% projected through 2035, it is maintaining a steady pace of growth.
As a leader in satellite technology, the United Kingdom has established a strong standing in the on-orbit satellite servicing market. The country's aerospace industry has been instrumental in its growth and development in this sector.
With a focus on advanced engineering capabilities, British companies have been able to leverage government support and funding to drive innovation in servicing solutions, improving their global competitiveness.
The United Kingdom's expertise in satellite technology and its commitment to research and development are poised to help British firms maintain their position as key players in the on-orbit satellite servicing market.
The market in China is expected to expand at a CAGR of 12.9% from 2025 to 2035. China's strategic focus on space exploration and satellite technology has fueled its on-orbit satellite servicing market growth.
Chinese companies are capitalizing on government initiatives, technological advancements, and a rapidly expanding space infrastructure to offer competitive domestic and international servicing solutions. With a strong emphasis on research and development, Chinese companies have established themselves as key players in the servicing market.
China's skilled workforce, favorable policies, and supportive government have helped it maintain its position as a major player in the on-orbit satellite servicing market.
The United States is expected to emerge as a significant contender in the market, expanding at a CAGR of 12.5% until 2035.
The United States dominates the on-orbit satellite servicing market with its robust space industry, significant investments in research and development, and established partnerships with leading aerospace companies.
The United States has a conducive regulatory environment, access to capital, and a skilled workforce, positioning it as a key player in the global servicing market. American firms have leveraged these advantages to offer innovative servicing solutions that have helped them maintain their dominance in this sector.
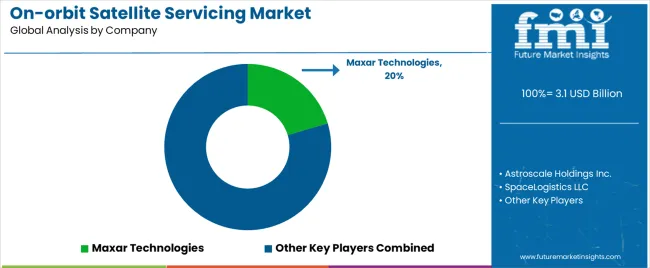
Leading companies and manufacturers in the on-orbit satellite servicing industry are focused on expanding their reach by leveraging their expertise, research and development capabilities, and strategic partnerships. These companies are investing heavily in innovation and developing advanced servicing technologies and solutions that meet the evolving needs of satellite operators worldwide.
Key Companies are building strong relationships with government agencies, commercial entities, and international partners to secure contracts and collaborations for servicing missions on a global scale. By investing in infrastructure, talent acquisition, and market development initiatives, these companies aim to establish a strong foothold in key regions.
Manufacturers are playing a crucial role in expanding the on-orbit satellite servicing market by ensuring the production of high-quality and reliable servicing equipment and components. To stay competitive in the global marketplace, manufacturers are investing in research and development to enhance the performance and efficiency of servicing systems.
Regulatory compliance and certification are also prioritized to meet the stringent requirements of international markets, facilitating the acceptance and adoption of their products worldwide. Manufacturers can expand their reach to new geographic regions and target customer segments through strategic partnerships and distribution networks.
Recent Developments
The global on-orbit satellite servicing market is estimated to be valued at USD 3.1 billion in 2025.
The market size for the on-orbit satellite servicing market is projected to reach USD 9.5 billion by 2035.
The on-orbit satellite servicing market is expected to grow at a 11.7% CAGR between 2025 and 2035.
The key product types in on-orbit satellite servicing market are small satellites, medium satellites and large satellites.
In terms of service, active debris removal (adr) and orbit adjustment segment to command 39.8% share in the on-orbit satellite servicing market in 2025.


Full Research Suite comprises of:
Market outlook & trends analysis
Interviews & case studies
Strategic recommendations
Vendor profiles & capabilities analysis
5-year forecasts
8 regions and 60+ country-level data splits
Market segment data splits
12 months of continuous data updates
DELIVERED AS:
PDF EXCEL ONLINE
Satellite Simulator Market Size and Share Forecast Outlook 2025 to 2035
Satellite Communication Components Market Size and Share Forecast Outlook 2025 to 2035
Satellite Vessel Tracking Market Size and Share Forecast Outlook 2025 to 2035
Satellite IoT Market Size and Share Forecast Outlook 2025 to 2035
Satellite Laser Communication Market Size and Share Forecast Outlook 2025 to 2035
Satellite Phased Array Antenna Market Size and Share Forecast Outlook 2025 to 2035
Satellite Solar Cell Materials Market Size and Share Forecast Outlook 2025 to 2035
Satellite-based 5G Network Market Size and Share Forecast Outlook 2025 to 2035
Satellite Launch Vehicle (SLV) Market Size and Share Forecast Outlook 2025 to 2035
Satellite Manufacturing Market Size and Share Forecast Outlook 2025 to 2035
Satellite Cables And Assemblies Market Size and Share Forecast Outlook 2025 to 2035
Satellite Component Market Size and Share Forecast Outlook 2025 to 2035
Satellite As A Service Market Size and Share Forecast Outlook 2025 to 2035
Satellite Payloads Market Size and Share Forecast Outlook 2025 to 2035
Satellite Modem Market Size and Share Forecast Outlook 2025 to 2035
Satellite Ground Station Market Trends – Growth & Forecast 2024-2034
Satellite Launch Vehicle Market Trends – Growth & Forecast 2024-2034
Satellite Antenna Market
4K Satellite Broadcasting Market Size and Share Forecast Outlook 2025 to 2035
LEO Satellite Market Size and Share Forecast Outlook 2025 to 2035

Thank you!
You will receive an email from our Business Development Manager. Please be sure to check your SPAM/JUNK folder too.
Chat With
MaRIA