Reports

- Global Locations -

Headquarters

Future Market Insights, Inc.

Christiana Corporate, 200
Continental Drive, Suite 401,
Newark, Delaware - 19713,
United States

T: +1-845-579-5705

Americas

Future Market Insights, Inc.

616 Corporate Way, Suite 2-9018,
Valley Cottage, NY 10989, United States

T: +1-347-918-3531

MEA

Future Market Insights

1602-6 Jumeirah Bay X2 Tower, Plot No: JLT-PH2-X2A,
Jumeirah Lakes Towers, Dubai,
United Arab Emirates

Europe

Future Market Insights

3rd Floor, 207 Regent Street,
W1B 3HH London
United Kingdom

T: + 44 (0) 20 8123 9659
D: +44 (0) 20 3287 4268

Asia Pacific

Future Market Insights

IndiaLand Global Tech Park, Unit UG-1, Behind Grand HighStreet, Phase 1, Hinjawadi, MH, Pune – 411057, India

Satellite Modem Market Outlook (2022 to 2032)

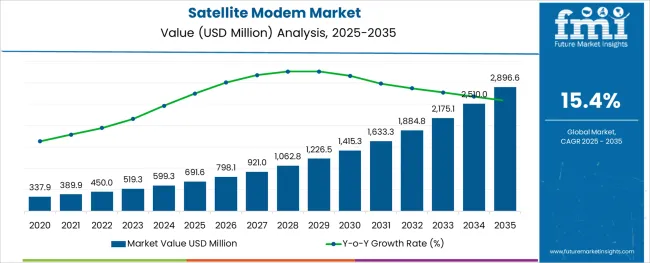
The global satellite modem market demand is anticipated to rise at a CAGR of 15.4% through 2032. The market revenue is likely to be valued at US$ 450 Million in 2022 and exhibit a revenue growth of US$ 1,890 Million by 2032.

Technological advancements in the manufacturing of next-generation smartphones, advancements in the infrastructures, and integration of technology with the existing on-premise applications to cloud networks are expected to promote satellite modem market growth. However, the latency issue with satellite modems can delay the tasks of several users, which is likely to hinder the demand for satellite modems.

Report Attribute Details
Satellite Modem Market Value (2022) US$ 450 Million
Satellite Modem Market Anticipated Value (2032) US$ 1,890 Million
Satellite Modem Projected Growth Rate (2032) 15.4%

Increasing demand for communications development from consumers and richer data transmission is expected to surge the demand for satellite modems. Various manufacturers are designing high-speed satellite modems. This is expected to be 10-30 times faster than traditional dial-up.

Achieving seamless and error-free data and video connection requires satellite modems from MCPC to connect to IP networks. Moreover, the trend of digitization in the Internet of Things (IoT) solutions is growing in popularity. In addition, high-throughput satellites (HTS) are coupled with the increasing demand for high-speed data communication. These are expected to drive the growth of the market globally majorly.

Communication system quality and aiding data security are improved owing to infinite employee mobility, reliable phone service, and a powerful end-to-end unified communications system. These are huge benefits provided by IP-trunking through the adoption of a satellite modem.

Don't pay for what you don't need

Customize your report by selecting specific countries or regions and save 30%!

What are the Key Elements that Drive the Satellite Modem Market?

There is an increasing requirement from various verticals for high-speed data communication and solutions for vehicle tracking, asset monitoring, and fleet management. This is likely to expand the market size.

High-speed network communication solutions across military, defense, enterprise, and government sectors are expected to promote market growth. In addition, the sales of satellite modems are expected to surge owing to the growing popularity of the internet, digital communication, high-speed data transfer, and global transfer. The satellite modem has widespread usage in the telecommunication industry for a secured high-speed connection. Mobile and telecom operators further deploy satellite modems owing to their efficiency despite uncertain weather conditions.

Network outages along the infrastructure due to terrestrial networks, such as cable or DSL, can be avoided by adopting a satellite modem. A complete satellite network works independently of terrestrial infrastructure and maintains prolonged connectivity. The cost efficiency of satellite modems is favorable during the lack of terrestrial connectivity. Likewise, the deployment and installation of satellite antennas require minimal duration.

What are the factors that Impede the Satellite Modem Market Growth?

The rise in demand for high bandwidth applications is unable to be met by enterprises. This is expected to hinder the sales of satellite modems. Furthermore, ambiguity in the regulatory framework governing satellite communications techniques and standards poses a major challenge for satellite operators.

Small satellite operators unfamiliar with the L, S, C, Ku, and Ka bands associated with satellite internet, face difficulties in manufacturing satellite modems for different countries or regions, incorporated with all the standards and communication protocols. Moreover, national authorities fail to provide a harmonized approach to licensing and frequency authorizations, further curbing the market growth.

The lack of international regulations on communication standards and common protocols for satellite internet is likely to hamper the demand for satellite modems. Additionally, cybersecurity breaches have increased across the globe due to the advent of technology and the implementation of 5G networks. This negatively impacts the market.

Sudip Saha
Sudip Saha

Principal Consultant

Talk to Analyst

Find your sweet spots for generating winning opportunities in this market.

What are the Possibilities that could Expand the Satellite Modem Market?

Key market players implementing plans to build satellite constellations using smaller satellites present a productive opportunity for the satellite modem market share. Further growth opportunities in the satellite modem market are attributed to the rising demand for connected healthcare devices, home devices, and connected automobiles.

The market is expected to witness significant growth through mobile technologies being paired with satellites, as well as the advent of the Internet of Things (IoT) in satellite communications. Moreover, mergers and acquisitions amongst key players further contribute to market growth.

MCPC's modern technology significantly contributes to the market growth owing to its ability to deliver finer broadband internet services and high data rate capacity. Likewise, SOTM terminals deployed in business applications additionally expand the market size.
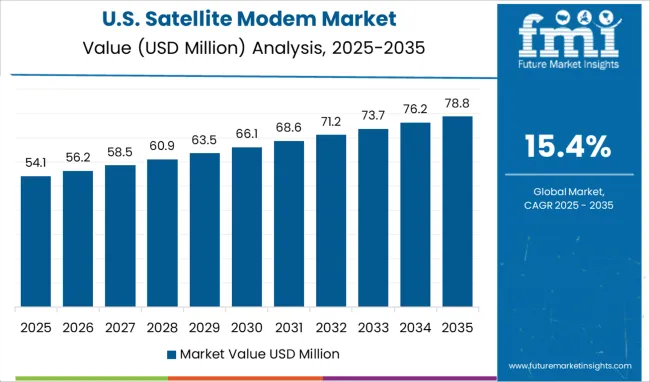
What is the Growth Outlook for the North America Satellite Modem Market?

North America is the leading satellite modem market, with a significant revenue of 34.3%. This is due to video and voice communications in military applications requiring critical decisions, which is increasing the demand for satellite communication.

Other major industries, such as oil & gas, military & defense, marine, etc., requiring voice, video, and data communication for critical and effective decision-making surge the market growth. In addition to this, the technological developments of major satellite launching enterprises, such as SpaceX and NASA, further contribute to market progress.

Get the data you need at a Fraction of the cost

Personalize your report by choosing insights you need
and save 40%!

How is the Performance of the Asia Pacific Satellite Modem Market?

The Asia Pacific is expected to showcase significant growth in the satellite modem market. This is on account of developing telecom connectivity, satellite-based backhauling, and 4G rollout in this region.

With the growth of Long-Term Evolution (LTE) technology in various Asian countries, along with the growth of broadband services in rural areas, satellite services to increase customer base are increasing in demand.

How is the Start-up Ecosystem in the Satellite Modem Market?

High-speed network communication is a growing requirement in every sector. There are a lot of criteria regarding the features of satellite modems that manufacturers have to keep in mind to cater to every consumer need. This includes better streaming services, capabilities for multiple device usage, the ability to withstand extreme weather conditions, etc.

By virtue of technological developments, these attributes can gradually be met. Naturally, start-up companies are implementing existing features of satellite internet with newer innovations to stand out in the market and improve the credibility of satellite modems.

Several start-up companies such as Gravity Internet, Numerisat, GalaxySpace, Swarm Engineers, Orbitare, LeoLabs, Akash Systems, Cesium Astro, etc. are administering various strategies such as 4x high-speed satellite internet, eco-friendly satellite internet, satellite constellation, IoT satellite connectivity, nanosatellites, etc. These will contribute significantly to the satellite modem market growth.
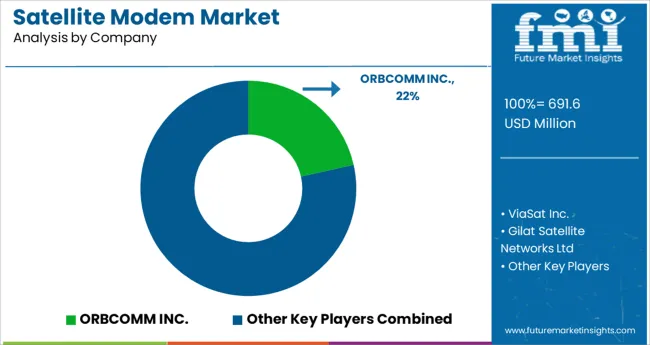
What are the Key Developments of the Satellite Modem Market?

The satellites are deployed in various industries, including agri-tech, maritime, energy, and ground transportation. These industries require faster upload speeds and seamless file sharing and backups. The ability to resist the change in weather patterns is also significantly in demand. Hence, several key players in the satellite modem market share are conducting research and development activities to initiate continuous innovations and meet these requirements.

Key market players of the satellite modem market:

  • ORBCOMM INC.
  • ViaSat Inc.
  • Gilat Satellite Networks Ltd.
  • Newtec Cy N.V.
  • Teledyne Paradise Datacom
  • Comtech EF Data Corporation
  • WORK Microwave GmbH
  • ST Engineering
  • Teledyne Technologies
  • NOVELSAT
  • Hughes Network Systems
  • ND SATCOM
  • SatixFy
  • Ayecka Communication Systems Ltd.
  • Amplus Communication Pvt. Ltd.
  • Iridium Communications Inc.
  • C-DOT
  • Thuraya Telecommunications Company
  • VT iDirect Inc.
  • Singapore Technologies Engineering Ltd.
  • Newtec CY N.V.
  • Advantech Wireless
  • Rohde & Schwarz Inradios Gmbh
  • Satcom Resources
  • Satexpander
  • Datum Systems Inc.

Some of the recent developments in the satellite modem market are:

  • In March 2021, Advantech introduced Flex I/O expansion kits for system functionality enhancement.
  • In May 2021, Gilat signed a strategic agreement with a large government corporation in Asia Pacific worth millions of dollars which included enterprise connectivity, with significant room for expansion to other applications.
  • In June 2021, Kymeta expanded government and military network offerings through a strategic partnership with Comtech.
  • In June 2021, Comtech EF Data Corp. introduced the CDM-650 satellite modem, which leveraged the heritage and feature set of Comtech’s SLM-5650B/C, CDM-625A, and CDM-425 modems, which have been deployed globally to support government and commercial applications.
  • In July 2021, ORBCOMM Inc. announced the agreement to be acquired by Gl Partners, in an all-cash transaction valued at US$ 1.1 Billion, including net debt.

Report Scope

Report Attribute Details
Growth Rate CAGR of 15.4% from 2022 to 2032
The base year for estimation 2021
Historical data 2016 to 2021
Forecast period 2022 to 2032
Quantitative units Revenue in USD million and CAGR from 2022 to 2032
Report Coverage Revenue forecast, volume forecast, company ranking, competitive landscape, growth factors, and trends, Pricing Analysis
Segments Covered Data Rate, Application, End User, and Region.
Regional scope North America; Western Europe, Eastern Europe, Middle East, Africa, ASEAN, South Asia, Rest of Asia, Australia, and New Zealand
Country scope United States of America; Canada; Mexico; Germany; United Kingdom; France; Italy; Spain; Russia; Belgium; Poland; Czech Republic; China; India; Japan; Australia; Brazil; Argentina; Colombia; Saudi Arabia; UAE; Iran; South Africa
Key companies profiled ORBCOMM INC., ViaSat Inc., Gilat Satellite Networks Ltd., Newtec Cy N.V., Teledyne Paradise Datacom, Comtech EF Data Corporation, WORK Microwave GmbH, ST Engineering, Teledyne Technologies, NOVELSAT, Hughes Network Systems, ND SATCOM, SatixFy, Ayecka Communication Systems Ltd., Amplus Communication Pvt. Ltd., Iridium Communications Inc., C-DOT, Thuraya Telecommunications Company, VT iDirect Inc., Singapore Technologies Engineering Ltd., Newtec CY N.V., Advantech Wireless, Rohde & Schwarz Inradios Gmbh, Satcom Resources, Satexpander, Datum Systems Inc.
Customization scope Free report customization (equivalent to up to 8 analysts' working days) with purchase. Addition or alteration to country, regional & segment scope.
Pricing and purchase options Avail customized purchase options to meet your exact research needs.

Key Segments Profiled in the Satellite Modem Market Survey

By Data Rate:

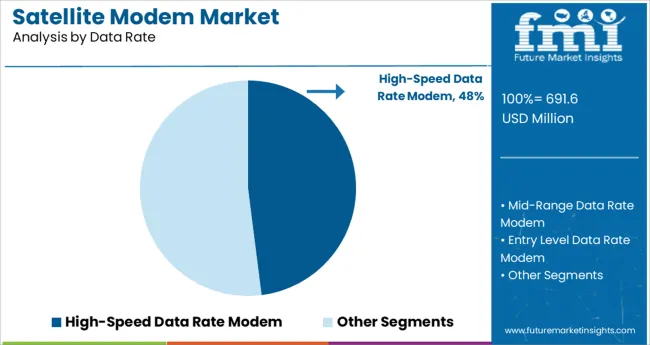
  • High-Speed Data Rate Modem
  • Mid-Range Data Rate Modem
  • Entry Level Data Rate Modem

By Application:

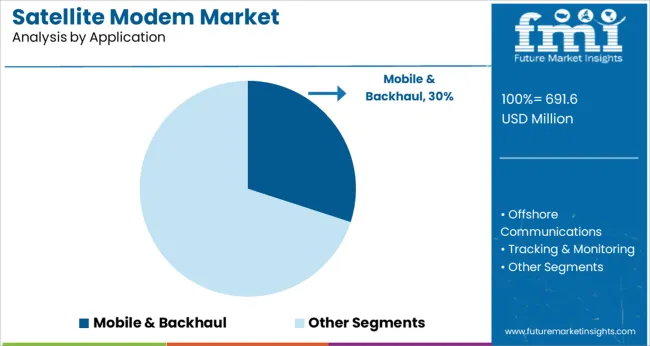
  • Mobile & Backhaul
  • Offshore Communications
  • Tracking & Monitoring
  • IP Trunking

By End User:

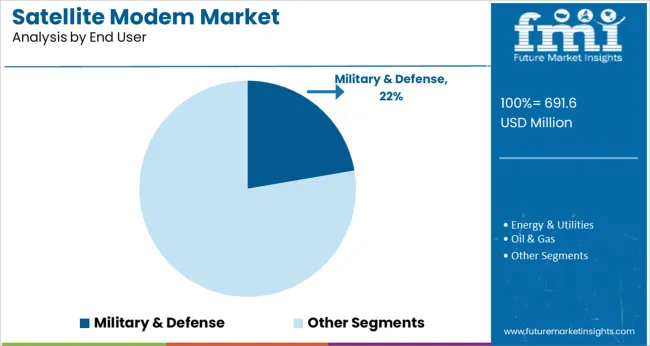
  • Military & Defense
  • Energy & Utilities
  • Oil & Gas
  • Transportation & Logistics
  • Marine
  • Mining
  • Telecommunication

By Region:

  • North America
  • Latin America
  • Asia Pacific
  • Middle East and Africa (MEA)
  • Europe

Frequently Asked Questions

How much CAGR can be Estimated for the Satellite Modem Market?

The satellite modem market is anticipated to accumulate a CAGR of 15.4% during the forecast period.

What is the Major Key Aspect of the Satellite Modem Market?

An increasing requirement from various verticals for high-speed internet/data communication.

What will be the Size of the Satellite Modem Market by 2032?

By 2032, the market is likely to grow to a revenue of US$ 1,890 Million.

Table of Content

1. Executive Summary | Satellite Modem Market

    1.1. Global Market Outlook

    1.2. Demand-side Trends

    1.3. Supply-side Trends

    1.4. Technology Roadmap Analysis

    1.5. Analysis and Recommendations

2. Market Overview

    2.1. Market Coverage / Taxonomy

    2.2. Market Definition / Scope / Limitations

3. Market Background

    3.1. Market Dynamics

        3.1.1. Drivers

        3.1.2. Restraints

        3.1.3. Opportunity

        3.1.4. Trends

    3.2. Scenario Forecast

        3.2.1. Demand in Optimistic Scenario

        3.2.2. Demand in Likely Scenario

        3.2.3. Demand in Conservative Scenario

    3.3. Opportunity Map Analysis

    3.4. Product Life Cycle Analysis

    3.5. Supply Chain Analysis

        3.5.1. Supply Side Participants and Their Roles

            3.5.1.1. Producers

            3.5.1.2. Mid-Level Participants (Traders/ Agents/ Brokers)

            3.5.1.3. Wholesalers and Distributors

        3.5.2. Value Added and Value Created at Node in the Supply Chain

        3.5.3. List of Raw Material Suppliers

        3.5.4. List of Existing and Potential Buyers

    3.6. Investment Feasibility Matrix

    3.7. Value Chain Analysis

        3.7.1. Profit Margin Analysis

        3.7.2. Wholesalers and Distributors

        3.7.3. Retailers

    3.8. PESTLE and Porter’s Analysis

    3.9. Regulatory Landscape

        3.9.1. By Key Regions

        3.9.2. By Key Countries

    3.10. Regional Parent Market Outlook

    3.11. Production and Consumption Statistics

    3.12. Import and Export Statistics

4. Global Market Analysis 2017 to 2021 and Forecast, 2022 to 2032

    4.1. Historical Market Size Value (US$ Million) & Volume (Units) Analysis, 2017 to 2021

    4.2. Current and Future Market Size Value (US$ Million) & Volume (Units) Projections, 2022 to 2032

        4.2.1. Y-o-Y Growth Trend Analysis

        4.2.2. Absolute Opportunity Analysis

5. Global Market Analysis 2017 to 2021 and Forecast 2022 to 2032, By Data Rate

    5.1. Introduction / Key Findings

    5.2. Historical Market Size Value (US$ Million) & Volume (Units) Analysis By Data Rate, 2017 to 2021

    5.3. Current and Future Market Size Value (US$ Million) & Volume (Units) Analysis and Forecast By Data Rate, 2022 to 2032

        5.3.1. High-speed Data Rate Modem

        5.3.2. Mid-range Data Rate Modem

        5.3.3. Entry-Level Data Rate Modem

    5.4. Y-o-Y Growth Trend Analysis By Data Rate, 2017 to 2021

    5.5. Absolute Opportunity Analysis By Data Rate, 2022 to 2032

6. Market Analysis 2017 to 2021 and Forecast 2022 to 2032, By Application

    6.1. IGlobal Introduction / Key Findings

    6.2. Historical Market Size Value (US$ Million) & Volume (Units) Analysis By Application, 2017 to 2021

    6.3. Current and Future Market Size Value (US$ Million) & Volume (Units) Analysis and Forecast By Application, 2022 to 2032

        6.3.1. Mobile & Backhaul

        6.3.2. Offshore Communications

        6.3.3. Tracking and Monitoring

        6.3.4. IP Trunking

    6.4. Y-o-Y Growth Trend Analysis By Application, 2017 to 2021

    6.5. Absolute Opportunity Analysis By Application, 2022 to 2032

7. Global Market Analysis 2017 to 2021 and Forecast 2022 to 2032, By End User

    7.1. Introduction / Key Findings

    7.2. Historical Market Size Value (US$ Million) & Volume (Units) Analysis By End User, 2017 to 2021

    7.3. Current and Future Market Size Value (US$ Million) & Volume (Units) Analysis and Forecast By End User, 2022 to 2032

        7.3.1. Telecommunication

        7.3.2. Marine

        7.3.3. Military and Defence

        7.3.4. Transportation & Logistics

        7.3.5. Energy & Utilities

        7.3.6. Mining

        7.3.7. Oil & Gas

        7.3.8. Others

    7.4. Y-o-Y Growth Trend Analysis By End User, 2017 to 2021

    7.5. Absolute Opportunity Analysis By End User, 2022 to 2032

8. Global Market Analysis 2017 to 2021 and Forecast 2022 to 2032, By Region

    8.1. Introduction

    8.2. Historical Market Size Value (US$ Million) & Volume (Units) Analysis By Region, 2017 to 2021

    8.3. Current Market Size Value (US$ Million) & Volume (Units) Analysis and Forecast By Region, 2022 to 2032

        8.3.1. North America

        8.3.2. Latin America

        8.3.3. Europe

        8.3.4. Asia Pacific

        8.3.5. Middle East and Africa

    8.4. Market Attractiveness Analysis By Region

9. North America Market Analysis 2017 to 2021 and Forecast 2022 to 2032, By Country

    9.1. Historical Market Size Value (US$ Million) & Volume (Units) Trend Analysis By Market Taxonomy, 2017 to 2021

    9.2. Market Size Value (US$ Million) & Volume (Units) Forecast By Market Taxonomy, 2022 to 2032

        9.2.1. By Country

            9.2.1.1. United States of America

            9.2.1.2. Canada

        9.2.2. By Data Rate

        9.2.3. By Application

        9.2.4. By End User

    9.3. Market Attractiveness Analysis

        9.3.1. By Country

        9.3.2. By Data Rate

        9.3.3. By Application

        9.3.4. By End User

    9.4. Key Takeaways

10. Latin America Market Analysis 2017 to 2021 and Forecast 2022 to 2032, By Country

    10.1. Historical Market Size Value (US$ Million) & Volume (Units) Trend Analysis By Market Taxonomy, 2017 to 2021

    10.2. Market Size Value (US$ Million) & Volume (Units) Forecast By Market Taxonomy, 2022 to 2032

        10.2.1. By Country

            10.2.1.1. Brazil

            10.2.1.2. Mexico

            10.2.1.3. Rest of Latin America

        10.2.2. By Data Rate

        10.2.3. By Application

        10.2.4. By End User

    10.3. Market Attractiveness Analysis

        10.3.1. By Country

        10.3.2. By Data Rate

        10.3.3. By Application

        10.3.4. By End User

    10.4. Key Takeaways

11. Europe Market Analysis 2017 to 2021 and Forecast 2022 to 2032, By Country

    11.1. Historical Market Size Value (US$ Million) & Volume (Units) Trend Analysis By Market Taxonomy, 2017 to 2021

    11.2. Market Size Value (US$ Million) & Volume (Units) Forecast By Market Taxonomy, 2022 to 2032

        11.2.1. By Country

            11.2.1.1. Germany

            11.2.1.2. United Kingdom

            11.2.1.3. France

            11.2.1.4. Spain

            11.2.1.5. Italy

            11.2.1.6. Rest of Europe

        11.2.2. By Data Rate

        11.2.3. By Application

        11.2.4. By End User

    11.3. Market Attractiveness Analysis

        11.3.1. By Country

        11.3.2. By Data Rate

        11.3.3. By Application

        11.3.4. By End User

    11.4. Key Takeaways

12. Asia Pacific Market Analysis 2017 to 2021 and Forecast 2022 to 2032, By Country

    12.1. Historical Market Size Value (US$ Million) & Volume (Units) Trend Analysis By Market Taxonomy, 2017 to 2021

    12.2. Market Size Value (US$ Million) & Volume (Units) Forecast By Market Taxonomy, 2022 to 2032

        12.2.1. By Country

            12.2.1.1. China

            12.2.1.2. Japan

            12.2.1.3. South Korea

            12.2.1.4. Malaysia

            12.2.1.5. Singapore

            12.2.1.6. Australia

            12.2.1.7. New Zealand

            12.2.1.8. Rest of Asia-Pacific (APAC)

        12.2.2. By Data Rate

        12.2.3. By Application

        12.2.4. By End User

    12.3. Market Attractiveness Analysis

        12.3.1. By Country

        12.3.2. By Data Rate

        12.3.3. By Application

        12.3.4. By End User

    12.4. Key Takeaways

13. Middle East and Africa Market Analysis 2017 to 2021 and Forecast 2022 to 2032, By Country

    13.1. Historical Market Size Value (US$ Million) & Volume (Units) Trend Analysis By Market Taxonomy, 2017 to 2021

    13.2. Market Size Value (US$ Million) & Volume (Units) Forecast By Market Taxonomy, 2022 to 2032

        13.2.1. By Country

            13.2.1.1. GCC Countries

            13.2.1.2. South Africa

            13.2.1.3. Israel

            13.2.1.4. Rest of Middle East and Africa

        13.2.2. By Data Rate

        13.2.3. By Application

        13.2.4. By End User

    13.3. Market Attractiveness Analysis

        13.3.1. By Country

        13.3.2. By Data Rate

        13.3.3. By Application

        13.3.4. By End User

    13.4. Key Takeaways

14. Key Countries Market Analysis

    14.1. United States of America

        14.1.1. Pricing Analysis

        14.1.2. Market Share Analysis, 2021

            14.1.2.1. By Data Rate

            14.1.2.2. By Application

            14.1.2.3. By End User

    14.2. Canada

        14.2.1. Pricing Analysis

        14.2.2. Market Share Analysis, 2021

            14.2.2.1. By Data Rate

            14.2.2.2. By Application

            14.2.2.3. By End User

    14.3. Brazil

        14.3.1. Pricing Analysis

        14.3.2. Market Share Analysis, 2021

            14.3.2.1. By Data Rate

            14.3.2.2. By Application

            14.3.2.3. By End User

    14.4. Mexico

        14.4.1. Pricing Analysis

        14.4.2. Market Share Analysis, 2021

            14.4.2.1. By Data Rate

            14.4.2.2. By Application

            14.4.2.3. By End User

    14.5. Germany

        14.5.1. Pricing Analysis

        14.5.2. Market Share Analysis, 2021

            14.5.2.1. By Data Rate

            14.5.2.2. By Application

            14.5.2.3. By End User

    14.6. United Kingdom

        14.6.1. Pricing Analysis

        14.6.2. Market Share Analysis, 2021

            14.6.2.1. By Data Rate

            14.6.2.2. By Application

            14.6.2.3. By End User

    14.7. France

        14.7.1. Pricing Analysis

        14.7.2. Market Share Analysis, 2021

            14.7.2.1. By Data Rate

            14.7.2.2. By Application

            14.7.2.3. By End User

    14.8. Spain

        14.8.1. Pricing Analysis

        14.8.2. Market Share Analysis, 2021

            14.8.2.1. By Data Rate

            14.8.2.2. By Application

            14.8.2.3. By End User

    14.9. Italy

        14.9.1. Pricing Analysis

        14.9.2. Market Share Analysis, 2021

            14.9.2.1. By Data Rate

            14.9.2.2. By Application

            14.9.2.3. By End User

    14.10. China

        14.10.1. Pricing Analysis

        14.10.2. Market Share Analysis, 2021

            14.10.2.1. By Data Rate

            14.10.2.2. By Application

            14.10.2.3. By End User

    14.11. Japan

        14.11.1. Pricing Analysis

        14.11.2. Market Share Analysis, 2021

            14.11.2.1. By Data Rate

            14.11.2.2. By Application

            14.11.2.3. By End User

    14.12. South Korea

        14.12.1. Pricing Analysis

        14.12.2. Market Share Analysis, 2021

            14.12.2.1. By Data Rate

            14.12.2.2. By Application

            14.12.2.3. By End User

    14.13. Malaysia

        14.13.1. Pricing Analysis

        14.13.2. Market Share Analysis, 2021

            14.13.2.1. By Data Rate

            14.13.2.2. By Application

            14.13.2.3. By End User

    14.14. Singapore

        14.14.1. Pricing Analysis

        14.14.2. Market Share Analysis, 2021

            14.14.2.1. By Data Rate

            14.14.2.2. By Application

            14.14.2.3. By End User

    14.15. Australia

        14.15.1. Pricing Analysis

        14.15.2. Market Share Analysis, 2021

            14.15.2.1. By Data Rate

            14.15.2.2. By Application

            14.15.2.3. By End User

    14.16. New Zealand

        14.16.1. Pricing Analysis

        14.16.2. Market Share Analysis, 2021

            14.16.2.1. By Data Rate

            14.16.2.2. By Application

            14.16.2.3. By End User

    14.17. GCC Countries

        14.17.1. Pricing Analysis

        14.17.2. Market Share Analysis, 2021

            14.17.2.1. By Data Rate

            14.17.2.2. By Application

            14.17.2.3. By End User

    14.18. South Africa

        14.18.1. Pricing Analysis

        14.18.2. Market Share Analysis, 2021

            14.18.2.1. By Data Rate

            14.18.2.2. By Application

            14.18.2.3. By End User

    14.19. Israel

        14.19.1. Pricing Analysis

        14.19.2. Market Share Analysis, 2021

            14.19.2.1. By Data Rate

            14.19.2.2. By Application

            14.19.2.3. By End User

15. Market Structure Analysis

    15.1. Competition Dashboard

    15.2. Competition Benchmarking

    15.3. Market Share Analysis of Top Players

        15.3.1. By Regional

        15.3.2. By Data Rate

        15.3.3. By Application

        15.3.4. By End User

16. Competition Analysis

    16.1. Competition Deep Dive

        16.1.1. ORBCOMM INC.

            16.1.1.1. Overview

            16.1.1.2. Product Portfolio

            16.1.1.3. Profitability by Market Segments

            16.1.1.4. Sales Footprint

            16.1.1.5. Strategy Overview

                16.1.1.5.1. Marketing Strategy

                16.1.1.5.2. Product Strategy

                16.1.1.5.3. Channel Strategy

        16.1.2. ViaSat Inc.

            16.1.2.1. Overview

            16.1.2.2. Product Portfolio

            16.1.2.3. Profitability by Market Segments

            16.1.2.4. Sales Footprint

            16.1.2.5. Strategy Overview

                16.1.2.5.1. Marketing Strategy

                16.1.2.5.2. Product Strategy

                16.1.2.5.3. Channel Strategy

        16.1.3. Gilat Satellite Networks Ltd

            16.1.3.1. Overview

            16.1.3.2. Product Portfolio

            16.1.3.3. Profitability by Market Segments

            16.1.3.4. Sales Footprint

            16.1.3.5. Strategy Overview

                16.1.3.5.1. Marketing Strategy

                16.1.3.5.2. Product Strategy

                16.1.3.5.3. Channel Strategy

        16.1.4. SatixFy

            16.1.4.1. Overview

            16.1.4.2. Product Portfolio

            16.1.4.3. Profitability by Market Segments

            16.1.4.4. Sales Footprint

            16.1.4.5. Strategy Overview

                16.1.4.5.1. Marketing Strategy

                16.1.4.5.2. Product Strategy

                16.1.4.5.3. Channel Strategy

        16.1.5. Datum Systems Inc.

            16.1.5.1. Overview

            16.1.5.2. Product Portfolio

            16.1.5.3. Profitability by Market Segments

            16.1.5.4. Sales Footprint

            16.1.5.5. Strategy Overview

                16.1.5.5.1. Marketing Strategy

                16.1.5.5.2. Product Strategy

                16.1.5.5.3. Channel Strategy

        16.1.6. Teledyne Paradise Datacom 

            16.1.6.1. Overview

            16.1.6.2. Product Portfolio

            16.1.6.3. Profitability by Market Segments

            16.1.6.4. Sales Footprint

            16.1.6.5. Strategy Overview

                16.1.6.5.1. Marketing Strategy

                16.1.6.5.2. Product Strategy

                16.1.6.5.3. Channel Strategy

        16.1.7. Comtech EF Data Corporation

            16.1.7.1. Overview

            16.1.7.2. Product Portfolio

            16.1.7.3. Profitability by Market Segments

            16.1.7.4. Sales Footprint

            16.1.7.5. Strategy Overview

                16.1.7.5.1. Marketing Strategy

                16.1.7.5.2. Product Strategy

                16.1.7.5.3. Channel Strategy

        16.1.8. Advantech Wireless

            16.1.8.1. Overview

            16.1.8.2. Product Portfolio

            16.1.8.3. Profitability by Market Segments

            16.1.8.4. Sales Footprint

            16.1.8.5. Strategy Overview

                16.1.8.5.1. Marketing Strategy

                16.1.8.5.2. Product Strategy

                16.1.8.5.3. Channel Strategy

        16.1.9. WORK Microwave GmbH

            16.1.9.1. Overview

            16.1.9.2. Product Portfolio

            16.1.9.3. Profitability by Market Segments

            16.1.9.4. Sales Footprint

            16.1.9.5. Strategy Overview

                16.1.9.5.1. Marketing Strategy

                16.1.9.5.2. Product Strategy

                16.1.9.5.3. Channel Strategy

        16.1.10. NovelSat

            16.1.10.1. Overview

            16.1.10.2. Product Portfolio

            16.1.10.3. Profitability by Market Segments

            16.1.10.4. Sales Footprint

            16.1.10.5. Strategy Overview

                16.1.10.5.1. Marketing Strategy

                16.1.10.5.2. Product Strategy

                16.1.10.5.3. Channel Strategy

        16.1.11. ST Engineering

            16.1.11.1. Overview

            16.1.11.2. Product Portfolio

            16.1.11.3. Profitability by Market Segments

            16.1.11.4. Sales Footprint

            16.1.11.5. Strategy Overview

                16.1.11.5.1. Marketing Strategy

                16.1.11.5.2. Product Strategy

                16.1.11.5.3. Channel Strategy

        16.1.12. Hughes Network Systems

            16.1.12.1. Overview

            16.1.12.2. Product Portfolio

            16.1.12.3. Profitability by Market Segments

            16.1.12.4. Sales Footprint

            16.1.12.5. Strategy Overview

                16.1.12.5.1. Marketing Strategy

                16.1.12.5.2. Product Strategy

                16.1.12.5.3. Channel Strategy

        16.1.13. Amplus Communication

            16.1.13.1. Overview

            16.1.13.2. Product Portfolio

            16.1.13.3. Profitability by Market Segments

            16.1.13.4. Sales Footprint

            16.1.13.5. Strategy Overview

                16.1.13.5.1. Marketing Strategy

                16.1.13.5.2. Product Strategy

                16.1.13.5.3. Channel Strategy

17. Assumptions & Acronyms Used

18. Research Methodology

Don't pay for what you don't need

Customize your report by selecting specific countries or regions and save 30%!

List of Tables

Table 1: Global Market Value (US$ Million) Forecast by Region, 2017 to 2032

Table 2: Global Market Volume (Units) Forecast by Region, 2017 to 2032

Table 3: Global Market Value (US$ Million) Forecast by Data Rate, 2017 to 2032

Table 4: Global Market Volume (Units) Forecast by Data Rate, 2017 to 2032

Table 5: Global Market Value (US$ Million) Forecast by Application, 2017 to 2032

Table 6: Global Market Volume (Units) Forecast by Application, 2017 to 2032

Table 7: Global Market Value (US$ Million) Forecast by End User, 2017 to 2032

Table 8: Global Market Volume (Units) Forecast by End User, 2017 to 2032

Table 9: North America Market Value (US$ Million) Forecast by Country, 2017 to 2032

Table 10: North America Market Volume (Units) Forecast by Country, 2017 to 2032

Table 11: North America Market Value (US$ Million) Forecast by Data Rate, 2017 to 2032

Table 12: North America Market Volume (Units) Forecast by Data Rate, 2017 to 2032

Table 13: North America Market Value (US$ Million) Forecast by Application, 2017 to 2032

Table 14: North America Market Volume (Units) Forecast by Application, 2017 to 2032

Table 15: North America Market Value (US$ Million) Forecast by End User, 2017 to 2032

Table 16: North America Market Volume (Units) Forecast by End User, 2017 to 2032

Table 17: Latin America Market Value (US$ Million) Forecast by Country, 2017 to 2032

Table 18: Latin America Market Volume (Units) Forecast by Country, 2017 to 2032

Table 19: Latin America Market Value (US$ Million) Forecast by Data Rate, 2017 to 2032

Table 20: Latin America Market Volume (Units) Forecast by Data Rate, 2017 to 2032

Table 21: Latin America Market Value (US$ Million) Forecast by Application, 2017 to 2032

Table 22: Latin America Market Volume (Units) Forecast by Application, 2017 to 2032

Table 23: Latin America Market Value (US$ Million) Forecast by End User, 2017 to 2032

Table 24: Latin America Market Volume (Units) Forecast by End User, 2017 to 2032

Table 25: Europe Market Value (US$ Million) Forecast by Country, 2017 to 2032

Table 26: Europe Market Volume (Units) Forecast by Country, 2017 to 2032

Table 27: Europe Market Value (US$ Million) Forecast by Data Rate, 2017 to 2032

Table 28: Europe Market Volume (Units) Forecast by Data Rate, 2017 to 2032

Table 29: Europe Market Value (US$ Million) Forecast by Application, 2017 to 2032

Table 30: Europe Market Volume (Units) Forecast by Application, 2017 to 2032

Table 31: Europe Market Value (US$ Million) Forecast by End User, 2017 to 2032

Table 32: Europe Market Volume (Units) Forecast by End User, 2017 to 2032

Table 33: Asia Pacific Market Value (US$ Million) Forecast by Country, 2017 to 2032

Table 34: Asia Pacific Market Volume (Units) Forecast by Country, 2017 to 2032

Table 35: Asia Pacific Market Value (US$ Million) Forecast by Data Rate, 2017 to 2032

Table 36: Asia Pacific Market Volume (Units) Forecast by Data Rate, 2017 to 2032

Table 37: Asia Pacific Market Value (US$ Million) Forecast by Application, 2017 to 2032

Table 38: Asia Pacific Market Volume (Units) Forecast by Application, 2017 to 2032

Table 39: Asia Pacific Market Value (US$ Million) Forecast by End User, 2017 to 2032

Table 40: Asia Pacific Market Volume (Units) Forecast by End User, 2017 to 2032

Table 41: Middle East and Africa Market Value (US$ Million) Forecast by Country, 2017 to 2032

Table 42: Middle East and Africa Market Volume (Units) Forecast by Country, 2017 to 2032

Table 43: Middle East and Africa Market Value (US$ Million) Forecast by Data Rate, 2017 to 2032

Table 44: Middle East and Africa Market Volume (Units) Forecast by Data Rate, 2017 to 2032

Table 45: Middle East and Africa Market Value (US$ Million) Forecast by Application, 2017 to 2032

Table 46: Middle East and Africa Market Volume (Units) Forecast by Application, 2017 to 2032

Table 47: Middle East and Africa Market Value (US$ Million) Forecast by End User, 2017 to 2032

Table 48: Middle East and Africa Market Volume (Units) Forecast by End User, 2017 to 2032
Sudip Saha
Sudip Saha

Principal Consultant

Talk to Analyst

Find your sweet spots for generating winning opportunities in this market.

List of Charts

Figure 1: Global Market Value (US$ Million) by Data Rate, 2022 to 2032

Figure 2: Global Market Value (US$ Million) by Application, 2022 to 2032

Figure 3: Global Market Value (US$ Million) by End User, 2022 to 2032

Figure 4: Global Market Value (US$ Million) by Region, 2022 to 2032

Figure 5: Global Market Value (US$ Million) Analysis by Region, 2017 to 2032

Figure 6: Global Market Volume (Units) Analysis by Region, 2017 to 2032

Figure 7: Global Market Value Share (%) and BPS Analysis by Region, 2022 to 2032

Figure 8: Global Market Y-o-Y Growth (%) Projections by Region, 2022 to 2032

Figure 9: Global Market Value (US$ Million) Analysis by Data Rate, 2017 to 2032

Figure 10: Global Market Volume (Units) Analysis by Data Rate, 2017 to 2032

Figure 11: Global Market Value Share (%) and BPS Analysis by Data Rate, 2022 to 2032

Figure 12: Global Market Y-o-Y Growth (%) Projections by Data Rate, 2022 to 2032

Figure 13: Global Market Value (US$ Million) Analysis by Application, 2017 to 2032

Figure 14: Global Market Volume (Units) Analysis by Application, 2017 to 2032

Figure 15: Global Market Value Share (%) and BPS Analysis by Application, 2022 to 2032

Figure 16: Global Market Y-o-Y Growth (%) Projections by Application, 2022 to 2032

Figure 17: Global Market Value (US$ Million) Analysis by End User, 2017 to 2032

Figure 18: Global Market Volume (Units) Analysis by End User, 2017 to 2032

Figure 19: Global Market Value Share (%) and BPS Analysis by End User, 2022 to 2032

Figure 20: Global Market Y-o-Y Growth (%) Projections by End User, 2022 to 2032

Figure 21: Global Market Attractiveness by Data Rate, 2022 to 2032

Figure 22: Global Market Attractiveness by Application, 2022 to 2032

Figure 23: Global Market Attractiveness by End User, 2022 to 2032

Figure 24: Global Market Attractiveness by Region, 2022 to 2032

Figure 25: North America Market Value (US$ Million) by Data Rate, 2022 to 2032

Figure 26: North America Market Value (US$ Million) by Application, 2022 to 2032

Figure 27: North America Market Value (US$ Million) by End User, 2022 to 2032

Figure 28: North America Market Value (US$ Million) by Country, 2022 to 2032

Figure 29: North America Market Value (US$ Million) Analysis by Country, 2017 to 2032

Figure 30: North America Market Volume (Units) Analysis by Country, 2017 to 2032

Figure 31: North America Market Value Share (%) and BPS Analysis by Country, 2022 to 2032

Figure 32: North America Market Y-o-Y Growth (%) Projections by Country, 2022 to 2032

Figure 33: North America Market Value (US$ Million) Analysis by Data Rate, 2017 to 2032

Figure 34: North America Market Volume (Units) Analysis by Data Rate, 2017 to 2032

Figure 35: North America Market Value Share (%) and BPS Analysis by Data Rate, 2022 to 2032

Figure 36: North America Market Y-o-Y Growth (%) Projections by Data Rate, 2022 to 2032

Figure 37: North America Market Value (US$ Million) Analysis by Application, 2017 to 2032

Figure 38: North America Market Volume (Units) Analysis by Application, 2017 to 2032

Figure 39: North America Market Value Share (%) and BPS Analysis by Application, 2022 to 2032

Figure 40: North America Market Y-o-Y Growth (%) Projections by Application, 2022 to 2032

Figure 41: North America Market Value (US$ Million) Analysis by End User, 2017 to 2032

Figure 42: North America Market Volume (Units) Analysis by End User, 2017 to 2032

Figure 43: North America Market Value Share (%) and BPS Analysis by End User, 2022 to 2032

Figure 44: North America Market Y-o-Y Growth (%) Projections by End User, 2022 to 2032

Figure 45: North America Market Attractiveness by Data Rate, 2022 to 2032

Figure 46: North America Market Attractiveness by Application, 2022 to 2032

Figure 47: North America Market Attractiveness by End User, 2022 to 2032

Figure 48: North America Market Attractiveness by Country, 2022 to 2032

Figure 49: Latin America Market Value (US$ Million) by Data Rate, 2022 to 2032

Figure 50: Latin America Market Value (US$ Million) by Application, 2022 to 2032

Figure 51: Latin America Market Value (US$ Million) by End User, 2022 to 2032

Figure 52: Latin America Market Value (US$ Million) by Country, 2022 to 2032

Figure 53: Latin America Market Value (US$ Million) Analysis by Country, 2017 to 2032

Figure 54: Latin America Market Volume (Units) Analysis by Country, 2017 to 2032

Figure 55: Latin America Market Value Share (%) and BPS Analysis by Country, 2022 to 2032

Figure 56: Latin America Market Y-o-Y Growth (%) Projections by Country, 2022 to 2032

Figure 57: Latin America Market Value (US$ Million) Analysis by Data Rate, 2017 to 2032

Figure 58: Latin America Market Volume (Units) Analysis by Data Rate, 2017 to 2032

Figure 59: Latin America Market Value Share (%) and BPS Analysis by Data Rate, 2022 to 2032

Figure 60: Latin America Market Y-o-Y Growth (%) Projections by Data Rate, 2022 to 2032

Figure 61: Latin America Market Value (US$ Million) Analysis by Application, 2017 to 2032

Figure 62: Latin America Market Volume (Units) Analysis by Application, 2017 to 2032

Figure 63: Latin America Market Value Share (%) and BPS Analysis by Application, 2022 to 2032

Figure 64: Latin America Market Y-o-Y Growth (%) Projections by Application, 2022 to 2032

Figure 65: Latin America Market Value (US$ Million) Analysis by End User, 2017 to 2032

Figure 66: Latin America Market Volume (Units) Analysis by End User, 2017 to 2032

Figure 67: Latin America Market Value Share (%) and BPS Analysis by End User, 2022 to 2032

Figure 68: Latin America Market Y-o-Y Growth (%) Projections by End User, 2022 to 2032

Figure 69: Latin America Market Attractiveness by Data Rate, 2022 to 2032

Figure 70: Latin America Market Attractiveness by Application, 2022 to 2032

Figure 71: Latin America Market Attractiveness by End User, 2022 to 2032

Figure 72: Latin America Market Attractiveness by Country, 2022 to 2032

Figure 73: Europe Market Value (US$ Million) by Data Rate, 2022 to 2032

Figure 74: Europe Market Value (US$ Million) by Application, 2022 to 2032

Figure 75: Europe Market Value (US$ Million) by End User, 2022 to 2032

Figure 76: Europe Market Value (US$ Million) by Country, 2022 to 2032

Figure 77: Europe Market Value (US$ Million) Analysis by Country, 2017 to 2032

Figure 78: Europe Market Volume (Units) Analysis by Country, 2017 to 2032

Figure 79: Europe Market Value Share (%) and BPS Analysis by Country, 2022 to 2032

Figure 80: Europe Market Y-o-Y Growth (%) Projections by Country, 2022 to 2032

Figure 81: Europe Market Value (US$ Million) Analysis by Data Rate, 2017 to 2032

Figure 82: Europe Market Volume (Units) Analysis by Data Rate, 2017 to 2032

Figure 83: Europe Market Value Share (%) and BPS Analysis by Data Rate, 2022 to 2032

Figure 84: Europe Market Y-o-Y Growth (%) Projections by Data Rate, 2022 to 2032

Figure 85: Europe Market Value (US$ Million) Analysis by Application, 2017 to 2032

Figure 86: Europe Market Volume (Units) Analysis by Application, 2017 to 2032

Figure 87: Europe Market Value Share (%) and BPS Analysis by Application, 2022 to 2032

Figure 88: Europe Market Y-o-Y Growth (%) Projections by Application, 2022 to 2032

Figure 89: Europe Market Value (US$ Million) Analysis by End User, 2017 to 2032

Figure 90: Europe Market Volume (Units) Analysis by End User, 2017 to 2032

Figure 91: Europe Market Value Share (%) and BPS Analysis by End User, 2022 to 2032

Figure 92: Europe Market Y-o-Y Growth (%) Projections by End User, 2022 to 2032

Figure 93: Europe Market Attractiveness by Data Rate, 2022 to 2032

Figure 94: Europe Market Attractiveness by Application, 2022 to 2032

Figure 95: Europe Market Attractiveness by End User, 2022 to 2032

Figure 96: Europe Market Attractiveness by Country, 2022 to 2032

Figure 97: Asia Pacific Market Value (US$ Million) by Data Rate, 2022 to 2032

Figure 98: Asia Pacific Market Value (US$ Million) by Application, 2022 to 2032

Figure 99: Asia Pacific Market Value (US$ Million) by End User, 2022 to 2032

Figure 100: Asia Pacific Market Value (US$ Million) by Country, 2022 to 2032

Figure 101: Asia Pacific Market Value (US$ Million) Analysis by Country, 2017 to 2032

Figure 102: Asia Pacific Market Volume (Units) Analysis by Country, 2017 to 2032

Figure 103: Asia Pacific Market Value Share (%) and BPS Analysis by Country, 2022 to 2032

Figure 104: Asia Pacific Market Y-o-Y Growth (%) Projections by Country, 2022 to 2032

Figure 105: Asia Pacific Market Value (US$ Million) Analysis by Data Rate, 2017 to 2032

Figure 106: Asia Pacific Market Volume (Units) Analysis by Data Rate, 2017 to 2032

Figure 107: Asia Pacific Market Value Share (%) and BPS Analysis by Data Rate, 2022 to 2032

Figure 108: Asia Pacific Market Y-o-Y Growth (%) Projections by Data Rate, 2022 to 2032

Figure 109: Asia Pacific Market Value (US$ Million) Analysis by Application, 2017 to 2032

Figure 110: Asia Pacific Market Volume (Units) Analysis by Application, 2017 to 2032

Figure 111: Asia Pacific Market Value Share (%) and BPS Analysis by Application, 2022 to 2032

Figure 112: Asia Pacific Market Y-o-Y Growth (%) Projections by Application, 2022 to 2032

Figure 113: Asia Pacific Market Value (US$ Million) Analysis by End User, 2017 to 2032

Figure 114: Asia Pacific Market Volume (Units) Analysis by End User, 2017 to 2032

Figure 115: Asia Pacific Market Value Share (%) and BPS Analysis by End User, 2022 to 2032

Figure 116: Asia Pacific Market Y-o-Y Growth (%) Projections by End User, 2022 to 2032

Figure 117: Asia Pacific Market Attractiveness by Data Rate, 2022 to 2032

Figure 118: Asia Pacific Market Attractiveness by Application, 2022 to 2032

Figure 119: Asia Pacific Market Attractiveness by End User, 2022 to 2032

Figure 120: Asia Pacific Market Attractiveness by Country, 2022 to 2032

Figure 121: Middle East and Africa Market Value (US$ Million) by Data Rate, 2022 to 2032

Figure 122: Middle East and Africa Market Value (US$ Million) by Application, 2022 to 2032

Figure 123: Middle East and Africa Market Value (US$ Million) by End User, 2022 to 2032

Figure 124: Middle East and Africa Market Value (US$ Million) by Country, 2022 to 2032

Figure 125: Middle East and Africa Market Value (US$ Million) Analysis by Country, 2017 to 2032

Figure 126: Middle East and Africa Market Volume (Units) Analysis by Country, 2017 to 2032

Figure 127: Middle East and Africa Market Value Share (%) and BPS Analysis by Country, 2022 to 2032

Figure 128: Middle East and Africa Market Y-o-Y Growth (%) Projections by Country, 2022 to 2032

Figure 129: Middle East and Africa Market Value (US$ Million) Analysis by Data Rate, 2017 to 2032

Figure 130: Middle East and Africa Market Volume (Units) Analysis by Data Rate, 2017 to 2032

Figure 131: Middle East and Africa Market Value Share (%) and BPS Analysis by Data Rate, 2022 to 2032

Figure 132: Middle East and Africa Market Y-o-Y Growth (%) Projections by Data Rate, 2022 to 2032

Figure 133: Middle East and Africa Market Value (US$ Million) Analysis by Application, 2017 to 2032

Figure 134: Middle East and Africa Market Volume (Units) Analysis by Application, 2017 to 2032

Figure 135: Middle East and Africa Market Value Share (%) and BPS Analysis by Application, 2022 to 2032

Figure 136: Middle East and Africa Market Y-o-Y Growth (%) Projections by Application, 2022 to 2032

Figure 137: Middle East and Africa Market Value (US$ Million) Analysis by End User, 2017 to 2032

Figure 138: Middle East and Africa Market Volume (Units) Analysis by End User, 2017 to 2032

Figure 139: Middle East and Africa Market Value Share (%) and BPS Analysis by End User, 2022 to 2032

Figure 140: Middle East and Africa Market Y-o-Y Growth (%) Projections by End User, 2022 to 2032

Figure 141: Middle East and Africa Market Attractiveness by Data Rate, 2022 to 2032

Figure 142: Middle East and Africa Market Attractiveness by Application, 2022 to 2032

Figure 143: Middle East and Africa Market Attractiveness by End User, 2022 to 2032

Figure 144: Middle East and Africa Market Attractiveness by Country, 2022 to 2032

Recommendations

Technology

Small Satellite Market

Published : April 2023

Technology

Navigation satellite system Market

Published : October 2022

Explore Technology Insights

View Reports