Satellite Launch Vehicle Market Size and Share Forecast Outlook From 2024 to 2034

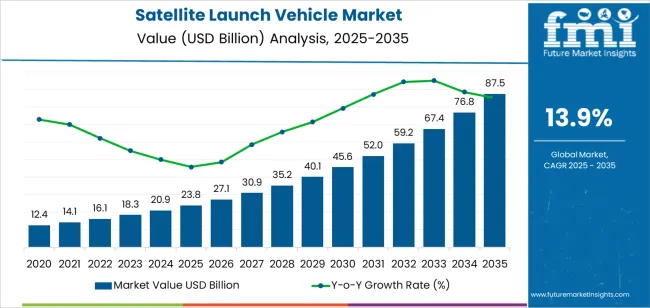
The satellite launch vehicle market is expected to grow at a CAGR of 13.9% during the projected period. The market value is projected to increase from USD 20.9 billion in 2024 to USD 76.8 billion by 2034.

Attributes Details
Satellite Launch Vehicle Market Size, 2024 USD 20.9 billion
Projected Market Size, 2034 USD 76.8 billion
Value-based CAGR (2024 to 2034) 13.9%

Top Satellite Launch Vehicle Market Dynamics and Industry Trends

  • Increasing demand for satellite applications for a wide range of applications, including communication, navigation, remote sensing, and scientific research.
  • Advancements in satellite technology lead to the rise in demand for launch vehicles that can handle heavier payloads and deliver them to a wider range of orbits.
  • Government spending on space programs is a significant driver of the satellite launch vehicle market.
  • Governments around the world are investing heavily in space exploration and research, leading to a surge in demand for launch vehicles that can deliver satellites and other payloads into space.
  • With the entry of new players into the market, there is a growing need for launch providers to differentiate themselves by offering lower prices, better performance, and more reliable services.
  • Increasing demand for reusable launch vehicles that can significantly reduce the cost of launching satellites into space, making it more accessible to a wider range of customers.
  • As a result, there is a growing demand for launch vehicles that can be reused multiple times, leading to a surge in research and development.

Lucrative Opportunities Transforming the Satellite Launch Vehicle Market

  • Increasing demand for small satellites is driving growth in the market.
  • These satellites require specialized launch vehicles that can provide low-cost and efficient launch services.
  • Small satellites present an opportunity for market players to develop small satellite launch vehicles that can cater to this growing demand.
  • The privatization of space exploration is expected to create lucrative opportunities during the forecast period.
  • Private companies are investing heavily in space exploration, and many of them require launch services for their satellites.
  • Technological advancements in satellite services are also driving the market forward.
  • For instance, the development of reusable launch vehicles is expected to reduce the cost of launch services and increase their frequency.
  • Technological development is an opportunity for market players to develop and offer reusable launch vehicles to cater to this demand.
  • Government funding for space exploration is on the rise.
  • With more funding, governments are launching more satellites, which increases the demand for launch services.

Factors Restraining the Demand for Satellite Launch Vehicles

  • The high cost of developing and launching satellites is expected to hamper the market’s progress.
  • The high cost is a significant barrier to entry for new players in the market and is likely to limit competition.
  • The market is highly regulated, with government agencies responsible for issuing licenses and permits for launches.
  • Regulations make the process of getting a new launch vehicle to market a lengthy and expensive process.
  • Need for reliability and safety.
  • Satellites are often used for critical functions such as communication, navigation, and national security, so launch vehicle failures can have serious consequences. As a result, launch vehicle manufacturers must invest heavily in safety and reliability testing, which can add to the cost of development.
  • The market for satellite launch vehicles is highly competitive, with several major players dominating the industry.
  • Competition can limit opportunities for smaller companies and startups to enter the market.
  • The market is subject to fluctuations in demand, with demand for launches affected by factors such as government funding, economic conditions, and geopolitical events.
  • Increasing pressure to reduce environmental impact also restricts the market.
  • Launch vehicles produce significant amounts of greenhouse gases and other pollutants, and there is a growing demand for more sustainable launch options.
  • The suitability pressure leading to increased investment in reusable launch vehicles and other sustainable technologies.

Satellite Launch Vehicle Industry Analysis by Top Investment Segments

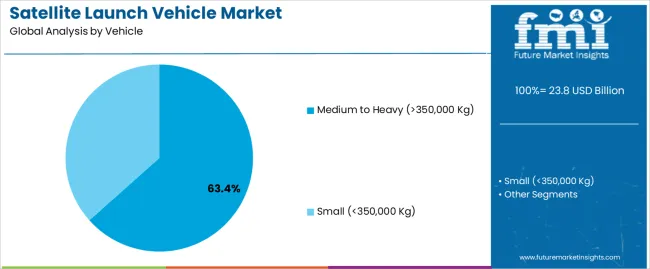
In terms of Vehicles, the Small (<350,000 kg) Segment Leads the Market Growth

Attributes Details
Top Vehicle Type Small (<350,000 kg)
CAGR from 2024 to 2034 13.7%
  • Rise in demand for small satellites has led to a corresponding increase in demand for launch vehicles that can accommodate these payloads.
  • Small satellites are becoming increasingly popular due to their lower cost and greater flexibility, and as a result, launch providers are shifting their focus toward catering to this market.
  • Development of reusable launch vehicles has made it much more cost-effective to launch smaller payloads which is driving the demand for the small (<350,000 kg) segment.
  • Increasing demand for telecommunications services and the need for better weather forecasting and disaster management are expected to create lucrative opportunities for small satellites.

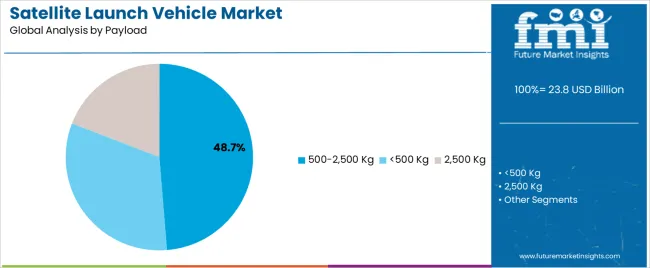
In terms of Payload, the <500 kg Segment is dominating the Market

Attributes Details
Top Payload <500 kg
CAGR from 2024 to 2034 13.5%
  • The trend in recent years towards smaller, more agile satellites has led to an increased demand for launch vehicles capable of delivering payloads of this size.
  • These smaller satellites are often used for applications such as earth observation, remote sensing, and communication.
  • The cost of launching a satellite has been decreasing in recent years, making it more affordable for companies and organizations to launch multiple smaller satellites rather than relying on a single large one, which drives the demand for the <500 kg segment.
  • The launch of smaller satellites created a greater demand for launch vehicles that can efficiently deliver these smaller payloads.
  • Rise of private space companies has also contributed to the dominance of the <500 kg segment.

Analysis of Top Countries Developing, Certifying, Launching, and Operating Satellite Launch Vehicles

Countries CAGR through 2034
United States 14.2%
United Kingdom 15.0%
China 14.7%
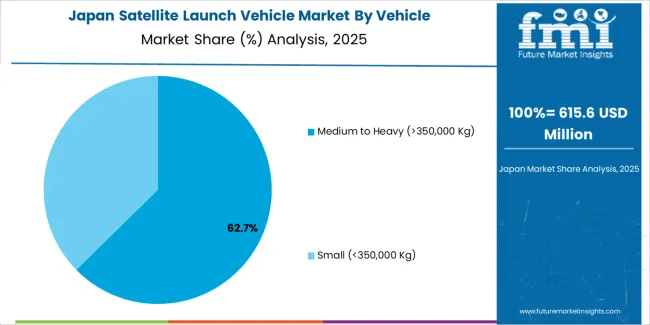
Japan 15.6%
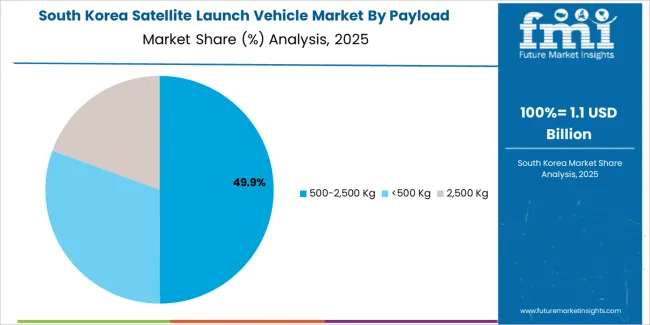
South Korea 16.0%

Increasing Demand for Communication and Remote Sensing Applications in the United States

  • Demand for satellite launch vehicles in the United States is primarily driven by the increasing demand for communication and remote sensing applications, as well as the development of national defense and intelligence programs.
  • The United States is home to some of the world's largest space organizations and companies, such as NASA and SpaceX, which have played a significant role in the growth of the satellite launch vehicle market.
  • Increasing demand for commercial satellite launches for applications such as internet services, navigation, and weather forecasting has contributed to the growth of the market.

Rising Demand for Satellite-Based Services in the United Kingdom

  • In the United Kingdom, the demand for satellite launch vehicle market is driven by the country's growing space industry and the increasing demand for satellite-based services.
  • The UK government has been investing heavily in the development of the country's space industry, which has led to the growth of several new companies that specialize in satellite launch services.
  • Increasing demand for satellite-based services such as telecommunication, remote sensing, and navigation has also contributed to the growth of the market.

Expanding Space Programs and the Government's Focus on Developing the Country's Space Capabilities in China

  • China has been experiencing rapid growth in the satellite launch vehicle market, primarily driven by the country's expanding space program and the government's focus on developing the country's space capabilities.
  • The Chinese government has been investing heavily in the development of its space industry, which has led to the growth of several new companies that specialize in satellite launch services.
  • Increasing demand for commercial satellite launches for applications such as telecommunication, navigation, and remote sensing has also contributed to the growth of the market.

Japan has a Strategic Geographical Location, Boosting Market Growth

  • Japan has a strategic geographical location, which makes it an ideal location for launching satellites.
  • Being located in the Asia-Pacific region, Japan provides easy access to geostationary orbit, which is a prime location for communication and weather satellites.
  • The location made Japan an attractive destination for satellite launches, further driving demand for launch vehicles.

Strong Focus on Developing Indigenous Satellite Technology in South Korea

  • South Korea has a well-established space industry, with a strong focus on developing indigenous satellite technology.
  • The strong focus created a sense of trust and reliability among customers, which led to increased demand for South Korean satellite launch vehicles.
  • Government support for the development of the space industry has been a major driver of growth in the satellite launch vehicle market in South Korea.
  • The government has been actively promoting the development of the space industry, which has resulted in increased investments in research and development of satellite technology.

Key Satellite Launch Vehicle Market Players and Concentration

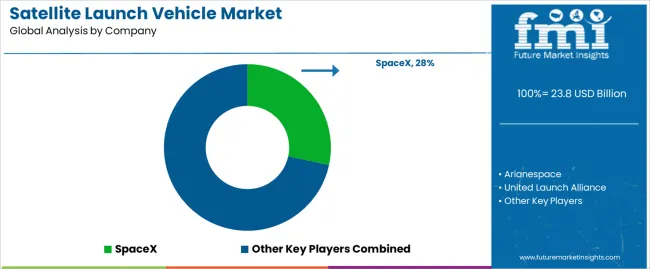
The market is highly competitive, with a diverse range of players from both the government and private sectors. The market is characterized by intense competition, technological advancements, and a focus on innovation.

A privately-owned segment of the market is characterized by a diverse range of players, including established aerospace companies, startups, and conglomerates from various industries.

These companies are involved in the development and launch of satellites for commercial and scientific applications, such as Earth observation, remote sensing, and communication. They also provide launch services to other companies and governments.

Recent Development in the Satellite Launch Vehicle Market

In 2023, Amazon recently announced that it has secured three launches with SpaceX, a private American aerospace manufacturer, to support the deployment of Project Kuiper. Project Kuiper is a plan to launch a constellation of low Earth orbit satellites that will provide high-speed, low-latency broadband internet to unserved and underserved communities around the world.

Leading Suppliers of Satellite Launch Vehicles

  • SpaceX
  • Arianespace
  • United Launch Alliance
  • Roscosmos
  • Blue Origin
  • China Aerospace Science and Technology Corporation
  • Mitsubishi Heavy Industries
  • Indian Space Research Organisation
  • Eurockot Launch Services
  • Virgin Orbit

Key Shifting Preferences Covered in Satellite Launch Vehicle Market Report

  • Global Reusable Launch Vehicle Market Report
  • Launch Vehicle Industry Assessment
  • Space Access Market Overview
  • Commercial Space Launch Service Providers Pricing Outlook
  • Analysis of Space Transportation

Top Segments Studied in the Satellite Launch Vehicle Market Report

By Vehicle:

  • Small (<350,000 Kg)
  • Medium to Heavy (> 350,000 Kg)

By Payload:

  • <500 Kg
  • 500-2,500 Kg
  • 2,500 Kg

By Orbit:

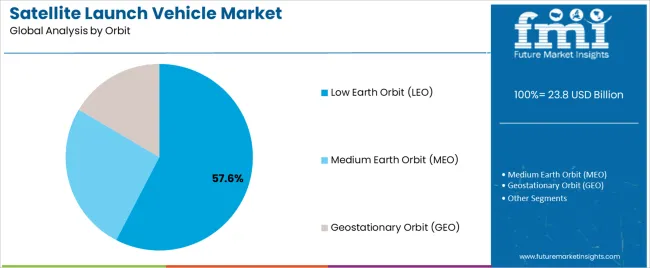
  • Low Earth Orbit (LEO)
  • Medium Earth Orbit (MEO)
  • Geostationary Orbit (GEO)

By Launch:

  • Single-Use/Expendable
  • Reusable

By Stage:

  • Single Stage
  • Two Stage
  • Three Stage

By SubSystem:

  • Structure
  • Guidance, Navigation & Control System
  • Propulsion System
  • Telemetry, Tracking & Command System
  • Electrical Power System
  • Separation System

By Region:

  • North America
  • Latin America
  • East Asia
  • South Asia
  • Europe
  • Oceania
  • MEA

Table of Content

  • 1. Executive Summary
  • 2. Market Overview
  • 3. Market Background
  • 4. Global Market Analysis 2019 to 2023 and Forecast, 2024 to 2034
  • 5. Global Market Analysis 2019 to 2023 and Forecast 2024 to 2034, By Vehicle
    • 5.1. Small (<350,000 Kg)
    • 5.2. Medium to Heavy (> 350,000 Kg)
  • 6. Global Market Analysis 2019 to 2023 and Forecast 2024 to 2034, By Payload
    • 6.1. <500 Kg
    • 6.2. 500-2,500 Kg
    • 6.3. > 2,500 Kg
  • 7. Global Market Analysis 2019 to 2023 and Forecast 2024 to 2034, By Orbit
    • 7.1. Low Earth Orbit (LEO)
    • 7.2. Medium Earth Orbit (MEO)
    • 7.3. Geostationary Orbit (GEO)
  • 8. Global Market Analysis 2019 to 2023 and Forecast 2024 to 2034, By Launch
    • 8.1. Single-Use/Expendable
    • 8.2. Reusable
  • 9. Global Market Analysis 2019 to 2023 and Forecast 2024 to 2034, By Stage
    • 9.1. Single Stage
    • 9.2. Two Stage
    • 9.3. Three Stage
  • 10. Global Market Analysis 2019 to 2023 and Forecast 2024 to 2034, By Subsystem
    • 10.1. Structure
    • 10.2. Guidance, Navigation & Control System
    • 10.3. Propulsion System
    • 10.4. Telemetry, Tracking & Command System
    • 10.5. Electrical Power System
    • 10.6. Separation System
  • 11. Global Market Analysis 2019 to 2023 and Forecast 2024 to 2034, By Region
    • 11.1. North America
    • 11.2. Latin America
    • 11.3. Western Europe
    • 11.4. Eastern Europe
    • 11.5. South Asia and Pacific
    • 11.6. East Asia
    • 11.7. Middle East and Africa
  • 12. North America Market Analysis 2019 to 2023 and Forecast 2024 to 2034, By Country
  • 13. Latin America Market Analysis 2019 to 2023 and Forecast 2024 to 2034, By Country
  • 14. Western Europe Market Analysis 2019 to 2023 and Forecast 2024 to 2034, By Country
  • 15. Eastern Europe Market Analysis 2019 to 2023 and Forecast 2024 to 2034, By Country
  • 16. South Asia and Pacific Market Analysis 2019 to 2023 and Forecast 2024 to 2034, By Country
  • 17. East Asia Market Analysis 2019 to 2023 and Forecast 2024 to 2034, By Country
  • 18. Middle East and Africa Market Analysis 2019 to 2023 and Forecast 2024 to 2034, By Country
  • 19. Key Countries Market Analysis
  • 20. Market Structure Analysis
  • 21. Competition Analysis
    • 21.1. Northrop Grumman Corporation
    • 21.2. Arca Space Corporation
    • 21.3. Lockheed Martin Corporation
    • 21.4. Boeing
    • 21.5. Mitsubishi Heavy Industries Ltd
    • 21.6 Blue Origin
    • 21.7. Indian Space Research Organization
    • 21.8. Space Exploration Technologies Corporation
    • 21.9. Eurockot Launch Services GmbH
    • 21.10. Bristol Airspace
  • 22. Assumptions & Acronyms Used
  • 23. Research Methodology

List of Tables

Table 1: Global Market Value (US$ Million) Forecast by Region, 2019 to 2034

Table 2: Global Market Volume (Units) Forecast by Region, 2019 to 2034

Table 3: Global Market Value (US$ Million) Forecast by Vehicle, 2019 to 2034

Table 4: Global Market Volume (Units) Forecast by Vehicle, 2019 to 2034

Table 5: Global Market Value (US$ Million) Forecast by Payload, 2019 to 2034

Table 6: Global Market Volume (Units) Forecast by Payload, 2019 to 2034

Table 7: Global Market Value (US$ Million) Forecast by Orbit, 2019 to 2034

Table 8: Global Market Volume (Units) Forecast by Orbit, 2019 to 2034

Table 9: Global Market Value (US$ Million) Forecast by Launch, 2019 to 2034

Table 10: Global Market Volume (Units) Forecast by Launch, 2019 to 2034

Table 11: Global Market Value (US$ Million) Forecast by Stage, 2019 to 2034

Table 12: Global Market Volume (Units) Forecast by Stage, 2019 to 2034

Table 13: Global Market Value (US$ Million) Forecast by Subsystem, 2019 to 2034

Table 14: Global Market Volume (Units) Forecast by Subsystem, 2019 to 2034

Table 15: North America Market Value (US$ Million) Forecast by Country, 2019 to 2034

Table 16: North America Market Volume (Units) Forecast by Country, 2019 to 2034

Table 17: North America Market Value (US$ Million) Forecast by Vehicle, 2019 to 2034

Table 18: North America Market Volume (Units) Forecast by Vehicle, 2019 to 2034

Table 19: North America Market Value (US$ Million) Forecast by Payload, 2019 to 2034

Table 20: North America Market Volume (Units) Forecast by Payload, 2019 to 2034

Table 21: North America Market Value (US$ Million) Forecast by Orbit, 2019 to 2034

Table 22: North America Market Volume (Units) Forecast by Orbit, 2019 to 2034

Table 23: North America Market Value (US$ Million) Forecast by Launch, 2019 to 2034

Table 24: North America Market Volume (Units) Forecast by Launch, 2019 to 2034

Table 25: North America Market Value (US$ Million) Forecast by Stage, 2019 to 2034

Table 26: North America Market Volume (Units) Forecast by Stage, 2019 to 2034

Table 27: North America Market Value (US$ Million) Forecast by Subsystem, 2019 to 2034

Table 28: North America Market Volume (Units) Forecast by Subsystem, 2019 to 2034

Table 29: Latin America Market Value (US$ Million) Forecast by Country, 2019 to 2034

Table 30: Latin America Market Volume (Units) Forecast by Country, 2019 to 2034

Table 31: Latin America Market Value (US$ Million) Forecast by Vehicle, 2019 to 2034

Table 32: Latin America Market Volume (Units) Forecast by Vehicle, 2019 to 2034

Table 33: Latin America Market Value (US$ Million) Forecast by Payload, 2019 to 2034

Table 34: Latin America Market Volume (Units) Forecast by Payload, 2019 to 2034

Table 35: Latin America Market Value (US$ Million) Forecast by Orbit, 2019 to 2034

Table 36: Latin America Market Volume (Units) Forecast by Orbit, 2019 to 2034

Table 37: Latin America Market Value (US$ Million) Forecast by Launch, 2019 to 2034

Table 38: Latin America Market Volume (Units) Forecast by Launch, 2019 to 2034

Table 39: Latin America Market Value (US$ Million) Forecast by Stage, 2019 to 2034

Table 40: Latin America Market Volume (Units) Forecast by Stage, 2019 to 2034

Table 41: Latin America Market Value (US$ Million) Forecast by Subsystem, 2019 to 2034

Table 42: Latin America Market Volume (Units) Forecast by Subsystem, 2019 to 2034

Table 43: Western Europe Market Value (US$ Million) Forecast by Country, 2019 to 2034

Table 44: Western Europe Market Volume (Units) Forecast by Country, 2019 to 2034

Table 45: Western Europe Market Value (US$ Million) Forecast by Vehicle, 2019 to 2034

Table 46: Western Europe Market Volume (Units) Forecast by Vehicle, 2019 to 2034

Table 47: Western Europe Market Value (US$ Million) Forecast by Payload, 2019 to 2034

Table 48: Western Europe Market Volume (Units) Forecast by Payload, 2019 to 2034

Table 49: Western Europe Market Value (US$ Million) Forecast by Orbit, 2019 to 2034

Table 50: Western Europe Market Volume (Units) Forecast by Orbit, 2019 to 2034

Table 51: Western Europe Market Value (US$ Million) Forecast by Launch, 2019 to 2034

Table 52: Western Europe Market Volume (Units) Forecast by Launch, 2019 to 2034

Table 53: Western Europe Market Value (US$ Million) Forecast by Stage, 2019 to 2034

Table 54: Western Europe Market Volume (Units) Forecast by Stage, 2019 to 2034

Table 55: Western Europe Market Value (US$ Million) Forecast by Subsystem, 2019 to 2034

Table 56: Western Europe Market Volume (Units) Forecast by Subsystem, 2019 to 2034

Table 57: Eastern Europe Market Value (US$ Million) Forecast by Country, 2019 to 2034

Table 58: Eastern Europe Market Volume (Units) Forecast by Country, 2019 to 2034

Table 59: Eastern Europe Market Value (US$ Million) Forecast by Vehicle, 2019 to 2034

Table 60: Eastern Europe Market Volume (Units) Forecast by Vehicle, 2019 to 2034

Table 61: Eastern Europe Market Value (US$ Million) Forecast by Payload, 2019 to 2034

Table 62: Eastern Europe Market Volume (Units) Forecast by Payload, 2019 to 2034

Table 63: Eastern Europe Market Value (US$ Million) Forecast by Orbit, 2019 to 2034

Table 64: Eastern Europe Market Volume (Units) Forecast by Orbit, 2019 to 2034

Table 65: Eastern Europe Market Value (US$ Million) Forecast by Launch, 2019 to 2034

Table 66: Eastern Europe Market Volume (Units) Forecast by Launch, 2019 to 2034

Table 67: Eastern Europe Market Value (US$ Million) Forecast by Stage, 2019 to 2034

Table 68: Eastern Europe Market Volume (Units) Forecast by Stage, 2019 to 2034

Table 69: Eastern Europe Market Value (US$ Million) Forecast by Subsystem, 2019 to 2034

Table 70: Eastern Europe Market Volume (Units) Forecast by Subsystem, 2019 to 2034

Table 71: South Asia and Pacific Market Value (US$ Million) Forecast by Country, 2019 to 2034

Table 72: South Asia and Pacific Market Volume (Units) Forecast by Country, 2019 to 2034

Table 73: South Asia and Pacific Market Value (US$ Million) Forecast by Vehicle, 2019 to 2034

Table 74: South Asia and Pacific Market Volume (Units) Forecast by Vehicle, 2019 to 2034

Table 75: South Asia and Pacific Market Value (US$ Million) Forecast by Payload, 2019 to 2034

Table 76: South Asia and Pacific Market Volume (Units) Forecast by Payload, 2019 to 2034

Table 77: South Asia and Pacific Market Value (US$ Million) Forecast by Orbit, 2019 to 2034

Table 78: South Asia and Pacific Market Volume (Units) Forecast by Orbit, 2019 to 2034

Table 79: South Asia and Pacific Market Value (US$ Million) Forecast by Launch, 2019 to 2034

Table 80: South Asia and Pacific Market Volume (Units) Forecast by Launch, 2019 to 2034

Table 81: South Asia and Pacific Market Value (US$ Million) Forecast by Stage, 2019 to 2034

Table 82: South Asia and Pacific Market Volume (Units) Forecast by Stage, 2019 to 2034

Table 83: South Asia and Pacific Market Value (US$ Million) Forecast by Subsystem, 2019 to 2034

Table 84: South Asia and Pacific Market Volume (Units) Forecast by Subsystem, 2019 to 2034

Table 85: East Asia Market Value (US$ Million) Forecast by Country, 2019 to 2034

Table 86: East Asia Market Volume (Units) Forecast by Country, 2019 to 2034

Table 87: East Asia Market Value (US$ Million) Forecast by Vehicle, 2019 to 2034

Table 88: East Asia Market Volume (Units) Forecast by Vehicle, 2019 to 2034

Table 89: East Asia Market Value (US$ Million) Forecast by Payload, 2019 to 2034

Table 90: East Asia Market Volume (Units) Forecast by Payload, 2019 to 2034

Table 91: East Asia Market Value (US$ Million) Forecast by Orbit, 2019 to 2034

Table 92: East Asia Market Volume (Units) Forecast by Orbit, 2019 to 2034

Table 93: East Asia Market Value (US$ Million) Forecast by Launch, 2019 to 2034

Table 94: East Asia Market Volume (Units) Forecast by Launch, 2019 to 2034

Table 95: East Asia Market Value (US$ Million) Forecast by Stage, 2019 to 2034

Table 96: East Asia Market Volume (Units) Forecast by Stage, 2019 to 2034

Table 97: East Asia Market Value (US$ Million) Forecast by Subsystem, 2019 to 2034

Table 98: East Asia Market Volume (Units) Forecast by Subsystem, 2019 to 2034

Table 99: Middle East and Africa Market Value (US$ Million) Forecast by Country, 2019 to 2034

Table 100: Middle East and Africa Market Volume (Units) Forecast by Country, 2019 to 2034

Table 101: Middle East and Africa Market Value (US$ Million) Forecast by Vehicle, 2019 to 2034

Table 102: Middle East and Africa Market Volume (Units) Forecast by Vehicle, 2019 to 2034

Table 103: Middle East and Africa Market Value (US$ Million) Forecast by Payload, 2019 to 2034

Table 104: Middle East and Africa Market Volume (Units) Forecast by Payload, 2019 to 2034

Table 105: Middle East and Africa Market Value (US$ Million) Forecast by Orbit, 2019 to 2034

Table 106: Middle East and Africa Market Volume (Units) Forecast by Orbit, 2019 to 2034

Table 107: Middle East and Africa Market Value (US$ Million) Forecast by Launch, 2019 to 2034

Table 108: Middle East and Africa Market Volume (Units) Forecast by Launch, 2019 to 2034

Table 109: Middle East and Africa Market Value (US$ Million) Forecast by Stage, 2019 to 2034

Table 110: Middle East and Africa Market Volume (Units) Forecast by Stage, 2019 to 2034

Table 111: Middle East and Africa Market Value (US$ Million) Forecast by Subsystem, 2019 to 2034

Table 112: Middle East and Africa Market Volume (Units) Forecast by Subsystem, 2019 to 2034

List of Figures

Figure 1: Global Market Value (US$ Million) by Vehicle, 2024 to 2034

Figure 2: Global Market Value (US$ Million) by Payload, 2024 to 2034

Figure 3: Global Market Value (US$ Million) by Orbit, 2024 to 2034

Figure 4: Global Market Value (US$ Million) by Launch, 2024 to 2034

Figure 5: Global Market Value (US$ Million) by Stage, 2024 to 2034

Figure 6: Global Market Value (US$ Million) by Subsystem, 2024 to 2034

Figure 7: Global Market Value (US$ Million) by Region, 2024 to 2034

Figure 8: Global Market Value (US$ Million) Analysis by Region, 2019 to 2034

Figure 9: Global Market Volume (Units) Analysis by Region, 2019 to 2034

Figure 10: Global Market Value Share (%) and BPS Analysis by Region, 2024 to 2034

Figure 11: Global Market Y-o-Y Growth (%) Projections by Region, 2024 to 2034

Figure 12: Global Market Value (US$ Million) Analysis by Vehicle, 2019 to 2034

Figure 13: Global Market Volume (Units) Analysis by Vehicle, 2019 to 2034

Figure 14: Global Market Value Share (%) and BPS Analysis by Vehicle, 2024 to 2034

Figure 15: Global Market Y-o-Y Growth (%) Projections by Vehicle, 2024 to 2034

Figure 16: Global Market Value (US$ Million) Analysis by Payload, 2019 to 2034

Figure 17: Global Market Volume (Units) Analysis by Payload, 2019 to 2034

Figure 18: Global Market Value Share (%) and BPS Analysis by Payload, 2024 to 2034

Figure 19: Global Market Y-o-Y Growth (%) Projections by Payload, 2024 to 2034

Figure 20: Global Market Value (US$ Million) Analysis by Orbit, 2019 to 2034

Figure 21: Global Market Volume (Units) Analysis by Orbit, 2019 to 2034

Figure 22: Global Market Value Share (%) and BPS Analysis by Orbit, 2024 to 2034

Figure 23: Global Market Y-o-Y Growth (%) Projections by Orbit, 2024 to 2034

Figure 24: Global Market Value (US$ Million) Analysis by Launch, 2019 to 2034

Figure 25: Global Market Volume (Units) Analysis by Launch, 2019 to 2034

Figure 26: Global Market Value Share (%) and BPS Analysis by Launch, 2024 to 2034

Figure 27: Global Market Y-o-Y Growth (%) Projections by Launch, 2024 to 2034

Figure 28: Global Market Value (US$ Million) Analysis by Stage, 2019 to 2034

Figure 29: Global Market Volume (Units) Analysis by Stage, 2019 to 2034

Figure 30: Global Market Value Share (%) and BPS Analysis by Stage, 2024 to 2034

Figure 31: Global Market Y-o-Y Growth (%) Projections by Stage, 2024 to 2034

Figure 32: Global Market Value (US$ Million) Analysis by Subsystem, 2019 to 2034

Figure 33: Global Market Volume (Units) Analysis by Subsystem, 2019 to 2034

Figure 34: Global Market Value Share (%) and BPS Analysis by Subsystem, 2024 to 2034

Figure 35: Global Market Y-o-Y Growth (%) Projections by Subsystem, 2024 to 2034

Figure 36: Global Market Attractiveness by Vehicle, 2024 to 2034

Figure 37: Global Market Attractiveness by Payload, 2024 to 2034

Figure 38: Global Market Attractiveness by Orbit, 2024 to 2034

Figure 39: Global Market Attractiveness by Launch, 2024 to 2034

Figure 40: Global Market Attractiveness by Stage, 2024 to 2034

Figure 41: Global Market Attractiveness by Subsystem, 2024 to 2034

Figure 42: Global Market Attractiveness by Region, 2024 to 2034

Figure 43: North America Market Value (US$ Million) by Vehicle, 2024 to 2034

Figure 44: North America Market Value (US$ Million) by Payload, 2024 to 2034

Figure 45: North America Market Value (US$ Million) by Orbit, 2024 to 2034

Figure 46: North America Market Value (US$ Million) by Launch, 2024 to 2034

Figure 47: North America Market Value (US$ Million) by Stage, 2024 to 2034

Figure 48: North America Market Value (US$ Million) by Subsystem, 2024 to 2034

Figure 49: North America Market Value (US$ Million) by Country, 2024 to 2034

Figure 50: North America Market Value (US$ Million) Analysis by Country, 2019 to 2034

Figure 51: North America Market Volume (Units) Analysis by Country, 2019 to 2034

Figure 52: North America Market Value Share (%) and BPS Analysis by Country, 2024 to 2034

Figure 53: North America Market Y-o-Y Growth (%) Projections by Country, 2024 to 2034

Figure 54: North America Market Value (US$ Million) Analysis by Vehicle, 2019 to 2034

Figure 55: North America Market Volume (Units) Analysis by Vehicle, 2019 to 2034

Figure 56: North America Market Value Share (%) and BPS Analysis by Vehicle, 2024 to 2034

Figure 57: North America Market Y-o-Y Growth (%) Projections by Vehicle, 2024 to 2034

Figure 58: North America Market Value (US$ Million) Analysis by Payload, 2019 to 2034

Figure 59: North America Market Volume (Units) Analysis by Payload, 2019 to 2034

Figure 60: North America Market Value Share (%) and BPS Analysis by Payload, 2024 to 2034

Figure 61: North America Market Y-o-Y Growth (%) Projections by Payload, 2024 to 2034

Figure 62: North America Market Value (US$ Million) Analysis by Orbit, 2019 to 2034

Figure 63: North America Market Volume (Units) Analysis by Orbit, 2019 to 2034

Figure 64: North America Market Value Share (%) and BPS Analysis by Orbit, 2024 to 2034

Figure 65: North America Market Y-o-Y Growth (%) Projections by Orbit, 2024 to 2034

Figure 66: North America Market Value (US$ Million) Analysis by Launch, 2019 to 2034

Figure 67: North America Market Volume (Units) Analysis by Launch, 2019 to 2034

Figure 68: North America Market Value Share (%) and BPS Analysis by Launch, 2024 to 2034

Figure 69: North America Market Y-o-Y Growth (%) Projections by Launch, 2024 to 2034

Figure 70: North America Market Value (US$ Million) Analysis by Stage, 2019 to 2034

Figure 71: North America Market Volume (Units) Analysis by Stage, 2019 to 2034

Figure 72: North America Market Value Share (%) and BPS Analysis by Stage, 2024 to 2034

Figure 73: North America Market Y-o-Y Growth (%) Projections by Stage, 2024 to 2034

Figure 74: North America Market Value (US$ Million) Analysis by Subsystem, 2019 to 2034

Figure 75: North America Market Volume (Units) Analysis by Subsystem, 2019 to 2034

Figure 76: North America Market Value Share (%) and BPS Analysis by Subsystem, 2024 to 2034

Figure 77: North America Market Y-o-Y Growth (%) Projections by Subsystem, 2024 to 2034

Figure 78: North America Market Attractiveness by Vehicle, 2024 to 2034

Figure 79: North America Market Attractiveness by Payload, 2024 to 2034

Figure 80: North America Market Attractiveness by Orbit, 2024 to 2034

Figure 81: North America Market Attractiveness by Launch, 2024 to 2034

Figure 82: North America Market Attractiveness by Stage, 2024 to 2034

Figure 83: North America Market Attractiveness by Subsystem, 2024 to 2034

Figure 84: North America Market Attractiveness by Country, 2024 to 2034

Figure 85: Latin America Market Value (US$ Million) by Vehicle, 2024 to 2034

Figure 86: Latin America Market Value (US$ Million) by Payload, 2024 to 2034

Figure 87: Latin America Market Value (US$ Million) by Orbit, 2024 to 2034

Figure 88: Latin America Market Value (US$ Million) by Launch, 2024 to 2034

Figure 89: Latin America Market Value (US$ Million) by Stage, 2024 to 2034

Figure 90: Latin America Market Value (US$ Million) by Subsystem, 2024 to 2034

Figure 91: Latin America Market Value (US$ Million) by Country, 2024 to 2034

Figure 92: Latin America Market Value (US$ Million) Analysis by Country, 2019 to 2034

Figure 93: Latin America Market Volume (Units) Analysis by Country, 2019 to 2034

Figure 94: Latin America Market Value Share (%) and BPS Analysis by Country, 2024 to 2034

Figure 95: Latin America Market Y-o-Y Growth (%) Projections by Country, 2024 to 2034

Figure 96: Latin America Market Value (US$ Million) Analysis by Vehicle, 2019 to 2034

Figure 97: Latin America Market Volume (Units) Analysis by Vehicle, 2019 to 2034

Figure 98: Latin America Market Value Share (%) and BPS Analysis by Vehicle, 2024 to 2034

Figure 99: Latin America Market Y-o-Y Growth (%) Projections by Vehicle, 2024 to 2034

Figure 100: Latin America Market Value (US$ Million) Analysis by Payload, 2019 to 2034

Figure 101: Latin America Market Volume (Units) Analysis by Payload, 2019 to 2034

Figure 102: Latin America Market Value Share (%) and BPS Analysis by Payload, 2024 to 2034

Figure 103: Latin America Market Y-o-Y Growth (%) Projections by Payload, 2024 to 2034

Figure 104: Latin America Market Value (US$ Million) Analysis by Orbit, 2019 to 2034

Figure 105: Latin America Market Volume (Units) Analysis by Orbit, 2019 to 2034

Figure 106: Latin America Market Value Share (%) and BPS Analysis by Orbit, 2024 to 2034

Figure 107: Latin America Market Y-o-Y Growth (%) Projections by Orbit, 2024 to 2034

Figure 108: Latin America Market Value (US$ Million) Analysis by Launch, 2019 to 2034

Figure 109: Latin America Market Volume (Units) Analysis by Launch, 2019 to 2034

Figure 110: Latin America Market Value Share (%) and BPS Analysis by Launch, 2024 to 2034

Figure 111: Latin America Market Y-o-Y Growth (%) Projections by Launch, 2024 to 2034

Figure 112: Latin America Market Value (US$ Million) Analysis by Stage, 2019 to 2034

Figure 113: Latin America Market Volume (Units) Analysis by Stage, 2019 to 2034

Figure 114: Latin America Market Value Share (%) and BPS Analysis by Stage, 2024 to 2034

Figure 115: Latin America Market Y-o-Y Growth (%) Projections by Stage, 2024 to 2034

Figure 116: Latin America Market Value (US$ Million) Analysis by Subsystem, 2019 to 2034

Figure 117: Latin America Market Volume (Units) Analysis by Subsystem, 2019 to 2034

Figure 118: Latin America Market Value Share (%) and BPS Analysis by Subsystem, 2024 to 2034

Figure 119: Latin America Market Y-o-Y Growth (%) Projections by Subsystem, 2024 to 2034

Figure 120: Latin America Market Attractiveness by Vehicle, 2024 to 2034

Figure 121: Latin America Market Attractiveness by Payload, 2024 to 2034

Figure 122: Latin America Market Attractiveness by Orbit, 2024 to 2034

Figure 123: Latin America Market Attractiveness by Launch, 2024 to 2034

Figure 124: Latin America Market Attractiveness by Stage, 2024 to 2034

Figure 125: Latin America Market Attractiveness by Subsystem, 2024 to 2034

Figure 126: Latin America Market Attractiveness by Country, 2024 to 2034

Figure 127: Western Europe Market Value (US$ Million) by Vehicle, 2024 to 2034

Figure 128: Western Europe Market Value (US$ Million) by Payload, 2024 to 2034

Figure 129: Western Europe Market Value (US$ Million) by Orbit, 2024 to 2034

Figure 130: Western Europe Market Value (US$ Million) by Launch, 2024 to 2034

Figure 131: Western Europe Market Value (US$ Million) by Stage, 2024 to 2034

Figure 132: Western Europe Market Value (US$ Million) by Subsystem, 2024 to 2034

Figure 133: Western Europe Market Value (US$ Million) by Country, 2024 to 2034

Figure 134: Western Europe Market Value (US$ Million) Analysis by Country, 2019 to 2034

Figure 135: Western Europe Market Volume (Units) Analysis by Country, 2019 to 2034

Figure 136: Western Europe Market Value Share (%) and BPS Analysis by Country, 2024 to 2034

Figure 137: Western Europe Market Y-o-Y Growth (%) Projections by Country, 2024 to 2034

Figure 138: Western Europe Market Value (US$ Million) Analysis by Vehicle, 2019 to 2034

Figure 139: Western Europe Market Volume (Units) Analysis by Vehicle, 2019 to 2034

Figure 140: Western Europe Market Value Share (%) and BPS Analysis by Vehicle, 2024 to 2034

Figure 141: Western Europe Market Y-o-Y Growth (%) Projections by Vehicle, 2024 to 2034

Figure 142: Western Europe Market Value (US$ Million) Analysis by Payload, 2019 to 2034

Figure 143: Western Europe Market Volume (Units) Analysis by Payload, 2019 to 2034

Figure 144: Western Europe Market Value Share (%) and BPS Analysis by Payload, 2024 to 2034

Figure 145: Western Europe Market Y-o-Y Growth (%) Projections by Payload, 2024 to 2034

Figure 146: Western Europe Market Value (US$ Million) Analysis by Orbit, 2019 to 2034

Figure 147: Western Europe Market Volume (Units) Analysis by Orbit, 2019 to 2034

Figure 148: Western Europe Market Value Share (%) and BPS Analysis by Orbit, 2024 to 2034

Figure 149: Western Europe Market Y-o-Y Growth (%) Projections by Orbit, 2024 to 2034

Figure 150: Western Europe Market Value (US$ Million) Analysis by Launch, 2019 to 2034

Figure 151: Western Europe Market Volume (Units) Analysis by Launch, 2019 to 2034

Figure 152: Western Europe Market Value Share (%) and BPS Analysis by Launch, 2024 to 2034

Figure 153: Western Europe Market Y-o-Y Growth (%) Projections by Launch, 2024 to 2034

Figure 154: Western Europe Market Value (US$ Million) Analysis by Stage, 2019 to 2034

Figure 155: Western Europe Market Volume (Units) Analysis by Stage, 2019 to 2034

Figure 156: Western Europe Market Value Share (%) and BPS Analysis by Stage, 2024 to 2034

Figure 157: Western Europe Market Y-o-Y Growth (%) Projections by Stage, 2024 to 2034

Figure 158: Western Europe Market Value (US$ Million) Analysis by Subsystem, 2019 to 2034

Figure 159: Western Europe Market Volume (Units) Analysis by Subsystem, 2019 to 2034

Figure 160: Western Europe Market Value Share (%) and BPS Analysis by Subsystem, 2024 to 2034

Figure 161: Western Europe Market Y-o-Y Growth (%) Projections by Subsystem, 2024 to 2034

Figure 162: Western Europe Market Attractiveness by Vehicle, 2024 to 2034

Figure 163: Western Europe Market Attractiveness by Payload, 2024 to 2034

Figure 164: Western Europe Market Attractiveness by Orbit, 2024 to 2034

Figure 165: Western Europe Market Attractiveness by Launch, 2024 to 2034

Figure 166: Western Europe Market Attractiveness by Stage, 2024 to 2034

Figure 167: Western Europe Market Attractiveness by Subsystem, 2024 to 2034

Figure 168: Western Europe Market Attractiveness by Country, 2024 to 2034

Figure 169: Eastern Europe Market Value (US$ Million) by Vehicle, 2024 to 2034

Figure 170: Eastern Europe Market Value (US$ Million) by Payload, 2024 to 2034

Figure 171: Eastern Europe Market Value (US$ Million) by Orbit, 2024 to 2034

Figure 172: Eastern Europe Market Value (US$ Million) by Launch, 2024 to 2034

Figure 173: Eastern Europe Market Value (US$ Million) by Stage, 2024 to 2034

Figure 174: Eastern Europe Market Value (US$ Million) by Subsystem, 2024 to 2034

Figure 175: Eastern Europe Market Value (US$ Million) by Country, 2024 to 2034

Figure 176: Eastern Europe Market Value (US$ Million) Analysis by Country, 2019 to 2034

Figure 177: Eastern Europe Market Volume (Units) Analysis by Country, 2019 to 2034

Figure 178: Eastern Europe Market Value Share (%) and BPS Analysis by Country, 2024 to 2034

Figure 179: Eastern Europe Market Y-o-Y Growth (%) Projections by Country, 2024 to 2034

Figure 180: Eastern Europe Market Value (US$ Million) Analysis by Vehicle, 2019 to 2034

Figure 181: Eastern Europe Market Volume (Units) Analysis by Vehicle, 2019 to 2034

Figure 182: Eastern Europe Market Value Share (%) and BPS Analysis by Vehicle, 2024 to 2034

Figure 183: Eastern Europe Market Y-o-Y Growth (%) Projections by Vehicle, 2024 to 2034

Figure 184: Eastern Europe Market Value (US$ Million) Analysis by Payload, 2019 to 2034

Figure 185: Eastern Europe Market Volume (Units) Analysis by Payload, 2019 to 2034

Figure 186: Eastern Europe Market Value Share (%) and BPS Analysis by Payload, 2024 to 2034

Figure 187: Eastern Europe Market Y-o-Y Growth (%) Projections by Payload, 2024 to 2034

Figure 188: Eastern Europe Market Value (US$ Million) Analysis by Orbit, 2019 to 2034

Figure 189: Eastern Europe Market Volume (Units) Analysis by Orbit, 2019 to 2034

Figure 190: Eastern Europe Market Value Share (%) and BPS Analysis by Orbit, 2024 to 2034

Figure 191: Eastern Europe Market Y-o-Y Growth (%) Projections by Orbit, 2024 to 2034

Figure 192: Eastern Europe Market Value (US$ Million) Analysis by Launch, 2019 to 2034

Figure 193: Eastern Europe Market Volume (Units) Analysis by Launch, 2019 to 2034

Figure 194: Eastern Europe Market Value Share (%) and BPS Analysis by Launch, 2024 to 2034

Figure 195: Eastern Europe Market Y-o-Y Growth (%) Projections by Launch, 2024 to 2034

Figure 196: Eastern Europe Market Value (US$ Million) Analysis by Stage, 2019 to 2034

Figure 197: Eastern Europe Market Volume (Units) Analysis by Stage, 2019 to 2034

Figure 198: Eastern Europe Market Value Share (%) and BPS Analysis by Stage, 2024 to 2034

Figure 199: Eastern Europe Market Y-o-Y Growth (%) Projections by Stage, 2024 to 2034

Figure 200: Eastern Europe Market Value (US$ Million) Analysis by Subsystem, 2019 to 2034

Figure 201: Eastern Europe Market Volume (Units) Analysis by Subsystem, 2019 to 2034

Figure 202: Eastern Europe Market Value Share (%) and BPS Analysis by Subsystem, 2024 to 2034

Figure 203: Eastern Europe Market Y-o-Y Growth (%) Projections by Subsystem, 2024 to 2034

Figure 204: Eastern Europe Market Attractiveness by Vehicle, 2024 to 2034

Figure 205: Eastern Europe Market Attractiveness by Payload, 2024 to 2034

Figure 206: Eastern Europe Market Attractiveness by Orbit, 2024 to 2034

Figure 207: Eastern Europe Market Attractiveness by Launch, 2024 to 2034

Figure 208: Eastern Europe Market Attractiveness by Stage, 2024 to 2034

Figure 209: Eastern Europe Market Attractiveness by Subsystem, 2024 to 2034

Figure 210: Eastern Europe Market Attractiveness by Country, 2024 to 2034

Figure 211: South Asia and Pacific Market Value (US$ Million) by Vehicle, 2024 to 2034

Figure 212: South Asia and Pacific Market Value (US$ Million) by Payload, 2024 to 2034

Figure 213: South Asia and Pacific Market Value (US$ Million) by Orbit, 2024 to 2034

Figure 214: South Asia and Pacific Market Value (US$ Million) by Launch, 2024 to 2034

Figure 215: South Asia and Pacific Market Value (US$ Million) by Stage, 2024 to 2034

Figure 216: South Asia and Pacific Market Value (US$ Million) by Subsystem, 2024 to 2034

Figure 217: South Asia and Pacific Market Value (US$ Million) by Country, 2024 to 2034

Figure 218: South Asia and Pacific Market Value (US$ Million) Analysis by Country, 2019 to 2034

Figure 219: South Asia and Pacific Market Volume (Units) Analysis by Country, 2019 to 2034

Figure 220: South Asia and Pacific Market Value Share (%) and BPS Analysis by Country, 2024 to 2034

Figure 221: South Asia and Pacific Market Y-o-Y Growth (%) Projections by Country, 2024 to 2034

Figure 222: South Asia and Pacific Market Value (US$ Million) Analysis by Vehicle, 2019 to 2034

Figure 223: South Asia and Pacific Market Volume (Units) Analysis by Vehicle, 2019 to 2034

Figure 224: South Asia and Pacific Market Value Share (%) and BPS Analysis by Vehicle, 2024 to 2034

Figure 225: South Asia and Pacific Market Y-o-Y Growth (%) Projections by Vehicle, 2024 to 2034

Figure 226: South Asia and Pacific Market Value (US$ Million) Analysis by Payload, 2019 to 2034

Figure 227: South Asia and Pacific Market Volume (Units) Analysis by Payload, 2019 to 2034

Figure 228: South Asia and Pacific Market Value Share (%) and BPS Analysis by Payload, 2024 to 2034

Figure 229: South Asia and Pacific Market Y-o-Y Growth (%) Projections by Payload, 2024 to 2034

Figure 230: South Asia and Pacific Market Value (US$ Million) Analysis by Orbit, 2019 to 2034

Figure 231: South Asia and Pacific Market Volume (Units) Analysis by Orbit, 2019 to 2034

Figure 232: South Asia and Pacific Market Value Share (%) and BPS Analysis by Orbit, 2024 to 2034

Figure 233: South Asia and Pacific Market Y-o-Y Growth (%) Projections by Orbit, 2024 to 2034

Figure 234: South Asia and Pacific Market Value (US$ Million) Analysis by Launch, 2019 to 2034

Figure 235: South Asia and Pacific Market Volume (Units) Analysis by Launch, 2019 to 2034

Figure 236: South Asia and Pacific Market Value Share (%) and BPS Analysis by Launch, 2024 to 2034

Figure 237: South Asia and Pacific Market Y-o-Y Growth (%) Projections by Launch, 2024 to 2034

Figure 238: South Asia and Pacific Market Value (US$ Million) Analysis by Stage, 2019 to 2034

Figure 239: South Asia and Pacific Market Volume (Units) Analysis by Stage, 2019 to 2034

Figure 240: South Asia and Pacific Market Value Share (%) and BPS Analysis by Stage, 2024 to 2034

Figure 241: South Asia and Pacific Market Y-o-Y Growth (%) Projections by Stage, 2024 to 2034

Figure 242: South Asia and Pacific Market Value (US$ Million) Analysis by Subsystem, 2019 to 2034

Figure 243: South Asia and Pacific Market Volume (Units) Analysis by Subsystem, 2019 to 2034

Figure 244: South Asia and Pacific Market Value Share (%) and BPS Analysis by Subsystem, 2024 to 2034

Figure 245: South Asia and Pacific Market Y-o-Y Growth (%) Projections by Subsystem, 2024 to 2034

Figure 246: South Asia and Pacific Market Attractiveness by Vehicle, 2024 to 2034

Figure 247: South Asia and Pacific Market Attractiveness by Payload, 2024 to 2034

Figure 248: South Asia and Pacific Market Attractiveness by Orbit, 2024 to 2034

Figure 249: South Asia and Pacific Market Attractiveness by Launch, 2024 to 2034

Figure 250: South Asia and Pacific Market Attractiveness by Stage, 2024 to 2034

Figure 251: South Asia and Pacific Market Attractiveness by Subsystem, 2024 to 2034

Figure 252: South Asia and Pacific Market Attractiveness by Country, 2024 to 2034

Figure 253: East Asia Market Value (US$ Million) by Vehicle, 2024 to 2034

Figure 254: East Asia Market Value (US$ Million) by Payload, 2024 to 2034

Figure 255: East Asia Market Value (US$ Million) by Orbit, 2024 to 2034

Figure 256: East Asia Market Value (US$ Million) by Launch, 2024 to 2034

Figure 257: East Asia Market Value (US$ Million) by Stage, 2024 to 2034

Figure 258: East Asia Market Value (US$ Million) by Subsystem, 2024 to 2034

Figure 259: East Asia Market Value (US$ Million) by Country, 2024 to 2034

Figure 260: East Asia Market Value (US$ Million) Analysis by Country, 2019 to 2034

Figure 261: East Asia Market Volume (Units) Analysis by Country, 2019 to 2034

Figure 262: East Asia Market Value Share (%) and BPS Analysis by Country, 2024 to 2034

Figure 263: East Asia Market Y-o-Y Growth (%) Projections by Country, 2024 to 2034

Figure 264: East Asia Market Value (US$ Million) Analysis by Vehicle, 2019 to 2034

Figure 265: East Asia Market Volume (Units) Analysis by Vehicle, 2019 to 2034

Figure 266: East Asia Market Value Share (%) and BPS Analysis by Vehicle, 2024 to 2034

Figure 267: East Asia Market Y-o-Y Growth (%) Projections by Vehicle, 2024 to 2034

Figure 268: East Asia Market Value (US$ Million) Analysis by Payload, 2019 to 2034

Figure 269: East Asia Market Volume (Units) Analysis by Payload, 2019 to 2034

Figure 270: East Asia Market Value Share (%) and BPS Analysis by Payload, 2024 to 2034

Figure 271: East Asia Market Y-o-Y Growth (%) Projections by Payload, 2024 to 2034

Figure 272: East Asia Market Value (US$ Million) Analysis by Orbit, 2019 to 2034

Figure 273: East Asia Market Volume (Units) Analysis by Orbit, 2019 to 2034

Figure 274: East Asia Market Value Share (%) and BPS Analysis by Orbit, 2024 to 2034

Figure 275: East Asia Market Y-o-Y Growth (%) Projections by Orbit, 2024 to 2034

Figure 276: East Asia Market Value (US$ Million) Analysis by Launch, 2019 to 2034

Figure 277: East Asia Market Volume (Units) Analysis by Launch, 2019 to 2034

Figure 278: East Asia Market Value Share (%) and BPS Analysis by Launch, 2024 to 2034

Figure 279: East Asia Market Y-o-Y Growth (%) Projections by Launch, 2024 to 2034

Figure 280: East Asia Market Value (US$ Million) Analysis by Stage, 2019 to 2034

Figure 281: East Asia Market Volume (Units) Analysis by Stage, 2019 to 2034

Figure 282: East Asia Market Value Share (%) and BPS Analysis by Stage, 2024 to 2034

Figure 283: East Asia Market Y-o-Y Growth (%) Projections by Stage, 2024 to 2034

Figure 284: East Asia Market Value (US$ Million) Analysis by Subsystem, 2019 to 2034

Figure 285: East Asia Market Volume (Units) Analysis by Subsystem, 2019 to 2034

Figure 286: East Asia Market Value Share (%) and BPS Analysis by Subsystem, 2024 to 2034

Figure 287: East Asia Market Y-o-Y Growth (%) Projections by Subsystem, 2024 to 2034

Figure 288: East Asia Market Attractiveness by Vehicle, 2024 to 2034

Figure 289: East Asia Market Attractiveness by Payload, 2024 to 2034

Figure 290: East Asia Market Attractiveness by Orbit, 2024 to 2034

Figure 291: East Asia Market Attractiveness by Launch, 2024 to 2034

Figure 292: East Asia Market Attractiveness by Stage, 2024 to 2034

Figure 293: East Asia Market Attractiveness by Subsystem, 2024 to 2034

Figure 294: East Asia Market Attractiveness by Country, 2024 to 2034

Figure 295: Middle East and Africa Market Value (US$ Million) by Vehicle, 2024 to 2034

Figure 296: Middle East and Africa Market Value (US$ Million) by Payload, 2024 to 2034

Figure 297: Middle East and Africa Market Value (US$ Million) by Orbit, 2024 to 2034

Figure 298: Middle East and Africa Market Value (US$ Million) by Launch, 2024 to 2034

Figure 299: Middle East and Africa Market Value (US$ Million) by Stage, 2024 to 2034

Figure 300: Middle East and Africa Market Value (US$ Million) by Subsystem, 2024 to 2034

Figure 301: Middle East and Africa Market Value (US$ Million) by Country, 2024 to 2034

Figure 302: Middle East and Africa Market Value (US$ Million) Analysis by Country, 2019 to 2034

Figure 303: Middle East and Africa Market Volume (Units) Analysis by Country, 2019 to 2034

Figure 304: Middle East and Africa Market Value Share (%) and BPS Analysis by Country, 2024 to 2034

Figure 305: Middle East and Africa Market Y-o-Y Growth (%) Projections by Country, 2024 to 2034

Figure 306: Middle East and Africa Market Value (US$ Million) Analysis by Vehicle, 2019 to 2034

Figure 307: Middle East and Africa Market Volume (Units) Analysis by Vehicle, 2019 to 2034

Figure 308: Middle East and Africa Market Value Share (%) and BPS Analysis by Vehicle, 2024 to 2034

Figure 309: Middle East and Africa Market Y-o-Y Growth (%) Projections by Vehicle, 2024 to 2034

Figure 310: Middle East and Africa Market Value (US$ Million) Analysis by Payload, 2019 to 2034

Figure 311: Middle East and Africa Market Volume (Units) Analysis by Payload, 2019 to 2034

Figure 312: Middle East and Africa Market Value Share (%) and BPS Analysis by Payload, 2024 to 2034

Figure 313: Middle East and Africa Market Y-o-Y Growth (%) Projections by Payload, 2024 to 2034

Figure 314: Middle East and Africa Market Value (US$ Million) Analysis by Orbit, 2019 to 2034

Figure 315: Middle East and Africa Market Volume (Units) Analysis by Orbit, 2019 to 2034

Figure 316: Middle East and Africa Market Value Share (%) and BPS Analysis by Orbit, 2024 to 2034

Figure 317: Middle East and Africa Market Y-o-Y Growth (%) Projections by Orbit, 2024 to 2034

Figure 318: Middle East and Africa Market Value (US$ Million) Analysis by Launch, 2019 to 2034

Figure 319: Middle East and Africa Market Volume (Units) Analysis by Launch, 2019 to 2034

Figure 320: Middle East and Africa Market Value Share (%) and BPS Analysis by Launch, 2024 to 2034

Figure 321: Middle East and Africa Market Y-o-Y Growth (%) Projections by Launch, 2024 to 2034

Figure 322: Middle East and Africa Market Value (US$ Million) Analysis by Stage, 2019 to 2034

Figure 323: Middle East and Africa Market Volume (Units) Analysis by Stage, 2019 to 2034

Figure 324: Middle East and Africa Market Value Share (%) and BPS Analysis by Stage, 2024 to 2034

Figure 325: Middle East and Africa Market Y-o-Y Growth (%) Projections by Stage, 2024 to 2034

Figure 326: Middle East and Africa Market Value (US$ Million) Analysis by Subsystem, 2019 to 2034

Figure 327: Middle East and Africa Market Volume (Units) Analysis by Subsystem, 2019 to 2034

Figure 328: Middle East and Africa Market Value Share (%) and BPS Analysis by Subsystem, 2024 to 2034

Figure 329: Middle East and Africa Market Y-o-Y Growth (%) Projections by Subsystem, 2024 to 2034

Figure 330: Middle East and Africa Market Attractiveness by Vehicle, 2024 to 2034

Figure 331: Middle East and Africa Market Attractiveness by Payload, 2024 to 2034

Figure 332: Middle East and Africa Market Attractiveness by Orbit, 2024 to 2034

Figure 333: Middle East and Africa Market Attractiveness by Launch, 2024 to 2034

Figure 334: Middle East and Africa Market Attractiveness by Stage, 2024 to 2034

Figure 335: Middle East and Africa Market Attractiveness by Subsystem, 2024 to 2034

Figure 336: Middle East and Africa Market Attractiveness by Country, 2024 to 2034

Frequently Asked Questions

How Big is the Satellite Launch Vehicle Market in 2024?

The satellite launch vehicle market is expected to be valued at USD 20.9 billion in 2024.

What is China’s Market Outlook?

The market in China is expected to progress at a CAGR of 14.7% through the forecast period.

Which Vehicle Segment Contributes More to the Satellite Launch Vehicle Market?

Within the vehicle, the small (<350,000 kg) segment is expected to register a 13.7% market CAGR from 2024 to 2034.

What is the United States Market Outlook?

The United States market is expected to register a 14.2% CAGR from 2024 to 2034.

What is the Projected Market Value by 2034?

The market is set to reach a valuation of USD 76.8 billion by 2034.

What was the Historical CAGR for the Market?

The demand for satellite launch vehicles increased at a 17.4% CAGR from 2019 to 2023.

Explore Telecommunication Insights

Future Market Insights

Satellite Launch Vehicle Market