Reports

- Global Locations -

Headquarters

Future Market Insights, Inc.

Christiana Corporate, 200
Continental Drive, Suite 401,
Newark, Delaware - 19713,
United States

T: +1-845-579-5705

Americas

Future Market Insights, Inc.

616 Corporate Way, Suite 2-9018,
Valley Cottage, NY 10989, United States

T: +1-347-918-3531

MEA

Future Market Insights

1602-6 Jumeirah Bay X2 Tower, Plot No: JLT-PH2-X2A,
Jumeirah Lakes Towers, Dubai,
United Arab Emirates

Europe

Future Market Insights

3rd Floor, 207 Regent Street,
W1B 3HH London
United Kingdom

T: + 44 (0) 20 8123 9659
D: +44 (0) 20 3287 4268

Asia Pacific

Future Market Insights

IndiaLand Global Tech Park, Unit UG-1, Behind Grand HighStreet, Phase 1, Hinjawadi, MH, Pune – 411057, India

Partner Ecosystem Platform Software Market Outlook (2022 to 2032)

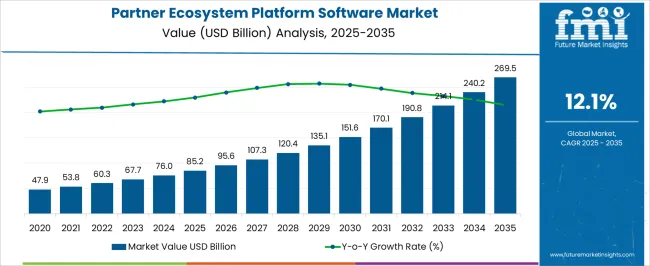
[297 Pages Report] The global partner ecosystem platform software is projected to grow at US$ 62.4 Billion in 2022 and is projected to grow at a compound annual growth rate of 12.4% reaching US$ 201.6 Billion by 2032 during the forecast period.

To help partners leverage hybrid cloud and artificial intelligence for digital transformations of clients, organizations are creating a new partnership framework, skills development, and an expanded Cloud Engagement Fund.

Attributes Details
Partner Ecosystem Platform Software Market CAGR (2022 to 2032) 12.4%
Partner Ecosystem Platform Software Market Size (2022) US$ 62.4 Billion
Partner Ecosystem Platform Software Market Size (2032) US$ 201.6 Billion

Business is adapting to new ways of operating after the pandemic, and their growth expectations are evolving along with it. By establishing new revenue streams that help them achieve their objectives quickly, many B2B companies are scaling their business models in order to gain efficiency and gain a competitive advantage.

As the digital transformation market expands, the need for accelerating times to market creates the need for innovative partnership models where partners can co-create ideas and work together on commercial sales. In order for businesses to achieve traction in the market, they are increasingly realizing the importance of building a network of partners that they can rely on to build trust and transparency with and this helps to get the attention of the market.

Historically, businesses have relied primarily on reseller relationships as a way of reaching out to partners. Business partnerships and go-to-market strategies expanded as companies upgraded their expertise to offer a more value-added service across the value chain.

Don't pay for what you don't need

Customize your report by selecting specific countries or regions and save 30%!

What are the Potential Market Growth Opportunities for Partner Ecosystem Platform Software?

Partner ecosystems can yield incredible returns for brands who truly invest in them since they can gain access to a huge network of partners. Technological advancements and increasing funding from various organizations will stimulate the market for partner ecosystem software.

With an ecosystem of partners, organizations can focus on creating value in a co-creative way. In addition to creating exceptional customer experiences, organizations can also provide excellent partner experiences. Partner companies in a B2B ecosystem form a strategic alliance and work cooperatively to achieve mutual benefits.

In addition to increasing economic value, increasing competitiveness, and growing sales, good partner ecosystems can also strengthen the competitiveness of enterprises. Companies offering software and services are developing new tools and platforms to improve execution. They solve a wide variety of problems, such as managing sales opportunities, training, or managing complex partner ecosystems.

The need for a vibrant partner ecosystem is being recognized by executives across the board, enabling them to innovate quickly, deliver exponential benefits to customers, gain access to new and vital resources, and be able to enter new markets at an accelerated pace. In order to make partner ecosystems work better, software and service companies have developed tools and products to address the activities required. By embracing the dynamics of real-time business and collaboration requirements, companies can take advantage of these cloud-based digital platforms to facilitate engagements between ecosystem partners.

Partner Ecosystem Platform Software Market

How do Partner Ecosystem Platform Software Markets deal with Challenges?

Platform ecosystems today have a major problem in the form of insufficient successful execution of strategies. Businesses operating in new ecosystems will need to undertake new governance and management methods to address uncertainty, risk, and change in value.

Many companies have trouble establishing a successful platform and data business ecosystem. It involves a multitude of challenges. A lack of investment in ecosystem development may also prevent the ecosystem from taking off or scaling up quickly enough. A value stream analysis of an ecosystem may have been neglected, while revenue models may be unrealistic or lacking altogether. Although a business ecosystem may experience a successful launch, it might not be able to sustain itself without ample cash flow.

Platform ecosystems tend to be designed mainly from the data and technology standpoint, while businesses tend to overlook key elements of business or human nature. Therefore, there's no required change in the behavior of customers, value creation, and people, which hampers the ecosystem's success.

As companies lack partnership management capabilities and experience, it appears to be a constant challenge to collaborate with partners. Many ecosystem-building projects focus on the need to reinvent the wheel, rather than learning from the existing proven methods. All these factors hinder market growth.

Sudip Saha
Sudip Saha

Principal Consultant

Talk to Analyst

Find your sweet spots for generating winning opportunities in this market.

Comparative View of Partner Ecosystem Platform Software Market

Partner Ecosystem Platform Software Market:

Attributes Partner Ecosystem Platform Software Market
CAGR (2022 to 2032) 12.4%
Growth Factor Customer expectations for a seamless, integrated, tailored experience that addresses all of their needs have increased the market growth for partner ecosystem platform software systems.
Opportunity As cloud providers grow and become more numerous, more opportunities arise for different organizations in the market.
Key Trends As organizations move from fragmented partner relationships working in silos to cooperative relationships across channels and at scale, collaboration across different models will be essential for achieving and sustaining value over time.

Cloud-based Partner Ecosystem Platform Software Market:

Attributes Cloud-based Partner Ecosystem Platform Software Market
CAGR (2022 to 2032) 12.6%
Growth Factor A new era of cross-industry, cross-ecosystem collaboration has begun with the advent of cloud engineering services (CPE) this will further stimulate growth in the market.
Opportunity Providers can take advantage of artificial intelligence to deepen relationships with partners and expand their capabilities through this strategy.
Key Trends The training of employees has become more digital and cloud-based. Businesses have been able to seamlessly transition their entire workforce to a new manner of working and, in some instances, entirely new responsibilities and roles with the use of cloud-based learning management systems.

Large Enterprise Partner Ecosystem Platform Software Market:

Attributes Large Enterprise Partner Ecosystem Platform Software Market
CAGR (2022 to 2032) 12.1%
Growth Factor Implementing and integrating salesforce applications with standard software that is typically part of the complex system landscapes of large enterprise customers.
Opportunity Trainers and certification providers who adhere to standards for technology solutions within a variety of industries are capable of becoming highly influential endorsers of the technology, giving large enterprises the opportunity to succeed in the market.
Key Trends Companies are aligning new skills with competency frameworks and job roles to build credibility with business partners, and they are integrating training with the partners' learning management systems.

Since the COVID-19 pandemic began in 2020, enterprises have dramatically increased their spending on cloud-based IT. Globally, digital transformation has been accelerated by sudden and massive changes in the workforce and resource allocation, as well as relationships and communications with suppliers and customers and the planning and execution of businesses.

By integrating both technologies seamlessly, consumers of both brands benefit from increased functionality and better usability. The growing demand for digitization along with the growth in digital platforms provides the market with more opportunities. Due to government initiatives, technological advances, and business management solutions, the popularity of partner ecosystem platform software in global businesses is expected to rise.

The ability to automate functions like monitoring user support and performance optimization has become increasingly important to businesses to provide cost-efficient management of managed application services. Cloud Engagement Fund (CEF) enables businesses to support their ecosystem by providing partners with cloud credits and the associated technical resources, so they can help move customers' workloads to hybrid clouds. Due to this trend, firms are opening up funds to all types of partners, whether they resell, service, or build technology.

How is the Partner Ecosystem Platform Software Market Being Stimulated by Large Enterprises?

The market is likely to see an increase in demand for enterprise software applications as the adoption of partner ecosystem platforms rises. Cloud-based solutions are being adopted rapidly by large companies, and this trend will likely continue during the forecast period. According to estimates, the adoption rate of partner ecosystem platform software will increase at a rate of 12.6% in large companies. The adoption of partner ecosystem platform software in large organizations is higher than that in small and medium enterprises. Therefore, partner ecosystem platform software enables organizations to maximize their benefits while offering an affordable pricing model and scalability.

Companies spend a lot of money on Research and Development in manufacturing, so they can use advanced software tools like partner ecosystem platform software to help them run their businesses more efficiently. Additionally, large companies spend a lot of money becoming tech-savvy in order to get a bigger share of the market in a competitive world. In addition, large businesses spend a lot of money on training, seminars, and education of their employees about partner ecosystem platform software, so they're updated on the latest tech trends in the market. In addition to suiting smaller subsidiaries, SaaS solutions are also beneficial for larger enterprises that want to add functionality to their processes.

Get the data you need at a Fraction of the cost

Personalize your report by choosing insights you need
and save 40%!

Why are Cloud-based Partner Ecosystem Platforms more Preferred?

Cloud engineering services have resulted in the growth of cloud partner ecosystems, which has opened up a new era of cross-industry and cross-ecosystem collaboration. In these ecosystems, partners work independently, working individually in an effort to serve their own set of customers with their own collection of goods and services, but in addition, collaborating, sharing, and evolving together. The market for cloud

This partner ecosystem can be mutually beneficial for all ecosystem members since the data, insights, and solutions are shared in a cloud environment. Cloud integration and network collaboration have enabled such sharing to become feasible in the market. CPEs and cloud technology have become even more relevant after the COVID-19 crisis.

Increasingly, businesses are relying on the cloud to transform how they and their partners interact, function, and develop. In addition, cloud computing has made it possible for niche and emerging technologies to provide businesses with exponential returns. With the growth of cloud technology, CPEs have become an increasingly crucial aspect of surviving in Business 4.0. Cloud technology and reliance on CPEs for business innovation gave enterprises a strong platform to effectively navigate the financial crisis.

Partner Ecosystem Platform Software Regional Outlook

How do the various regions affect the growth of Partner Ecosystem Platform Software?

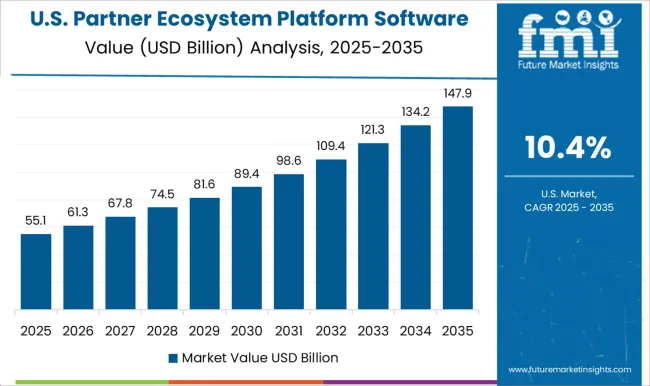
With the USA and Canada among the most economically and technologically advanced countries in the world, North America will account for US$ 25.9 Billion of market revenue over the forecast period. The revenue of the USA partner ecosystem platform software market is projected to account for 12.2% CAGR of the total in 2032, driven by a high adoption rate of cloud services and IoT products, as well as many companies. As a result of high investments in the USA and subsequent technological innovations, the market for cloud-based platform software is experiencing rapid growth.

The Asia-Pacific region is expected to grow at the fastest rate during the forecast period for partner ecosystem platform software, followed by LAMEA. Due to the increasing demand for flexible and transparent processes, Asia-Pacific is expected to have an increased demand for ecosystem platform resource planning and IT infrastructure expansion. China accounts for 11.9% CAGR of the revenue growth in the region. Technology advancements and the emergence of large numbers of IT firms in many developing nations have further fueled the market for partner ecosystem platform software.

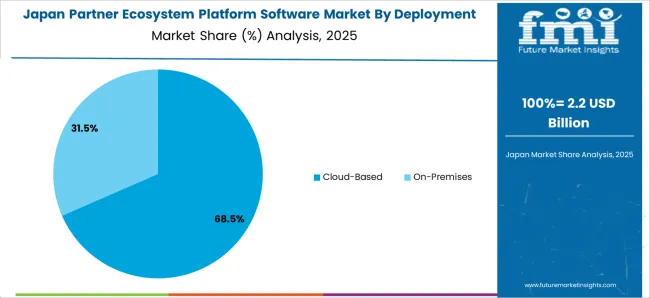
Over the forecast period, Japan is expected to register a CAGR of 10.9% in 2032. The growth of SMEs in South Korea and the increasing demand for cloud storage systems are expected to drive the market to grow at a 10.1% compound annual growth rate over the next few years.

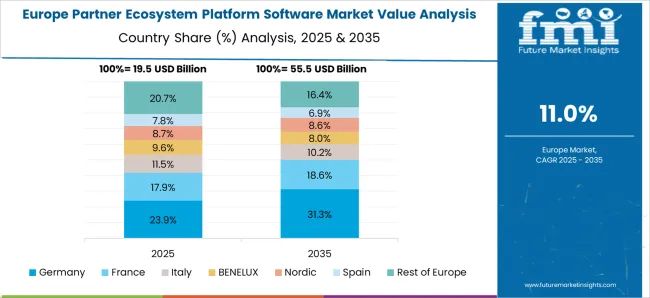
During the forecast period, the partner ecosystem platform software market in the UK is expected to grow at a compound annual growth rate of 11.4% CAGR. The market for partner ecosystem platform software in the telecom industry is expected to bolster the market's growth in the coming years. For instance, Vodafone UK planned to develop an open partner ecosystem as it targets new revenue streams in March 2022. Building a new kind of business culture involves not only deploying digital platforms and creating new services but also driving revenue streams by seeking out new sources of revenue in the market.

How Competitive is the Partner Ecosystem Platform Software Market?

Strategic partnerships can increase revenue and market share while meeting consumer demand and increasing production for manufacturers. The benefits of new technologies will be enjoyed by end-users through the introduction of new products. Having a strategic partnership will enable the company to increase its production capacity.

Partner Ecosystem Platform Software Market Developments:

  • As IBM's Ecosystem momentum accelerates, it announced new benefits in May 2021. The ecosystem is integral to IBM's growth strategy, and IBM is investing $1 billion to help partners and customers take advantage of the estimated $1 trillion hybrid-cloud markets. In addition, they have simplified engagements, streamlined go-to-market strategies, and customized Build, Sell, and Service offerings to help clients get up and running fast. Additionally, the firm is launching new skills, training, and perks to help partners succeed in an ever more competitive market.
  • In June 2021, TIBCO Partner Ecosystem will provide partners with an environment that will allow them to create, market, sell, and deliver TIBCO solutions that achieve the highest degree of customer satisfaction and success. To ensure partner success and satisfaction, the company provided the right opportunities and resources for learning about and getting certified in TIBCO products and solutions. As part of TIBCO's partner ecosystem, there are a number of education programs and initiatives for partners. TIBCO is proud to launch the Champions Program to recognize and celebrate the hard work of partners and customers who delight customers and leverage TIBCO technology to realize meaningful results for their companies.
  • Ericsson launched their Intelligent Automation Platform in November 2021, a platform for service management, orchestration, and smart automation of mobile networks that has the capability to automate any mobile network intelligently. The company will add the Ericsson Intelligent Automation Platform to its line-up of 5G core products, as well as a suite of new Apps to build the next generation of mobile networks, building on its existing cloud-native dual-mode 5G core and Cloud RAN offerings. Using the solution, users can take advantage of artificial intelligence (AI), as well as automation, which means improvements to network performance, operational efficiency, and customer experience to help create a smarter network.
  • TPG Capital, a private equity platform of global alternative asset management firm TPG, today announced it will acquire Wind River® for $4.3 billion in cash from Aptiv PLC, a global technology company devoted to making mobility safer, greener, and more connected. As connected, software-defined vehicles become increasingly integral parts of a broader intelligent ecosystem, the automotive industry is undergoing its greatest transformation in more than a century.
  • Microsoft, a partner-led organization, announced its intention of continuing its expansion with Azure Space in May 2022. In addition to being a platform for innovation, Microsoft Space will also empower others by partnering with a community of partners. Aside from announcing new agreements with Thales, Loft, and Ball, Azure Space introduces a number of new partnerships to enable its increasingly interconnected ecosystem to extend connectivity globally, discover new insights, and drive innovation, both on Earth and in orbit. A global 5G network to cover underserved areas is being developed jointly by Omnispace and Microsoft.

Key Players

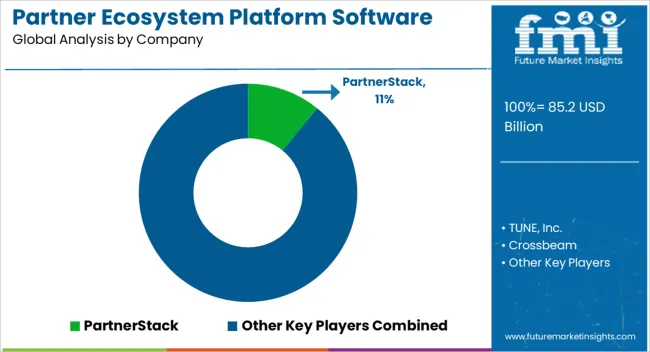
  • PartnerStack
  • Partnered
  • Tune
  • Crossbeam
  • HubSpot
  • Impact
  • Mirakl
  • Partnerize
  • Alliance board
  • Apideck

Key Segments Covered in the Partner Ecosystem Platform Software Market Report

Bby Type:

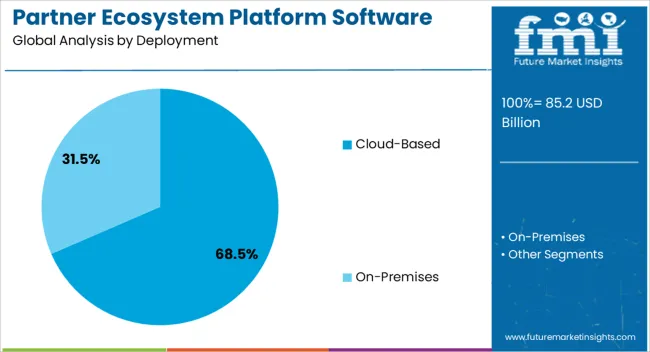
  • Cloud-Based
  • On-Premises

By Application:

  • Large Enterprises
  • SMEs

By Region:

  • North America
  • Europe
  • Asia Pacific
  • Middle East and Africa
  • Latin America

Frequently Asked Questions

What is the growth outlook for the partner ecosystem platform software market?

The partner ecosystem platform software market is expected to grow at a steady CAGR of 12.4% over the forecast period.

What was the size of the partner ecosystem platform software market size in 2021?

The global market for partner ecosystem platform software was valued at US$ 49.2 Billion in 2021.

Which application has the highest market value in the partner ecosystem platform software market?

Large Enterprises are projected to have the highest market with a CAGR of 12.1% during the forecast period.

Which region dominates the global Partner Ecosystem Platform Software market?

The Asia Pacific leads the global Partner Ecosystem Platform Software market during the forecast period.

What will be the market size of partner ecosystem platform software by 2032?

The market for partner ecosystem platform software is expected to grow by nearly US$ 201.6 Billion by 2032.

What is the projected dollar growth of partner ecosystem platform software from 2022 to 2032?

The absolute dollar growth of partner ecosystem platform software is estimated at US$ 139.2 Billion

What is the market growth of the UK in the partner ecosystem platform software market?

It is projected that UK’s economy will grow at a CAGR of 11.4% during the period of forecast.

Table of Content

1. Executive Summary | Partner Ecosystem Platform Software Market

    1.1. Global Market Outlook

    1.2. Summary of Statistics

    1.3. Key Market Characteristics & Attributes

    1.4. FMI Analysis and Recommendations

2. Market Overview

    2.1. Market Coverage / Taxonomy

    2.2. Market Definition / Scope / Limitations

3. Market Risks and Trends Assessment

    3.1. Risk Assessment

        3.1.1. COVID-19 Crisis and Impact on Demand

        3.1.2. COVID-19 Impact Benchmark with Previous Crisis

        3.1.3. Impact on Market Value (US$ Million)

        3.1.4. Assessment by Key Countries

        3.1.5. Assessment by Key Market Segments

        3.1.6. Action Points and Recommendation for Suppliers

    3.2. Key Trends Impacting the Market

    3.3. Formulation and Product Development Trends

4. Market Background and Foundation Data Points

    4.1. Global Market (US$ Million)

    4.2. Market Opportunity Assessment (US$ Million)

        4.2.1. Total Available Market

        4.2.2. Serviceable Addressable Market

        4.2.3. Serviceable Obtainable Market

    4.3. Market Scenario Forecast

        4.3.1. Demand in Optimistic Scenario

        4.3.2. Demand in Likely Scenario

        4.3.3. Demand in Conservative Scenario

    4.4. Investment Feasibility Analysis

        4.4.1. Investment in Established Markets

            4.4.1.1. In Short Term

            4.4.1.2. In Long Term

        4.4.2. Investment in Emerging Markets

            4.4.2.1. In Short Term

            4.4.2.2. In Long Term

    4.5. Forecast Factors - Relevance & Impact

        4.5.1. Top Companies Historical Growth

        4.5.2. Global Market Growth

        4.5.3. Adoption Rate, By Country

    4.6. Market Dynamics

        4.6.1. Market Driving Factors and Impact Assessment

        4.6.2. Prominent Market Challenges and Impact Assessment

        4.6.3. Market Opportunities

        4.6.4. Prominent Trends in the Global Market & Their Impact Assessment

5. Key Success Factors

    5.1. Manufacturers’ Focus on Low Penetration High Growth Markets

    5.2. Banking on with Segments High Incremental Opportunity

    5.3. Peer Benchmarking

6. Global Market Demand Analysis 2015 to 2021 and Forecast, 2022 to 2032

    6.1. Historical Market Analysis, 2015 to 2021

    6.2. Current and Future Market Projections, 2022 to 2032

    6.3. Y-o-Y Growth Trend Analysis

7. Global Market Value Analysis 2015 to 2021 and Forecast, 2022 to 2032

    7.1. Historical Market Value (US$ Million) Analysis, 2015 to 2021

    7.2. Current and Future Market Value (US$ Million) Projections, 2022 to 2032

        7.2.1. Y-o-Y Growth Trend Analysis

        7.2.2. Absolute $ Opportunity Analysis

8. Global Market Analysis 2015 to 2021 and Forecast 2022 to 2032, By Type

    8.1. Introduction / Key Findings

    8.2. Historical Market Size (US$ Million) Analysis By Type, 2015 to 2021

    8.3. Current and Future Market Size (US$ Million) Analysis and Forecast By Type, 2022 to 2032

        8.3.1. Cloud Based

        8.3.2. On Premises

    8.4. Market Attractiveness Analysis By Type

9. Global Market Analysis 2015 to 2021 and Forecast 2022 to 2032, By Application

    9.1. Introduction / Key Findings

    9.2. Historical Market Size (US$ Million) Analysis By Application, 2015 to 2021

    9.3. Current and Future Market Size (US$ Million) Analysis and Forecast By Application, 2022 to 2032

        9.3.1. Large Enterprises

        9.3.2. SMEs

    9.4. Market Attractiveness Analysis By Application

10. Global Market Analysis 2015 to 2021 and Forecast 2022 to 2032, By Region

    10.1. Introduction

    10.2. Historical Market Size (US$ Million) Analysis By Region, 2015 to 2021

    10.3. Current Market Size (US$ Million) & Analysis and Forecast By Region, 2022 to 2032

        10.3.1. North America

        10.3.2. Latin America

        10.3.3. Europe

        10.3.4. Asia Pacific

        10.3.5. Middle East and Africa (MEA)

    10.4. Market Attractiveness Analysis By Region

11. North America Market Analysis 2015 to 2021 and Forecast 2022 to 2032

    11.1. Introduction

    11.2. Pricing Analysis

    11.3. Historical Market Value (US$ Million) Trend Analysis By Market Taxonomy, 2015 to 2021

    11.4. Market Value (US$ Million) & Forecast By Market Taxonomy, 2022 to 2032

        11.4.1. By Country

            11.4.1.1. United States of America

            11.4.1.2. Canada

            11.4.1.3. Rest of North America

        11.4.2. By Type

        11.4.3. By Application

    11.5. Market Attractiveness Analysis

        11.5.1. By Country

        11.5.2. By Type

        11.5.3. By Application

12. Latin America Market Analysis 2015 to 2021 and Forecast 2022 to 2032

    12.1. Introduction

    12.2. Pricing Analysis

    12.3. Historical Market Value (US$ Million) Trend Analysis By Market Taxonomy, 2015 to 2021

    12.4. Market Value (US$ Million) & Forecast By Market Taxonomy, 2022 to 2032

        12.4.1. By Country

            12.4.1.1. Brazil

            12.4.1.2. Mexico

            12.4.1.3. Rest of Latin America

        12.4.2. By Type

        12.4.3. By Application

    12.5. Market Attractiveness Analysis

        12.5.1. By Country

        12.5.2. By Type

        12.5.3. By Application

13. Europe Market Analysis 2015 to 2021 and Forecast 2022 to 2032

    13.1. Introduction

    13.2. Pricing Analysis

    13.3. Historical Market Value (US$ Million) Trend Analysis By Market Taxonomy, 2015 to 2021

    13.4. Market Value (US$ Million) & Forecast By Market Taxonomy, 2022 to 2032

        13.4.1. By Country

            13.4.1.1. Germany

            13.4.1.2. France

            13.4.1.3. United Kingdom

            13.4.1.4. Italy

            13.4.1.5. Benelux

            13.4.1.6. Nordic Countries

            13.4.1.7. Rest of Europe

        13.4.2. By Type

        13.4.3. By Application

    13.5. Market Attractiveness Analysis

        13.5.1. By Country

        13.5.2. By Type

        13.5.3. By Application

14. Asia Pacific Market Analysis 2015 to 2021 and Forecast 2022 to 2032

    14.1. Introduction

    14.2. Pricing Analysis

    14.3. Historical Market Value (US$ Million) Trend Analysis By Market Taxonomy, 2015 to 2021

    14.4. Market Value (US$ Million) & Forecast By Market Taxonomy, 2022 to 2032

        14.4.1. By Country

            14.4.1.1. China

            14.4.1.2. Japan

            14.4.1.3. South Korea

            14.4.1.4. Rest of Asia Pacific

        14.4.2. By Type

        14.4.3. By Application

    14.5. Market Attractiveness Analysis

        14.5.1. By Country

        14.5.2. By Type

        14.5.3. By Application

15. Middle East and Africa Market Analysis 2015 to 2021 and Forecast 2022 to 2032

    15.1. Introduction

    15.2. Pricing Analysis

    15.3. Historical Market Value (US$ Million) Trend Analysis By Market Taxonomy, 2015 to 2021

    15.4. Market Value (US$ Million) & Forecast By Market Taxonomy, 2022 to 2032

        15.4.1. By Country

            15.4.1.1. GCC Countries

            15.4.1.2. South Africa

            15.4.1.3. Turkey

            15.4.1.4. Rest of Middle East and Africa

        15.4.2. By Type

        15.4.3. By Application

    15.5. Market Attractiveness Analysis

        15.5.1. By Country

        15.5.2. By Type

        15.5.3. By Application

16. Key Countries Market Analysis 2015 to 2021 and Forecast 2022 to 2032

    16.1. Introduction

        16.1.1. Market Value Proportion Analysis, By Key Countries

        16.1.2. Global Vs. Country Growth Comparison

    16.2. US Market Analysis

        16.2.1. Value Proportion Analysis by Market Taxonomy

        16.2.2. Value & Analysis and Forecast by Market Taxonomy, 2015 to 2032

            16.2.2.1. By Type

            16.2.2.2. By Application

    16.3. Canada Market Analysis

        16.3.1. Value Proportion Analysis by Market Taxonomy

        16.3.2. Value & Analysis and Forecast by Market Taxonomy, 2015 to 2032

            16.3.2.1. By Type

            16.3.2.2. By Application

    16.4. Mexico Market Analysis

        16.4.1. Value Proportion Analysis by Market Taxonomy

        16.4.2. Value & Analysis and Forecast by Market Taxonomy, 2015 to 2032

            16.4.2.1. By Type

            16.4.2.2. By Application

    16.5. Brazil Market Analysis

        16.5.1. Value Proportion Analysis by Market Taxonomy

        16.5.2. Value & Analysis and Forecast by Market Taxonomy, 2015 to 2032

            16.5.2.1. By Type

            16.5.2.2. By Application

    16.6. Germany Market Analysis

        16.6.1. Value Proportion Analysis by Market Taxonomy

        16.6.2. Value & Analysis and Forecast by Market Taxonomy, 2015 to 2032

            16.6.2.1. By Type

            16.6.2.2. By Application

    16.7. France Market Analysis

        16.7.1. Value Proportion Analysis by Market Taxonomy

        16.7.2. Value & Analysis and Forecast by Market Taxonomy, 2015 to 2032

            16.7.2.1. By Type

            16.7.2.2. By Application

    16.8. Italy Market Analysis

        16.8.1. Value Proportion Analysis by Market Taxonomy

        16.8.2. Value & Analysis and Forecast by Market Taxonomy, 2015 to 2032

            16.8.2.1. By Type

            16.8.2.2. By Application

    16.9. BENELUX Market Analysis

        16.9.1. Value Proportion Analysis by Market Taxonomy

        16.9.2. Value & Analysis and Forecast by Market Taxonomy, 2015 to 2032

            16.9.2.1. By Type

            16.9.2.2. By Application

    16.10. UK Market Analysis

        16.10.1. Value Proportion Analysis by Market Taxonomy

        16.10.2. Value & Analysis and Forecast by Market Taxonomy, 2015 to 2032

            16.10.2.1. By Type

            16.10.2.2. By Application

    16.11. Nordic Countries Market Analysis

        16.11.1. Value Proportion Analysis by Market Taxonomy

        16.11.2. Value & Analysis and Forecast by Market Taxonomy, 2015 to 2032

            16.11.2.1. By Type

            16.11.2.2. By Application

    16.12. China Market Analysis

        16.12.1. Value Proportion Analysis by Market Taxonomy

        16.12.2. Value & Analysis and Forecast by Market Taxonomy, 2015 to 2032

            16.12.2.1. By Type

            16.12.2.2. By Application

    16.13. Japan Market Analysis

        16.13.1. Value Proportion Analysis by Market Taxonomy

        16.13.2. Value & Analysis and Forecast by Market Taxonomy, 2015 to 2032

            16.13.2.1. By Type

            16.13.2.2. By Application

    16.14. South Korea Market Analysis

        16.14.1. Value Proportion Analysis by Market Taxonomy

        16.14.2. Value & Analysis and Forecast by Market Taxonomy, 2015 to 2032

            16.14.2.1. By Type

            16.14.2.2. By Application

    16.15. GCC Countries Market Analysis

        16.15.1. Value Proportion Analysis by Market Taxonomy

        16.15.2. Value & Analysis and Forecast by Market Taxonomy, 2015 to 2032

            16.15.2.1. By Type

            16.15.2.2. By Application

    16.16. South Africa Market Analysis

        16.16.1. Value Proportion Analysis by Market Taxonomy

        16.16.2. Value & Analysis and Forecast by Market Taxonomy, 2015 to 2032

            16.16.2.1. By Type

            16.16.2.2. By Application

    16.17. Turkey Market Analysis

        16.17.1. Value Proportion Analysis by Market Taxonomy

        16.17.2. Value & Analysis and Forecast by Market Taxonomy, 2015 to 2032

            16.17.2.1. By Type

            16.17.2.2. By Application

        16.17.3. Competition Landscape and Player Concentration in the Country

17. Market Structure Analysis

    17.1. Market Analysis by Tier of Companies

    17.2. Market Concentration

    17.3. Market Share Analysis of Top Players

    17.4. Market Presence Analysis

        17.4.1. By Regional Footprint of Players

        17.4.2. Product Footprint by Players

18. Competition Analysis

    18.1. Competition Dashboard

    18.2. Competition Benchmarking

    18.3. Competition Deep Dive

        18.3.1. PartnerStack

            18.3.1.1. Overview

            18.3.1.2. Product Portfolio

            18.3.1.3. Sales Footprint

            18.3.1.4. Strategy Overview

        18.3.2. Partnered

            18.3.2.1. Overview

            18.3.2.2. Product Portfolio

            18.3.2.3. Sales Footprint

            18.3.2.4. Strategy Overview

        18.3.3. Tune

            18.3.3.1. Overview

            18.3.3.2. Product Portfolio

            18.3.3.3. Sales Footprint

            18.3.3.4. Strategy Overview

        18.3.4. Crossbeam

            18.3.4.1. Overview

            18.3.4.2. Product Portfolio

            18.3.4.3. Sales Footprint

            18.3.4.4. Strategy Overview

        18.3.5. HubSpot

            18.3.5.1. Overview

            18.3.5.2. Product Portfolio

            18.3.5.3. Sales Footprint

            18.3.5.4. Strategy Overview

        18.3.6. Impact

            18.3.6.1. Overview

            18.3.6.2. Product Portfolio

            18.3.6.3. Sales Footprint

            18.3.6.4. Strategy Overview

        18.3.7. Mirakl

            18.3.7.1. Overview

            18.3.7.2. Product Portfolio

            18.3.7.3. Sales Footprint

            18.3.7.4. Strategy Overview

        18.3.8. Partnerize

            18.3.8.1. Overview

            18.3.8.2. Product Portfolio

            18.3.8.3. Sales Footprint

            18.3.8.4. Strategy Overview

        18.3.9. Alliance board

            18.3.9.1. Overview

            18.3.9.2. Product Portfolio

            18.3.9.3. Sales Footprint

            18.3.9.4. Strategy Overview

        18.3.10. Apideck

            18.3.10.1. Overview

            18.3.10.2. Product Portfolio

            18.3.10.3. Sales Footprint

            18.3.10.4. Strategy Overview

19. Assumptions and Acronyms Used

20. Research Methodology

Don't pay for what you don't need

Customize your report by selecting specific countries or regions and save 30%!

List of Tables

Table 1: Global Market Value (US$ Million), By Type, 2015 to 2021

Table 2: Global Market Value (US$ Million), By Type, 2022 to 2032

Table 3: Global Market Value (US$ Million), By Application, 2015 to 2021

Table 4: Global Market Value (US$ Million), By Application, 2022 to 2032

Table 5: Global Market, By Region, 2015 to 2021

Table 6: Global Market, By Region, 2022 to 2032

Table 7: North America Market Value (US$ Million), By Type, 2015 to 2021

Table 8: North America Market Value (US$ Million), By Type, 2022 to 2032

Table 9: North America Market Value (US$ Million), By Application, 2015 to 2021

Table 10: North America Market Value (US$ Million), By Application, 2022 to 2032

Table 11: North America Market, By Country, 2015 to 2021

Table 12: North America Market, By Country, 2022 to 2032

Table 13: Latin America Market Value (US$ Million), By Type, 2015 to 2021

Table 14: Latin America Market Value (US$ Million), By Type, 2022 to 2032

Table 15: Latin America Market Value (US$ Million), By Application, 2015 to 2021

Table 16: Latin America Market Value (US$ Million), By Application, 2022 to 2032

Table 17: Latin America Market, By Country, 2015 to 2021

Table 18: Latin America Market, By Country, 2022 to 2032

Table 19: Europe Market Value (US$ Million), By Type, 2015 to 2021

Table 20: Europe Market Value (US$ Million), By Type, 2022 to 2032

Table 21: Europe Market Value (US$ Million), By Application, 2015 to 2021

Table 22: Europe Market Value (US$ Million), By Application, 2022 to 2032

Table 23: Europe Market, By Country, 2015 to 2021

Table 24: Europe Market, By Country, 2022 to 2032

Table 25: Asia Pacific Market Value (US$ Million), By Type, 2015 to 2021

Table 26: Asia Pacific Market Value (US$ Million), By Type, 2022 to 2032

Table 27: Asia Pacific Market Value (US$ Million), By Application, 2015 to 2021

Table 28: Asia Pacific Market Value (US$ Million), By Application, 2022 to 2032

Table 29: Asia Pacific Market, By Country, 2015 to 2021

Table 30: Asia Pacific Market, By Country, 2022 to 2032

Table 31: MEA Market Value (US$ Million), By Type, 2015 to 2021

Table 32: MEA Market Value (US$ Million), By Type, 2022 to 2032

Table 33: MEA Market Value (US$ Million), By Application, 2015 to 2021

Table 34: MEA Market Value (US$ Million), By Application, 2022 to 2032

Table 35: MEA Market, By Country, 2015 to 2021

Table 36: MEA Market, By Country, 2022 to 2032

Table 37: Global Market Incremental $ Opportunity, By Type, 2015 to 2021

Table 38: Global Market Incremental $ Opportunity, By Application, 2022 to 2032

Table 39: Global Market Incremental $ Opportunity, By Region, 2022 to 2032

Table 40: North America Market Incremental $ Opportunity, By Type, 2015 to 2021

Table 41: North America Market Incremental $ Opportunity, By Application, 2022 to 2032

Table 42: North America Market Incremental $ Opportunity, By Country, 2022 to 2032

Table 43: Latin America Market Incremental $ Opportunity, By Type, 2015 to 2021

Table 44: Latin America Market Incremental $ Opportunity, By Application, 2022 to 2032

Table 45: Latin America Market Incremental $ Opportunity, By Country, 2022 to 2032

Table 46: Europe Market Incremental $ Opportunity, By Type, 2015 to 2021

Table 47: Europe Market Incremental $ Opportunity, By Application, 2022 to 2032

Table 48: Europe Market Incremental $ Opportunity, By Country, 2022 to 2032

Table 49: Asia Pacific Market Incremental $ Opportunity, By Type, 2015 to 2021

Table 50: Asia Pacific Market Incremental $ Opportunity, By Application, 2022 to 2032

Table 51: Asia Pacific Market Incremental $ Opportunity, By Country,2022 to 2032

Table 52: MEA Market Incremental $ Opportunity, By Type, 2015 to 2021

Table 53: MEA Market Incremental $ Opportunity, By Application, 2022 to 2032

Table 54: MEA Market Incremental $ Opportunity, By Country, 2022 to 2032
Sudip Saha
Sudip Saha

Principal Consultant

Talk to Analyst

Find your sweet spots for generating winning opportunities in this market.

List of Charts

Figure 1: Global Market Value (US$ Million) and Year-on-Year Growth, 2015 to 2032

Figure 2: Global Market Absolute $ Historical Gain (2015 to 2021) and Opportunity (2022 to 2032), US$ Million

Figure 3: Global Market Share, By Type, 2022 & 2032

Figure 4: Global Market Y-o-Y Growth Projections, By Type - 2022 to 2032

Figure 5: Global Market Attractiveness Index, By Type - 2022 to 2032

Figure 6: Global Market Share, By Application, 2022 & 2032

Figure 7: Global Market Y-o-Y Growth Projections, By Application - 2022 to 2032

Figure 8: Global Market Attractiveness Index, By Application - 2022 to 2032

Figure 9: Global Market Share, By Region, 2022 & 2032

Figure 10: Global Market Y-o-Y Growth Projections, By Region - 2022 to 2032

Figure 11: Global Market Attractiveness Index, By Region - 2022 to 2032

Figure 12: North America Market Value (US$ Million) and Year-on-Year Growth, 2015 to 2032

Figure 13: North America Market Absolute $ Opportunity Historical (2015 to 2021) and Forecast Period (2022 to 2032), US$ Million

Figure 14: North America Market Share, By Type, 2022 & 2032

Figure 15: North America Market Y-o-Y Growth Projections, By Type - 2022 to 2032

Figure 16: North America Market Attractiveness Index, By Type - 2022 to 2032

Figure 17: North America Market Share, By Application, 2022 & 2032

Figure 18: North America Market Y-o-Y Growth Projections, By Application - 2022 to 2032

Figure 19: North America Market Attractiveness Index, By Application - 2022 to 2032

Figure 20: North America Market Share, By Country, 2022 & 2032

Figure 21: North America Market Y-o-Y Growth Projections, By Country - 2022 to 2032

Figure 22: North America Market Attractiveness Index, By Country - 2022 to 2032

Figure 23: Latin America Market Value (US$ Million) and Year-on-Year Growth, 2015 to 2032

Figure 24: Latin America Market Absolute $ Opportunity Historical (2015 to 2021) and Forecast Period (2022 to 2032), US$ Million

Figure 25: Latin America Market Share, By Type, 2022 & 2032

Figure 26: Latin America Market Y-o-Y Growth Projections, By Type - 2022 to 2032

Figure 27: Latin America Market Attractiveness Index, By Type - 2022 to 2032

Figure 28: Latin America Market Share, By Application, 2022 & 2032

Figure 29: Latin America Market Y-o-Y Growth Projections, By Application - 2022 to 2032

Figure 30: Latin America Market Attractiveness Index, By Application - 2022 to 2032

Figure 31: Latin America Market Share, By Country, 2022 & 2032

Figure 32: Latin America Market Y-o-Y Growth Projections, By Country - 2022 to 2032

Figure 33: Latin America Market Attractiveness Index, By Country - 2022 to 2032

Figure 34: Europe Market Value (US$ Million) and Year-on-Year Growth, 2015 to 2032

Figure 35: Europe Market Absolute $ Opportunity Historical (2015 to 2021) and Forecast Period (2022 to 2032), US$ Million

Figure 36: Europe Market Share, By Type, 2022 & 2032

Figure 37: Europe Market Y-o-Y Growth Projections, By Type - 2022 to 2032

Figure 38: Europe Market Attractiveness Index, By Type - 2022 to 2032

Figure 39: Europe Market Share, By Application, 2022 & 2032

Figure 40: Europe Market Y-o-Y Growth Projections, By Application - 2022 to 2032

Figure 41: Europe Market Attractiveness Index, By Application - 2022 to 2032

Figure 42: Europe Market Share, By Country, 2022 & 2032

Figure 43: Europe Market Y-o-Y Growth Projections, By Country - 2022 to 2032

Figure 44: Europe Market Attractiveness Index, By Country - 2022 to 2032

Figure 45: MEA Market Value (US$ Million) and Year-on-Year Growth, 2015 to 2032

Figure 46: MEA Market Absolute $ Opportunity Historical (2015 to 2021) and Forecast Period (2022 to 2032), US$ Million

Figure 47: MEA Market Share, By Type, 2022 & 2032

Figure 48: MEA Market Y-o-Y Growth Projections, By Type - 2022 to 2032

Figure 49: MEA Market Attractiveness Index, By Type - 2022 to 2032

Figure 50: MEA Market Share, By Application, 2022 & 2032

Figure 51: MEA Market Y-o-Y Growth Projections, By Application - 2022 to 2032

Figure 52: MEA Market Attractiveness Index, By Application - 2022 to 2032

Figure 53: MEA Market Share, By Country, 2022 & 2032

Figure 54: MEA Market Y-o-Y Growth Projections, By Country - 2022 to 2032

Figure 55: MEA Market Attractiveness Index, By Country - 2022 to 2032

Figure 56: Asia Pacific Market Value (US$ Million) and Year-on-Year Growth, 2015 to 2032

Figure 57: Asia Pacific Market Absolute $ Opportunity Historical (2015 to 2021) and Forecast Period (2022 to 2032), US$ Million

Figure 58: Asia Pacific Market Share, By Type, 2022 & 2032

Figure 59: Asia Pacific Market Y-o-Y Growth Projections, By Type - 2022 to 2032

Figure 60: Asia Pacific Market Attractiveness Index, By Type - 2022 to 2032

Figure 61: Asia Pacific Market Share, By Application, 2022 & 2032

Figure 62: Asia Pacific Market Y-o-Y Growth Projections, By Application-2022 to 2032

Figure 63: Asia Pacific Market Attractiveness Index, By Application - 2022 to 2032

Figure 64: Asia Pacific Market Share, By Country, 2022 & 2032

Figure 65: Asia Pacific Market Y-o-Y Growth Projections, By Country -2022 to 2032

Figure 66: Asia Pacific Market Attractiveness Index, By Country - 2022 to 2032

Figure 67: US Market Value (US$ Million) and Forecast, 2022 to 2032

Figure 68: US Market Share, By Type, 2021

Figure 69: US Market Share, By Application, 2021

Figure 70: Canada Market Value (US$ Million) and Forecast, 2022 to 2032

Figure 71: Canada Market Share, By Type, 2021

Figure 72: Canada Market Share, By Application, 2021

Figure 73: Brazil Market Value (US$ Million) and Forecast, 2022 to 2032

Figure 74: Brazil Market Share, By Type, 2021

Figure 75: Brazil Market Share, By Application, 2021

Figure 76: Mexico Market Value (US$ Million) and Forecast, 2022 to 2032

Figure 77: Mexico Market Share, By Type, 2021

Figure 78: Mexico Market Share, By Application, 2021

Figure 79: Germany Market Value (US$ Million) and Forecast, 2022 to 2032

Figure 80: Germany Market Share, By Type, 2021

Figure 81: Germany Market Share, By Application, 2021

Figure 82: UK Market Value (US$ Million) and Forecast, 2022 to 2032

Figure 83: UK Market Share, By Type, 2021

Figure 84: UK Market Share, By Application, 2021

Figure 85: France Market Value (US$ Million) and Forecast, 2022 to 2032

Figure 86: France Market Share, By Type, 2021

Figure 87: France Market Share, By Application, 2021

Figure 88: Italy Market Value (US$ Million) and Forecast, 2022 to 2032

Figure 89: Italy Market Share, By Type, 2021

Figure 90: Italy Market Share, By Application, 2021

Figure 91: BENELUX Market Value (US$ Million) and Forecast, 2022 to 2032

Figure 92: BENELUX Market Share, By Type, 2021

Figure 93: BENELUX Market Share, By Application, 2021

Figure 94: Nordic Countries Market Value (US$ Million) and Forecast, 2022 to 2032

Figure 95: Nordic Countries Market Share, By Type, 2021

Figure 96: Nordic Countries Market Share, By Application, 2021

Figure 97: China Market Value (US$ Million) and Forecast, 2022 to 2032

Figure 98: China Market Share, By Type, 2021

Figure 99: China Market Share, By Application, 2021

Figure 100: Japan Market Value (US$ Million) and Forecast, 2022 to 2032

Figure 101: Japan Market Share, By Type, 2021

Figure 102: Japan Market Share, By Application, 2021

Figure 103: South Korea Market Value (US$ Million) and Forecast, 2022 to 2032

Figure 104: South Korea Market Share, By Type, 2021

Figure 105: South Korea Market Share, By Application, 2021

Figure 106: GCC Countries Market Value (US$ Million) and Forecast, 2022 to 2032

Figure 107: GCC Countries Market Share, By Type, 2021

Figure 108: GCC Countries Market Share, By Application, 2021

Figure 109: South Africa Market Value (US$ Million) and Forecast, 2022 to 2032

Figure 110: South Africa Market Share, By Type, 2021

Figure 111: South Africa Market Share, By Application, 2021

Figure 112: Turkey Market Value (US$ Million) and Forecast, 2022 to 2032

Figure 113: Turkey Market Share, By Type, 2021

Figure 114: Turkey Market Share, By Application, 2021

Recommendations

Technology

Metrology Software Market

Published : June 2023

Technology

MEA Enterprise Software Market

Published : September 2022

Technology

Russian IT Software and Services Market

Published : December 2014

Explore Technology Insights

View Reports

Partner Ecosystem Platform Software Market