
- Market Size (2026)
- USD 440.0 Mn
- Forecast (2036)
- USD 1090.4 Mn
- CAGR (2026 to 2036)
- 9.5%
How big is the Patient-Derived Xenograft Models Market in 2026?
By 2036, FMI expects the global patient-derived xenograft models market to reach USD 1,090.4 million, growing at 9.5% a year from 2026 to 2036. The market was valued at USD 400.0 million in 2025. FMI estimates USD 440.0 million for 2026.
Patient-Derived Xenograft Models Market Size and Forecast
Table 1: Patient-Derived Xenograft Models Market Size and Forecast
| Market size and forecast | Value |
|---|---|
| Market size in 2025 | USD 400.0 million |
| Estimated market size in 2026 | USD 440.0 million |
| Projected market size by 2036 | USD 1,090.4 million |
| CAGR from 2026 to 2036 | 9.5% |
The commercial value of a tumour bank increasingly depends on the information attached to each model. A sponsor investigating resistance needs prior treatment history and a relevant molecular profile before commissioning an efficacy study. Crown Bioscience lists more than 500 pretreated PDX models and matched organoid options in its current portfolio. This supports a service mix in which model selection and analytical interpretation accompany the animal study.
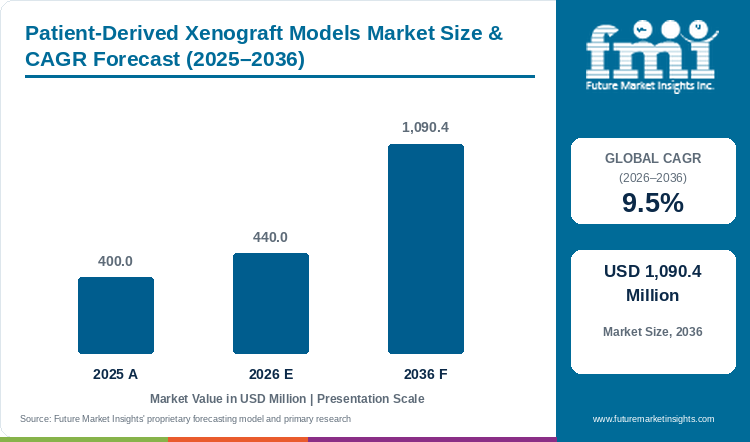
Crown announced its Kannapolis model-development centre in September 2025, covering PDX and related patient-derived platforms. In May 2026, Certis Oncology Solutions and BIOEMTECH announced integrated PDX access for radiopharmaceutical studies at BIOEMTECH facilities. Such arrangements connect model availability with specialized measurements. Vendors must match the biological question and the available evidence to each commission. The market adds USD 650.4 million over the decade, so revenue rises 2.5 times from the 2026 estimate.
Key Market Trends & Insights
- Model licensing has commercial restrictions that a catalogue comparison can miss. The Jackson Laboratory's published terms restrict third-party transfer and fee-for-service use of its tumour material. A sponsor and its contract laboratory therefore need compatible rights before work is assigned.
- Public repositories set a demanding reference for identity and annotation. The NCI's July 2026 model information describes pathology review, lineage checks and sequencing information. Commercial differentiation must extend beyond having access to a tumour fragment.
- Large banks are separating treatment-exposed material from untreated collections. Champions Oncology describes more than 700 pretreated tumours within its wider patient-derived bank. The relevant purchasing distinction is documented treatment context.
Regional Highlights
- China widens its share of global revenue. FMI projects China from 12.0% to 16.2% over 2026 to 2036.
- Share slips for the United States, the United Kingdom and Germany as revenue grows. FMI's 2036 shares are the United States 45.2% (from 46.0%), the United Kingdom 5.4% (from 6.0%) and Germany 5.1% (from 6.0%).
Source: Future Market Insights analysis of the Patient-Derived xenograft models market, 2026.
Analyst Perspective
“The useful unit of competition is a tumour model with a defensible history and a clearly specified decision purpose. A large bank can still leave a sponsor short of the treatment exposure or molecular subgroup it needs. Providers that disclose those limits early can sell better matched programmes. Growth in characterization spending is therefore commercially significant even when the animal-study component remains the leading offering.”
- Anurag Sharma, Principal Consultant, FMI
How is the Patient-Derived Xenograft Models Market segmented?
- By offering: Efficacy and Pharmacology Studies, Model Licensing and Banked Models, and Biomarker and Genomic Characterization.
- By tumour type: Lung, Breast, Colorectal, Pancreatic, Ovarian, and Other Solid Tumours.
- By end user: Pharmaceutical and Biotechnology Companies, Contract Research Organizations, and Academic and Research Institutes.
- By region: North America, Western Europe, East Asia, and Rest of world.
Why does the Efficacy and Pharmacology Studies segment lead by Offering in the Patient-Derived Xenograft Models Market in 2026?
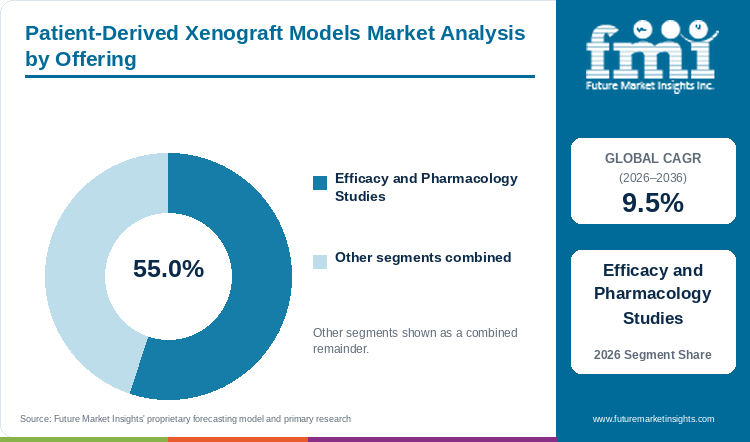
The Efficacy and Pharmacology Studies segment holds 55.0% of the Patient-Derived Xenograft Models Market by offering in 2026.
A completed efficacy programme packages work that the sponsor would otherwise coordinate across model access, experimental delivery and interpretation. The commercial object is the agreed evidence package. The Jackson Laboratory offers both distributed material and conducted efficacy studies, demonstrating that these are separate purchasing routes. A company with its own research infrastructure may buy material. Another can commission the work and operate no local animal facility. Those choices create different revenue content even when both use a related model.
FMI forecasts Efficacy and Pharmacology Studies at USD 570.6 million in 2036. Its share declines to 52.3% as the other offerings develop. Biomarker and Genomic Characterization reaches 25.0%, compared with 20.0% in 2026. The implication is an expanding analytical layer around the core study.
The quality of the model record matters to that mix. NCI's published model information identifies pathology and lineage checks as part of release criteria. A commercial study must preserve the connection between the selected material and the reported result. A low quote becomes less persuasive if the deliverable leaves the sponsor unable to interpret a model's identity or treatment context. Suppliers can distinguish the commission through an explicit record of what was selected and what was measured.
Model Licensing and Banked Models and Biomarker and Genomic Characterization together hold the remaining 45.0% by offering.
Table 2: Offering, 2026 Share
| Leading Share | 2026 market share |
|---|---|
| Efficacy and Pharmacology Studies | 55.0% |
| All Other Segments Combined Share | 45.0% |
Source: Future Market Insights analysis of the Patient-Derived xenograft models market, 2026.
Why does the Other Solid Tumours segment lead by Tumour Type in the Patient-Derived Xenograft Models Market in 2026?
The Other Solid Tumours segment holds 36.0% of the Patient-Derived Xenograft Models Market by tumour type in 2026.
The category's lead reflects breadth. Lung is the leading separately named tumour category at 20.0% in 2026. The combined allocation includes opportunities in solid tumours that need distinct clinical histories and molecular attributes. Oncodesign Services describes more than 200 unique tumours across 19 indications, while Crown's solid-tumour portfolio includes gastric, head-and-neck, liver, melanoma and sarcoma models.
Suppliers face a different stocking decision in these smaller indication groups. A broad bank provides more options for matching a rare phenotype, but each entry still needs usable annotation. Buyers should assess available model attributes before assuming a panel is sufficient for the proposed comparison.
Other Solid Tumours reaches USD 395.2 million and a 36.2% share in 2036. Its weight remains fairly stable in FMI's outlook. This favours sustained curation across multiple indications. The separate lung allocation rises to 21.1%, showing that growth can occur in a large named cancer group alongside the wider collection. Commercial bank breadth and depth within a particular indication are complementary advantages.
Lung, Breast, Colorectal, Pancreatic and Ovarian together hold the remaining 64.0% by tumour type.
Table 3: Tumour Type, 2026 Share
| Leading Share | 2026 market share |
|---|---|
| Other Solid Tumours | 36.0% |
| All Other Segments Combined Share | 64.0% |
Source: Future Market Insights analysis of the Patient-Derived xenograft models market, 2026.
Why does the Pharmaceutical and Biotechnology Companies segment lead by End User in the Patient-Derived Xenograft Models Market in 2026?
The Pharmaceutical and Biotechnology Companies segment holds 70.0% of the Patient-Derived Xenograft Models Market by end user in 2026.
Drug developers fund studies around decisions on candidates, combinations and patient subgroups. This gives them a different purchasing role from an academic group building a reusable research resource. The Certis and BIOEMTECH collaboration explicitly offers coordinated model access and imaging support to pharmaceutical sponsors, biotechnology companies and academic investigators. The market contains all three, but the sponsor's development programme generally creates the broader commercial commission in FMI's assessment. CRO study services that purchase such models are covered in FMI's oncology in vivo CRO market.
Pharmaceutical and Biotechnology Companies rise to a 73.3% share and USD 799.0 million in 2036. Academic and Research Institutes remain important to model creation, even as their commercial spending share falls to 9.5%. Resource creation and purchase expenditure should therefore be distinguished. An academic collection can enable later commercial work and generate less service revenue itself.
The Contract Research Organizations allocation also requires care. A sponsor may commission a CRO that purchases access from another provider. Market revenue should follow the defined transaction scope and avoid adding the same pass-through value twice. Labcorp pairs a PDX portfolio with biomarker testing and clinical-trial laboratory support, so its revenue needs the same boundary. The same boundary applies to the wider oncology molecular diagnostics market.
Contract Research Organizations and Academic and Research Institutes together hold the remaining 30.0% by end user.
Table 4: End User, 2026 Share
| Leading Share | 2026 market share |
|---|---|
| Pharmaceutical and Biotechnology Companies | 70.0% |
| All Other Segments Combined Share | 30.0% |
Source: Future Market Insights analysis of the Patient-Derived xenograft models market, 2026.
What are the key drivers restraints and opportunities?
Treatment-specific model selection and more extensive characterization support revenue growth. Biological variability and preparation time constrain delivery. Integrated model, analytical and imaging services provide an opening for suppliers with complementary capabilities.
Driver
Sponsors need evidence from models with treatment histories and molecular attributes relevant to the candidate under review. Documented resistance collections support these more specific commissions.
Restraint
NCI documents slow-growing material and substantial differences in tumour content, which complicate schedules and interpretation.
Opportunity
Model providers can coordinate specialist readouts with partner facilities. The BIOEMTECH agreement demonstrates this route for radiopharmaceutical research.
How do purchasing rules and qualification affect Patient-Derived xenograft models market demand?
The opportunity expands when sponsors commission evidence for a defined unresolved question. A next-generation oncology candidate may need comparison across treatment-exposed subgroups. A broad unselected panel may leave that question unanswered even if it produces a large report. Champions Oncology's published offering emphasizes treatment history and linked molecular information within its patient-derived bank. FMI expects these attributes to support repeat commissions when the same programme advances from initial screening to a narrower hypothesis.
Collections differ in what they count and which models are available for a particular commission. Charles River describes a portfolio above 1,700 PDX models, spanning solid and other cancer indications. That is evidence of portfolio breadth. The commercial opportunity still depends on whether the relevant material and associated information meet the buyer's purpose.
What limits reliable Patient-Derived xenograft models market supply and quality?
Time and interpretability are linked risks. The NCI's July 2026 information warns that some models grow slowly and that human tumour content varies. A provider needs a credible plan for a model that cannot be supplied or produces material unsuitable for the agreed analysis. These issues can affect a commission before the investigational product's activity is considered.
Regulatory change adds a separate pressure. FDA's April 2026 report describes progress toward validated alternatives in preclinical safety assessment. Nevertheless, sponsors have more reason to specify why an animal study is necessary and which complementary methods address other questions. Providers selling an undifferentiated package risk losing work to more selective programmes.
Where can suppliers win additional business in the Patient-Derived xenograft models market?
The commercial opening is a coordinated programme that preserves the relationship between model selection and the sponsor's decision. Crown offers matched PDX-derived organoid and in vivo platforms. The adjacent organoids market therefore represents both a competing screening route and a possible complement. Revenue from a stand-alone organoid assay sits outside this PDX valuation, except where the defined related service includes it.
Specialized imaging creates another opportunity. The May 2026 collaboration links the models to BIOEMTECH's radiopharmaceutical facilities. This arrangement shows how a model bank can access a capability it does not own. A supplier can widen its offer through a carefully defined partnership. The buyer's benefit depends on coordinated responsibility for the final evidence package.
Patient-Derived Xenograft Models Market by Country (2026 to 2036)
Table 5: Patient-Derived Xenograft Models Market Country Growth Forecast
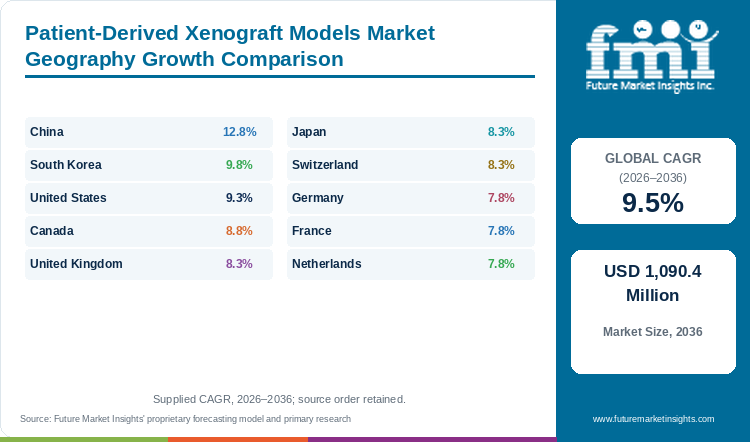
| Country | CAGR, 2026 to 2036 |
|---|---|
| China | 12.8% |
| South Korea | 9.8% |
| United States | 9.3% |
| Canada | 8.8% |
| United Kingdom | 8.3% |
| Japan | 8.3% |
| Switzerland | 8.3% |
| Germany | 7.8% |
| France | 7.8% |
| Netherlands | 7.8% |
Source: Future Market Insights analysis of the Patient-Derived xenograft models market, 2026.
China
China's commercial position includes extensive oncology model services with linked characterization. WuXi's current in vivo oncology portfolio describes PDX coverage across 28 cancer types and a collection above 1,400 models. Its offering includes drug-resistant material and related derivative platforms. These are vendor-reported capabilities across a wider oncology portfolio. They support the existence of a substantial service base.
China grows at a 12.8% CAGR between 2026 and 2036 in FMI's outlook. Revenue rises from USD 52.8 million to USD 176.2 million. Its revenue share consequently expands from 12.0% to 16.2%. The commercial interpretation is greater weight in the global service mix. Revenue in China climbs by USD 123.4 million, second among the ten. Revenue in China multiplies 3.3 times by 2036, compared with 2.5 times worldwide. The gain of USD 123.4 million equals 19.0% of the global increase of USD 650.4 million.
For a sponsor, the location of tissue, study execution and final analysis can be distinct contractual considerations. Crown's September 2025 US expansion announcement explicitly identified emerging Chinese human-genetic-resource export guidance among the factors affecting its platform strategy. That company statement supports attention to project location. Providers serving international programmes need clarity on the permitted use and movement of each resource. A well-annotated domestic collection has greater commercial value when the proposed work can be executed within a clearly defined access arrangement.
South Korea
Asan Medical Center's APEX service presents a clinically annotated model offer. Its patient-derived portfolio lists several solid-tumour groups, including gastric, liver, lung and pancreatic cancers. The service description associates selected panels with genomic information or prior response data. This supports a commercial argument for disease-specific interpretation.
South Korean revenue is expected to grow at a 9.8% CAGR from 2026 to 2036. FMI forecasts an increase from USD 17.6 million to USD 44.9 million. The rate exceeds that of several mature European country allocations. In commercial terms, a clinically connected service base can create opportunities for studies that require more detailed matching of the model to a development question. The amount spent depends on commissioned work. Global revenue share for South Korea increases from 4.0% to 4.1%. South Korea contributes USD 27.3 million of new revenue, fifth of ten. The gain of USD 27.3 million equals 4.2% of the global increase of USD 650.4 million.
The APEX offer also includes organoids and patient specimens alongside PDX services. This breadth allows a project to consider different experimental resources. It makes scope discipline necessary when pricing or reviewing a programme. A tissue procurement contract and a completed in vivo study generate different deliverables. Providers can improve the clarity of their offer by showing which clinical information accompanies each model and which additional analyses form part of the commission.
United States
US buyers have access to both commercial study organizations and a publicly supported model repository. This makes evidence quality a more useful differentiator than simple model availability. NCI's Patient-Derived Models Repository publishes release criteria covering identity, pathology and molecular information. Its July 2026 update also states the limitations of slow growth and variation in tumour content. Those disclosures give sponsors a basis for asking more precise questions of a commercial provider. A project needs a model whose recorded attributes fit its intended analysis, together with a deliverable that retains those qualifications.
FMI projects a 9.3% CAGR from 2026 to 2036, taking US revenue from USD 202.4 million to USD 493.1 million. The country remains the largest revenue allocation. Expansion of local study capacity supports this position. Crown announced its North Carolina model-development centre in September 2025, including PDX and related patient-derived platforms. The announcement supports an investment in domestic access. The United States grows at 9.3% a year, 0.2 points slower than the global rate.
The purchasing environment also contains a strong challenge to unnecessary animal work. FDA's April 2026 progress report concerns modernization of safety assessment. For PDX providers, the relevant response is a clear explanation of the efficacy question being commissioned. US suppliers can defend higher-value work through appropriate model selection and interpretation. Broad claims of clinical prediction should remain separate from demonstrated performance for a particular programme.
Canada
Canada has an important institutional route to PDX access through the Princess Margaret Living Biobank. Its current service description includes model establishment, clinical annotation, contracted projects and distribution. The published PDX core table reports more than 862 models across its listed tumour groups. The collection figure describes an institutional resource.
The biobank also explains why resources and processes are being brought together: establishment, experimentation and quality control are costly. For a buyer, a shared resource can make a relevant model accessible and avoid building a new collection. Commercial work can then focus on the additional question or readout the programme needs. A service provider has a stronger case when it complements the repository's capabilities and preserves the link to the associated clinical information.
Canada grows from USD 13.2 million in 2026 to USD 30.7 million in 2036 in FMI's assessment. The forecast CAGR for 2026 to 2036 is 8.8%. Continued demand also depends on commissions beyond model licences. The institutional offer already combines access with turnkey and contracted work. Suppliers competing around this base need a clear allocation of responsibilities, permitted use and analytical outputs. The potential for repeat commissions comes from useful evidence within a continuing research programme. Canada adds USD 17.5 million over the decade. Global revenue share for Canada decreases from 3.0% to 2.8%.
United Kingdom
British research links patient-derived models with the interpretation of treatment response. A 2025 Cancer Research study involving Cambridge and the Institute of Cancer Research examined drug responses and evolutionary dynamics in triple-negative breast-cancer xenografts. This is evidence of a specific translational research application. Its commercial relevance lies in the need to connect an experimental result with a defined biological and patient context.
The Manchester Cancer Biomarker Centre describes preclinical work based predominantly on PDX and circulating-tumour-cell-derived models. Its institutional account places these alongside tissue, molecular and digital biomarker capabilities. That combination supports demand for projects in which the analytical work matters as much as the tumour's broad diagnosis. A prospective supplier needs to show which recorded attributes are relevant to the sponsor's question and not offer a generic list of available indications.
UK revenue is forecast at USD 26.4 million in 2026 and USD 58.7 million in 2036. The implied 2026 to 2036 CAGR is 8.3% in FMI's outlook. This expansion sits within a market where specialist scientific networks can influence the choice of models and study partners. The opportunity for a service provider is to complement those networks with dependable project delivery and compatible information. Academic discovery becomes an outsourced contract only when a sponsor commissions work, so commercial forecasts follow contracts and not publication volume. Growth of USD 32.3 million leaves the United Kingdom third among the ten named countries.
Japan
Japan's national J-PDX initiative makes the difference between donated material and usable models particularly visible. The National Cancer Center reports 2,396 registrations and 741 engrafted models as of December 2025. It also announced 26 additions to the library in that month. These figures describe stages in a resource programme. A registered specimen and a model available for a proposed project represent different forms of supply.
The J-PDX catalogue provides a route to search stored material in detail. For a sponsor, an established national resource can improve the ability to locate models related to its target population. Commercial providers still need to define the additional work surrounding access. Interpretation of a molecular subgroup, project execution and related characterization may sit in separate service arrangements. The purchasing decision therefore concerns the complete route from a relevant resource to the evidence needed for the programme.
Revenue in Japan rises from USD 22.0 million in 2026 to USD 48.9 million by 2036 in FMI's forecast. The CAGR is 8.3% for 2026 to 2036. Growth is consistent with continuing demand for commercially supported work around patient-derived resources. Suppliers with a clear explanation of model provenance and permitted access can compete for work that extends beyond a simple catalogue search. Japan's share of global revenue eases from 5.0% to 4.5%. Japan records a USD 26.9 million increase, sixth of the ten.
Switzerland
Swiss demand includes programmes that compare patient-derived systems across a disease's molecular features. The University of Bern's Kruithof-de Julio laboratory describes work involving prostate-cancer xenografts, organoids and ex vivo tissue slices. Its project account includes molecular and functional characterization of patient-derived material. This institutional example supports a need for coordinated evidence across related systems.
A service provider entering such a programme needs a precise role. The sponsor may already have access to suitable tissue or established derivatives. Additional value can come from a defined characterization package or an experimental comparison beyond the existing network. The main purchasing question becomes whether results from the different components can be interpreted together. An unrelated panel at a lower unit price answers a different research question.
FMI forecasts Switzerland's market at USD 13.2 million in 2026 and USD 29.3 million by 2036, with an 8.3% CAGR during 2026 to 2036. The outlook represents a relatively small national allocation within a global service market. Cross-border collaboration can connect Swiss projects with model banks elsewhere, but the location of the study and the rights to the material remain relevant to the contract. Supplier proposals should identify those arrangements explicitly. Scientific collaboration provides a route to a programme, while the specified deliverable determines its commercial scope. Over the decade, revenue in Switzerland grows 2.2 times and the global total 2.5 times.
Germany
Germany illustrates the importance of comparing related model systems within the same clinical research programme. Göttingen's pancreatic-cancer consortium describes a translational platform containing PDX models, PDX-derived cells and patient-derived organoids. The platform connects molecular characterization with clinical material from its pancreatic programme and molecular tumour board. Its value for this market is the relationship among the original specimen, the experimental derivative and the information used to interpret it.
A buyer using such resources may need a service provider to contribute a specific analytical or execution capability. Owning a large tumour bank is less persuasive when a local group already holds material closely matched to its research question. The commercial task is to show what additional work the proposed commission delivers. Shared access also creates a need for clear responsibilities around interpretation and the return of results to the collaborating programme.
FMI forecasts German revenue growth from USD 26.4 million in 2026 to USD 56.0 million in 2036, at a 7.8% CAGR over 2026 to 2036. This is a measured expansion within the wider global outlook. Suppliers can build a position through specialized work around existing research infrastructure. They should distinguish PDX services from the related organoid and cell-based activities in a combined project. Germany posts 7.8% annual growth against 9.5% for the global market, 1.7 points below the global rate. In the Patient-Derived xenograft models market, Germany ranks joint third of ten on 2026 revenue.
France
French suppliers compete through distinct histories of model development and disease specialization. XenTech identifies breast-cancer panels that include models originating from Institut Curie and describes resistance-related collections associated with Gustave Roussy's MATCH-R programme. These relationships are relevant to a buyer seeking material with a particular treatment context. The commercial asset is the characterized collection and the relevant knowledge retained around it.
Oncodesign Services offers a separate oncology portfolio. Its current description identifies more than 200 unique tumours across 19 indications and characterization covering histology, gene features and response to standard treatments. This creates a service proposition built around both material and interpretation. Indication breadth and the attributes of the available subgroup are more useful purchasing criteria.
FMI estimates France at USD 17.6 million in 2026 and USD 37.4 million in 2036. A 7.8% CAGR from 2026 to 2036 reflects continued commercial activity around this specialist base. Buyers can choose a narrow disease-focused partner or a provider with a broader preclinical offer. The decision depends on the programme's evidence requirement and access conditions. For suppliers, maintaining an informative collection can be more commercially useful than adding models whose treatment context is poorly documented. The opportunity remains tied to the quality of the specific commission. In the Patient-Derived xenograft models market, France adds USD 19.8 million, ranking seventh for increase. France's slice of global revenue goes from 4.0% to 3.4%.
Netherlands
The Netherlands Cancer Institute's Mouse Cancer Clinic links cancer models with preclinical intervention, imaging and pharmacology. Its institutional description includes human xenografts alongside other mouse model classes. It also identifies collaboration with a pharmacology unit to assess whether a compound reaches its target in meaningful quantities. This infrastructure extends beyond PDX. Its relevance to this market lies in the ability to combine a tumour-model commission with measurements needed to interpret the result.
That combination changes the supplier comparison. A model's molecular features may fit the intended target, but the programme can still require evidence about exposure or distribution. A contract covering only tumour response leaves part of the question open. The opportunity for a commercial partner is to deliver an appropriately connected measurement package.
FMI forecasts Dutch revenue of USD 8.8 million in 2026 and USD 18.7 million in 2036. The market expands at a 7.8% CAGR from 2026 to 2036. This is the smallest of the ten named country allocations. Its scientific infrastructure can still influence internationally collaborative programmes. Commercial scale and scientific relevance therefore need separate interpretation. Providers serving Dutch customers can compete through specialist project execution and well-defined links between model selection, pharmacology and final analysis. The contract should show which organization is accountable for each part of that evidence. The Netherlands' slice of global revenue goes from 2.0% to 1.7%.
Who are the notable companies in the Patient-Derived Xenograft Models Market?
Notable companies in the Patient-Derived Xenograft Models Market include Charles River Laboratories, The Jackson Laboratory, Crown Bioscience, WuXi AppTec and Champions Oncology.
The commercial comparison is between portfolios with different origins and service boundaries. Charles River Laboratories combines a broad model offer with conducted studies. The Jackson Laboratory supplies material as well as research services under defined access terms. Crown Bioscience emphasizes matched patient-derived platforms, while Champions Oncology describes a bank with substantial treatment-exposed material. These distinctions are more informative than assigning unsupported numerical shares to the companies.
WuXi AppTec's oncology offering includes PDX models and related pharmacology capabilities. Inotiv identifies PDX options for breast cancer and melanoma within its wider oncology resource offer. Certis Oncology Solutions links its model platform with specialized partners, as demonstrated by the 2026 BIOEMTECH agreement. XenTech and Oncodesign Services have documented disease-model collections and translational study services. A sponsor may choose among them according to its indication and evidence requirement, instead of assume every supplier offers an identical panel.
Labcorp Drug Development combines a PDX portfolio of more than 300 models developed over the last seven years with biomarker testing and clinical-trial laboratory support. Only the PDX-related work belongs in this market's revenue, and the testing and trial services sit outside it. Ownership also requires care: Adicon's September 2026 disclosure continued to describe its proposed Crown acquisition as conditional.
Key Developments in the Patient-Derived Xenograft Models Market
- In May 2026, Certis Oncology Solutions and BIOEMTECH announced a collaboration providing PDX access for radiopharmaceutical preclinical studies at BIOEMTECH facilities. The release stated that collaborative studies would begin immediately, with availability coordinated by project.
- In September 2026, Adicon disclosed that regulatory approvals for its proposed Crown Bioscience acquisition had not yet been obtained. The transaction's outside date was extended to 13 November 2026. This remained a conditional acquisition in that disclosure.
Key Players in the Patient-Derived Xenograft Models Market
- Charles River Laboratories
- The Jackson Laboratory
- Crown Bioscience
- WuXi AppTec
- Champions Oncology
- Inotiv
- Labcorp Drug Development
- Certis Oncology Solutions
- XenTech
- Oncodesign Services
Patient-Derived Xenograft Models Market Report Scope
Table 6: Patient-Derived Xenograft Models Market Report Scope
| Coverage field | Report scope |
|---|---|
| Market definition | Patient-derived tumour models in immunodeficient mice, commercial model access, efficacy studies and related PDX characterization services for oncology development. |
| Tumour boundary | Solid-tumour categories: Lung, Breast, Colorectal, Pancreatic, Ovarian and Other Solid Tumours. Broader supplier blood-cancer portfolios are not assumed to enter these allocations. |
| Revenue units | USD million. |
| Activity and realization | Annual studies. Average 2026 realization in USD per study. These are separate from animal, donor and banked-model counts. |
| Offering coverage | Efficacy and Pharmacology Studies. Model Licensing and Banked Models. Biomarker and Genomic Characterization. |
| End users | Pharmaceutical and Biotechnology Companies. Contract Research Organizations. Academic and Research Institutes. |
| Named countries | United States, China, United Kingdom, Germany, Japan, France, South Korea, Switzerland, Canada and Netherlands |
| Participant coverage | Charles River Laboratories, The Jackson Laboratory, Crown Bioscience, WuXi AppTec, Champions Oncology, Inotiv, Labcorp Drug Development, Certis Oncology Solutions, XenTech and Oncodesign Services. |
| Exclusions | Stand-alone clinical diagnostics, general animal supply, unrelated cell-line models, separate imaging equipment, and organoid services without an in-scope PDX connection. |
| Quantitative Units | USD million |
Source: Future Market Insights analysis of the Patient-Derived xenograft models market, 2026.
Patient-Derived Xenograft Models Market Research Methodology
The assessment combines FMI's quantitative outlook with secondary review of original provider materials, institutional model resources and regulatory or transaction disclosures. Numerical checks compare revenue, offering and country allocations within the stated scope. Competitive analysis distinguishes documented PDX services from adjacent platforms and preserves the status of announced developments. Study activity, banked models and patient donations remain separate measures.
Patient-Derived Xenograft Models Market by Segments
Patient-Derived Xenograft Models Market segmented by Offering:
- Efficacy and Pharmacology Studies
- Model Licensing and Banked Models
- Biomarker and Genomic Characterization
Patient-Derived Xenograft Models Market segmented by Tumour Type:
- Lung
- Breast
- Colorectal
- Pancreatic
- Ovarian
- Other Solid Tumours
Patient-Derived Xenograft Models Market segmented by End User:
- Pharmaceutical and Biotechnology Companies
- Contract Research Organizations
- Academic and Research Institutes
Patient-Derived Xenograft Models Market by Region
- North America
- United States
- Canada
- Western Europe
- United Kingdom
- Germany
- France
- Switzerland
- Netherlands
- East Asia
- China
- Japan
- South Korea
- Rest of world
Research Sources and Bibliography
- Adicon Holdings Limited. (2026, September 30). Major acquisition: extension of the outside date for the proposed acquisition of Crown Bioscience International.
- Asan Preclinical Evaluation Center for Cancer Therapeutics. (Accessed 2026, November 9). Patient-Derived Models and Services. https://enapex.amc.seoul.kr/bbs/page.php?hid=service4
- Certis Oncology Solutions. (2026, May 7). BIOEMTECH and Certis Oncology Announce Partnership to Provide PDX Models for Radiopharmaceutical Preclinical Studies.
- Cancer Research UK Manchester Centre. (Accessed 2026, November 9). Cancer Biomarkers. https://www.crukcentre.manchester.ac.uk/research/research-themes/cancer-biomarkers/
- Charles River Laboratories. (Accessed 2026, November 9). Patient-Derived Xenograft Models. https://www.criver.com/products-services/discovery-services/pharmacology-studies/oncology-immuno-oncology-studies/oncology-study-models/patient-derived-xenografts-pdx-models
- Champions Oncology. (Accessed 2026, November 9). Global Oncology CRO Services and Patient-Derived Tumor Bank. https://www.championsoncology.com/
- Crown Bioscience. (2025, September 17). Crown Bioscience Expands US Presence with New Model Development Center in Kannapolis, North Carolina.
- Crown Bioscience. (Accessed 2026, November 9). Why PDX Models Matter. https://www.crownbio.com/pdx-models
- Inotiv. (Accessed 2026, November 9). Oncology Research Models and Services. https://www.inotiv.com/oncology
- The Jackson Laboratory. (Accessed 2026, November 9). PDX Models and Studies, including PDX Terms and Conditions. https://www.jax.org/jax-mice-and-services/preclinical-research-services/oncology-services/pdx-tumors
- Labcorp. (Accessed 2026, November 9). Advance Precision Oncology Drug Discovery. https://www.labcorp.com/oncology/biopharma
- Labcorp. (Accessed 2026, November 9). Modèles de xénogreffes dérivées de patients (PDX). https://www.labcorp.com/fr/biopharma/nonclinical/therapeutics/oncology/tumor-models/subcutaneous/patient-derived-xenograft
- National Cancer Center Japan. (December 2025 resource figures; accessed 2026, November 9). J-PDX Library. https://j-pdx.ncc.go.jp/en/
- National Cancer Institute. (2026, July 28 update). PDMR Models: Quality Control, Sequencing Information and Limitations. https://dctd.cancer.gov/drug-discovery-development/reagents-materials/pdmr/models
- Netherlands Cancer Institute. (Accessed 2026, November 9). Animal Facility: Mouse Cancer Clinic. https://www.nki.nl/research/facilities-platforms/laboratory-animal-center/animal-facility-mouse-cancer-clinic/
- Oncodesign Services. (Accessed 2026, November 9). Oncology CRO Services, including Patient-Derived Xenografts. https://www.oncodesign-services.com/oncology/
- Shea, A., et al. (2025). Modeling Drug Responses and Evolutionary Dynamics Using Patient-Derived Xenografts Reveals Precision Medicine Strategies for Triple-Negative Breast Cancer. Cancer Research, 85(3), 567–584. DOI: 10.1158/0008-5472.CAN-24-1703. https://pubmed.ncbi.nlm.nih.gov/39514406/
- Universitätsmedizin Göttingen. (Accessed 2026, November 9). CRU 5002 Projects: Translational Platform for PDAC Models and Drug Response Validation. https://gccc.umg.eu/en/cru-5002/projects-cru/
- University Health Network. (Accessed 2026, November 9). Princess Margaret Living Biobank: PDX Core and Services. https://pmlivingbiobank.uhnresearch.ca/
- University of Bern, Department for BioMedical Research. (Accessed 2026, November 9). Kruithof-de Julio Laboratory: Ongoing Projects. https://www.dbmr.unibe.ch/research/research_programs/kruithof_de_julio_lab/ongoing_projects/index_eng.html
- US Food and Drug Administration. (2026, April 20). FDA Achieves Year 1 Goals in Reducing Animal Testing in Drug Development.
- WuXi Biology and Testing. (Accessed 2026, November 9). In Vivo Oncology Models. https://www.wuxibiologyandtesting.com/services/discovery-biology/disease-models/in-vivo/oncology/
- XenTech. (Accessed 2026, November 9). PDX Models and Collections. https://www.xentech.eu/models/human-pdx/
Table of Content
- Key Takeaways
- Market Size and CAGR
- Top Growth Driver
- Fastest Growing Segment
- Leading Region
- Key Companies
- Emerging Opportunities
- Executive Summary
- Global Market Outlook
- Demand-side Trends
- Supply-side Trends
- Technology Roadmap Analysis
- Analysis and Recommendations
- Analyst Perspective (What is happening? Why now? What should investors know?)
- Key Questions Answered
- How large is the market?
- What is the CAGR?
- What are key trends?
- Which region dominates?
- Who are the leaders?
Read More...
- Market Overview
- Market Coverage / Taxonomy
- Market Definition / Scope / Limitations
- Research Methodology
- Chapter Orientation
- Analytical Lens and Working Hypotheses
- Market Structure, Signals, and Trend Drivers
- Benchmarking and Cross-market Comparability
- Market Sizing, Forecasting, and Opportunity Mapping
- Research Design and Evidence Framework
- Desk Research Programme (Secondary Evidence)
- Expert Input and Fieldwork (Primary Evidence)
- Tooling, Models, and Reference Databases
- Data Engineering and Model Build
- Quality Assurance and Audit Trail
- Market Background
- Market Dynamics (Drivers, Restraints, Opportunity, Trends)
- Scenario Forecast (Optimistic, Likely, Conservative)
- Impact Analysis
- AI Impact
- Sustainability Impact
- Regulatory Impact
- Technology Impact
- Consumer / Buyer Analysis
- Purchase Drivers
- Adoption Barriers
- Buyer Journey
- Opportunity Map Analysis
- Product Life Cycle Analysis
- Supply Chain Analysis
- Investment Feasibility Matrix
- Value Chain Analysis
- PESTLE and Porter's Analysis
- Regulatory Landscape
- Regional Parent Market Outlook
- Production and Consumption Statistics
- Import and Export Statistics
- Global Market Analysis and Forecast, 2021 to 2036
- Historical Market Size Value (USD Million) Analysis, 2021 to 2025
- Current and Future Market Size Value (USD Million) Projections, 2026 to 2036
- Y-o-Y Growth Trend Analysis
- Absolute $ Opportunity Analysis
- Global Market Pricing Analysis, 2021 to 2036
- Global Market Analysis and Forecast, By Offering, 2021 to 2036
- Introduction / Key Findings
- Historical Market Size Value (USD Million) Analysis By Offering, 2021 to 2025
- Current and Future Market Size Value (USD Million) Analysis and Forecast By Offering, 2026 to 2036
- Efficacy and Pharmacology Studies
- Model Licensing and Banked Models
- Biomarker and Genomic Characterization
- Y-o-Y Growth Trend Analysis By Offering, 2021 to 2025
- Absolute $ Opportunity Analysis By Offering, 2026 to 2036
- Global Market Analysis and Forecast, By Tumour Type, 2021 to 2036
- Introduction / Key Findings
- Historical Market Size Value (USD Million) Analysis By Tumour Type, 2021 to 2025
- Current and Future Market Size Value (USD Million) Analysis and Forecast By Tumour Type, 2026 to 2036
- Lung
- Breast
- Colorectal
- Pancreatic
- Ovarian
- Other Solid Tumours
- Y-o-Y Growth Trend Analysis By Tumour Type, 2021 to 2025
- Absolute $ Opportunity Analysis By Tumour Type, 2026 to 2036
- Global Market Analysis and Forecast, By End User, 2021 to 2036
- Introduction / Key Findings
- Historical Market Size Value (USD Million) Analysis By End User, 2021 to 2025
- Current and Future Market Size Value (USD Million) Analysis and Forecast By End User, 2026 to 2036
- Pharmaceutical and Biotechnology Companies
- Contract Research Organizations
- Academic and Research Institutes
- Y-o-Y Growth Trend Analysis By End User, 2021 to 2025
- Absolute $ Opportunity Analysis By End User, 2026 to 2036
- Global Market Analysis and Forecast, By Region, 2021 to 2036
- Introduction
- Historical Market Size Value (USD Million) Analysis By Region, 2021 to 2025
- Current Market Size Value (USD Million) Analysis and Forecast By Region, 2026 to 2036
- North America
- Western Europe
- East Asia
- Market Attractiveness Analysis By Region
- North America Market Analysis and Forecast, By Country, 2021 to 2036
- Historical Market Size Value (USD Million) Trend Analysis By Market Taxonomy, 2021 to 2025
- Market Size Value (USD Million) Forecast By Market Taxonomy, 2026 to 2036
- By Country
- United States
- Canada
- By Offering
- By Tumour Type
- By End User
- By Country
- Market Attractiveness Analysis
- By Country
- By Offering
- By Tumour Type
- By End User
- Key Takeaways
- Western Europe Market Analysis and Forecast, By Country
- Historical Market Size Value (USD Million) Trend Analysis By Market Taxonomy, 2021 to 2025
- Market Size Value (USD Million) Forecast By Market Taxonomy, 2026 to 2036
- By Country
- United Kingdom
- Germany
- France
- Switzerland
- Netherlands
- By Offering
- By Tumour Type
- By End User
- By Country
- Market Attractiveness Analysis
- By Country
- By Offering
- By Tumour Type
- By End User
- Key Takeaways
- East Asia Market Analysis and Forecast, By Country
- Historical Market Size Value (USD Million) Trend Analysis By Market Taxonomy, 2021 to 2025
- Market Size Value (USD Million) Forecast By Market Taxonomy, 2026 to 2036
- By Country
- China
- Japan
- South Korea
- Rest of world
- By Offering
- By Tumour Type
- By End User
- By Country
- Market Attractiveness Analysis
- By Country
- By Offering
- By Tumour Type
- By End User
- Key Takeaways
- Key Countries Market Analysis
- United States
- Pricing Analysis
- Market Share Analysis, 2025
- By Offering
- By Tumour Type
- By End User
- Canada
- Pricing Analysis
- Market Share Analysis, 2025
- By Offering
- By Tumour Type
- By End User
- Germany
- Pricing Analysis
- Market Share Analysis, 2025
- By Offering
- By Tumour Type
- By End User
- United Kingdom
- Pricing Analysis
- Market Share Analysis, 2025
- By Offering
- By Tumour Type
- By End User
- France
- Pricing Analysis
- Market Share Analysis, 2025
- By Offering
- By Tumour Type
- By End User
- China
- Pricing Analysis
- Market Share Analysis, 2025
- By Offering
- By Tumour Type
- By End User
- Japan
- Pricing Analysis
- Market Share Analysis, 2025
- By Offering
- By Tumour Type
- By End User
- South Korea
- Pricing Analysis
- Market Share Analysis, 2025
- By Offering
- By Tumour Type
- By End User
- Switzerland
- Pricing Analysis
- Market Share Analysis, 2025
- By Offering
- By Tumour Type
- By End User
- Netherlands
- Pricing Analysis
- Market Share Analysis, 2025
- By Offering
- By Tumour Type
- By End User
- United States
- Market Structure Analysis
- Competition Dashboard
- Competition Benchmarking
- Market Share Analysis of Top Players
- By Regional
- By Offering
- By Tumour Type
- By End User
- Emerging Startups
- Innovation Benchmarking
- Competition Analysis
- Competition Deep Dive
- Charles River Laboratories
- Overview
- Product Portfolio
- Profitability by Market Segments
- Sales Footprint
- Strategy Overview
- Marketing Strategy
- Product Strategy
- Channel Strategy
- The Jackson Laboratory
- Crown Bioscience
- WuXi AppTec
- Champions Oncology
- Inotiv
- Labcorp Drug Development
- Certis Oncology Solutions
- XenTech
- Oncodesign Services
- Charles River Laboratories
- Case Studies
- Success Stories
- Recent Developments
- Competition Deep Dive
- Assumptions & Acronyms Used
List of Tables
- Table 1: Global Market Value (USD Million) Forecast by Region, 2021 to 2036
- Table 2: Global Market Value (USD Million) Forecast by Offering, 2021 to 2036
- Table 3: Global Market Value (USD Million) Forecast by Tumour Type, 2021 to 2036
- Table 4: Global Market Value (USD Million) Forecast by End User, 2021 to 2036
- Table 5: North America Market Value (USD Million) Forecast by Country, 2021 to 2036
- Table 6: North America Market Value (USD Million) Forecast by Offering, 2021 to 2036
- Table 7: North America Market Value (USD Million) Forecast by Tumour Type, 2021 to 2036
- Table 8: North America Market Value (USD Million) Forecast by End User, 2021 to 2036
- Table 9: Western Europe Market Value (USD Million) Forecast by Country, 2021 to 2036
- Table 10: Western Europe Market Value (USD Million) Forecast by Offering, 2021 to 2036
- Table 11: Western Europe Market Value (USD Million) Forecast by Tumour Type, 2021 to 2036
- Table 12: Western Europe Market Value (USD Million) Forecast by End User, 2021 to 2036
- Table 13: East Asia Market Value (USD Million) Forecast by Country, 2021 to 2036
- Table 14: East Asia Market Value (USD Million) Forecast by Offering, 2021 to 2036
- Table 15: East Asia Market Value (USD Million) Forecast by Tumour Type, 2021 to 2036
- Table 16: East Asia Market Value (USD Million) Forecast by End User, 2021 to 2036
List of Figures
- Figure 1: Global Market Pricing Analysis
- Figure 2: Global Market Value (USD Million) Forecast 2021-2036
- Figure 3: Global Market Value Share and BPS Analysis by Offering, 2026 and 2036
- Figure 4: Global Market Y-o-Y Growth Comparison by Offering, 2026-2036
- Figure 5: Global Market Attractiveness Analysis by Offering
- Figure 6: Global Market Value Share and BPS Analysis by Tumour Type, 2026 and 2036
- Figure 7: Global Market Y-o-Y Growth Comparison by Tumour Type, 2026-2036
- Figure 8: Global Market Attractiveness Analysis by Tumour Type
- Figure 9: Global Market Value Share and BPS Analysis by End User, 2026 and 2036
- Figure 10: Global Market Y-o-Y Growth Comparison by End User, 2026-2036
- Figure 11: Global Market Attractiveness Analysis by End User
- Figure 12: Global Market Value (USD Million) Share and BPS Analysis by Region, 2026 and 2036
- Figure 13: Global Market Y-o-Y Growth Comparison by Region, 2026-2036
- Figure 14: Global Market Attractiveness Analysis by Region
- Figure 15: North America Market Incremental Dollar Opportunity, 2026-2036
- Figure 16: Western Europe Market Incremental Dollar Opportunity, 2026-2036
- Figure 17: East Asia Market Incremental Dollar Opportunity, 2026-2036
- Figure 18: North America Market Value Share and BPS Analysis by Country, 2026 and 2036
- Figure 19: North America Market Value Share and BPS Analysis by Offering, 2026 and 2036
- Figure 20: North America Market Y-o-Y Growth Comparison by Offering, 2026-2036
- Figure 21: North America Market Attractiveness Analysis by Offering
- Figure 22: North America Market Value Share and BPS Analysis by Tumour Type, 2026 and 2036
- Figure 23: North America Market Y-o-Y Growth Comparison by Tumour Type, 2026-2036
- Figure 24: North America Market Attractiveness Analysis by Tumour Type
- Figure 25: North America Market Value Share and BPS Analysis by End User, 2026 and 2036
- Figure 26: North America Market Y-o-Y Growth Comparison by End User, 2026-2036
- Figure 27: North America Market Attractiveness Analysis by End User
- Figure 28: Western Europe Market Value Share and BPS Analysis by Country, 2026 and 2036
- Figure 29: Western Europe Market Value Share and BPS Analysis by Offering, 2026 and 2036
- Figure 30: Western Europe Market Y-o-Y Growth Comparison by Offering, 2026-2036
- Figure 31: Western Europe Market Attractiveness Analysis by Offering
- Figure 32: Western Europe Market Value Share and BPS Analysis by Tumour Type, 2026 and 2036
- Figure 33: Western Europe Market Y-o-Y Growth Comparison by Tumour Type, 2026-2036
- Figure 34: Western Europe Market Attractiveness Analysis by Tumour Type
- Figure 35: Western Europe Market Value Share and BPS Analysis by End User, 2026 and 2036
- Figure 36: Western Europe Market Y-o-Y Growth Comparison by End User, 2026-2036
- Figure 37: Western Europe Market Attractiveness Analysis by End User
- Figure 38: East Asia Market Value Share and BPS Analysis by Country, 2026 and 2036
- Figure 39: East Asia Market Value Share and BPS Analysis by Offering, 2026 and 2036
- Figure 40: East Asia Market Y-o-Y Growth Comparison by Offering, 2026-2036
- Figure 41: East Asia Market Attractiveness Analysis by Offering
- Figure 42: East Asia Market Value Share and BPS Analysis by Tumour Type, 2026 and 2036
- Figure 43: East Asia Market Y-o-Y Growth Comparison by Tumour Type, 2026-2036
- Figure 44: East Asia Market Attractiveness Analysis by Tumour Type
- Figure 45: East Asia Market Value Share and BPS Analysis by End User, 2026 and 2036
- Figure 46: East Asia Market Y-o-Y Growth Comparison by End User, 2026-2036
- Figure 47: East Asia Market Attractiveness Analysis by End User
- Figure 48: Global Market - Tier Structure Analysis
- Figure 49: Global Market - Company Share Analysis
Frequently Asked Questions
How big is the Patient-Derived xenograft models market in 2026?
FMI estimates the market at USD 440.0 million in 2026, up from USD 400.0 million in 2025. It is forecast to reach USD 1,090.4 million by 2036 at a 9.5% CAGR.
Which offering leads the Patient-Derived xenograft models market in 2026?
Efficacy and Pharmacology Studies leads by offering with 55.0% in 2026. All other segments together hold 45.0%.
Which tumour type and end user lead in 2026?
Other Solid Tumours holds 36.0% by tumour type and Pharmaceutical and Biotechnology Companies holds 70.0% by end user in FMI's 2026 assessment.
Which market is forecast to grow fastest through 2036?
China has the highest forecast CAGR at 12.8% during 2026 to 2036, followed by South Korea at 9.8%.
Does animal-reduction policy eliminate demand for PDX efficacy studies?
FDA's April 2026 report describes progress in reducing animal testing in preclinical safety evaluation.[1] It is not a blanket prohibition on PDX efficacy research. The study's scientific purpose and the relevance of complementary methods remain central to purchasing decisions.
Preview the report firsthand - request a free sample
Get SampleGet the brochure for pricing and purchase details.
Get PDF
