The Payment Processing Solutions Market is estimated to be valued at USD 120.0 billion in 2025 and is projected to reach USD 308.4 billion by 2035, registering a compound annual growth rate (CAGR) of 9.9% over the forecast period.
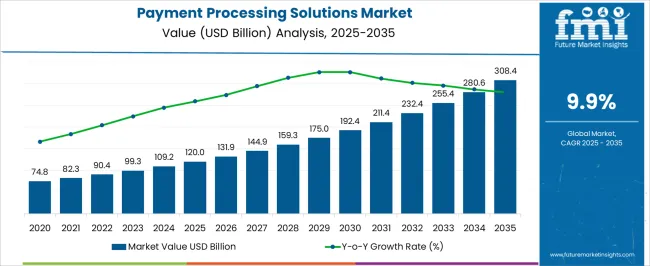
| Metric | Value |
|---|---|
| Payment Processing Solutions Market Estimated Value in (2025 E) | USD 120.0 billion |
| Payment Processing Solutions Market Forecast Value in (2035 F) | USD 308.4 billion |
| Forecast CAGR (2025 to 2035) | 9.9% |
The payment processing solutions market is undergoing significant transformation, supported by accelerated digital transactions, evolving consumer behavior, and the convergence of banking with real-time commerce. Increased global focus on cashless ecosystems, combined with rising e-commerce activity and contactless payment acceptance, has led businesses to adopt seamless, integrated payment technologies.
Enhanced cybersecurity frameworks, AI-driven fraud detection, and tokenization protocols are playing a critical role in maintaining trust and operational resilience. Additionally, flexible APIs, embedded payment architecture, and growing fintech collaborations have redefined transaction ecosystems across multiple sectors.
Forward momentum is expected to be driven by financial inclusion efforts, cross-border interoperability, and regulatory mandates on secure digital transactions, making the payment processing market a central enabler of modern commerce.
The market is segmented by Payment Method, Mode of Deployment, and Vertical and region. By Payment Method, the market is divided into Credit Card, E-Wallet, ACH, Other, and Debit Card. In terms of Mode of Deployment, the market is classified into Cloud-Based and On-Premises. Based on Vertical, the market is segmented into BFSI, Government and Utilities, Telecom and IT, Healthcare, Real Estate, Retail and E-Commerce, Media and Entertainment, Travel and Hospitality, and Other Verticals. Regionally, the market is classified into North America, Latin America, Western Europe, Eastern Europe, Balkan & Baltic Countries, Russia & Belarus, Central Asia, East Asia, South Asia & Pacific, and the Middle East & Africa.
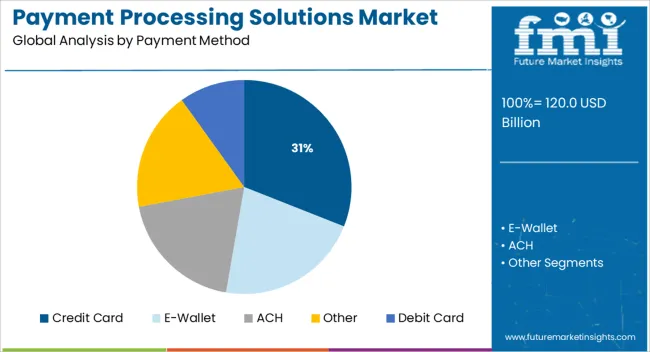
Credit card payments are projected to account for 31.0% of the total revenue share in the payment processing solutions market by 2025, making it the leading payment method. This dominance is being reinforced by widespread global card issuance, established infrastructure, and strong consumer trust in card-based transactions for both in-store and online purchases.
The adoption of EMV chip technology and PCI DSS compliance has enhanced transaction security, while the ability to integrate loyalty programs and dynamic spend controls has made credit cards attractive for both consumers and merchants.
Additionally, advancements in tokenization, biometric verification, and instant approvals have further strengthened the appeal of credit cards in the digital payments landscape.
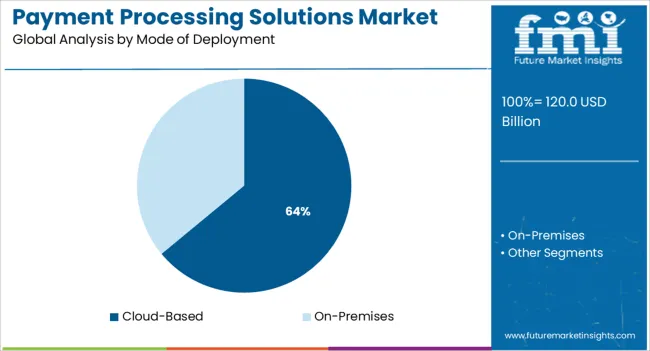
Cloud-based deployment is expected to contribute 64.0% of the revenue share in 2025, positioning it as the dominant mode of deployment in the payment processing solutions market. Its ascendancy is being driven by scalability, real-time processing capabilities, and lower upfront infrastructure costs compared to on-premise systems.
Cloud platforms enable continuous software updates, enhanced uptime, and quick integration with third-party fintech tools, which are essential for adapting to the fast-paced payments ecosystem. Enterprises are favoring cloud models for their agility in managing multi-channel transactions, fraud analytics, and user authentication.
As digital commerce expands and omnichannel experiences become the norm, cloud deployment is expected to remain critical for long-term payment processing innovation and resilience.
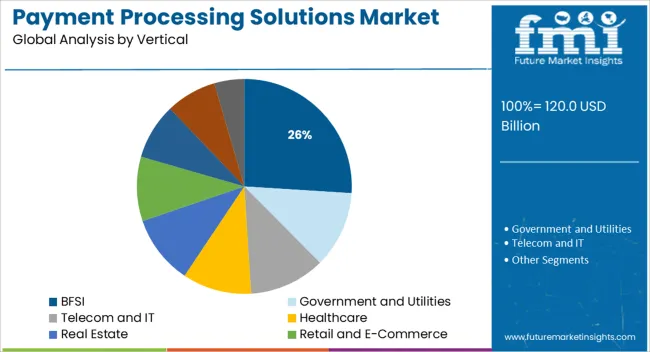
The BFSI sector is forecast to hold 26.0% of the market revenue share in 2025, emerging as the top vertical utilizing payment processing solutions. The segment’s leadership is supported by ongoing digitization of banking services, heightened demand for real-time fund transfers, and a growing need for regulatory compliance in transaction reporting.
Financial institutions are integrating advanced payment engines and automated reconciliation tools to improve speed, transparency, and auditability. Rising competition from fintech disruptors has pushed traditional BFSI players to modernize legacy systems and adopt APIs and embedded finance models.
Furthermore, the need to offer frictionless customer experiences across mobile, web, and branch channels is reinforcing continued investment in intelligent, secure payment processing platforms.
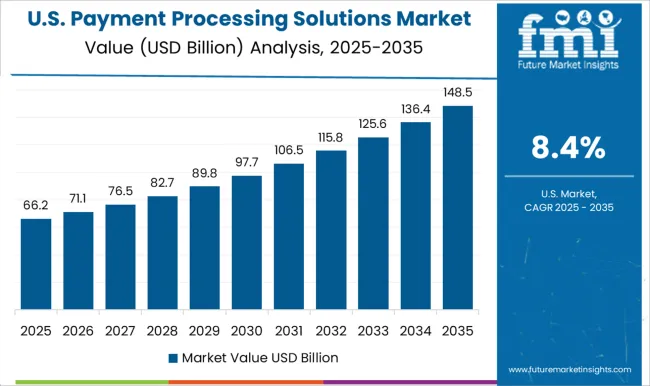
North America is expected to dominate the global market owing to the rapid technical development in the region. The rapid technological development and the growing popularity of online payment systems are expected to provide a significant boost to the market.
The government of the region takes various initiatives to enhance the efficiency of payment processing systems in the region. The growing partnerships among e-commerce companies are expected to augment the market significantly. Growing demand for safe and one-step payment methods is expected to boost the global payment processing solutions market in the forecast period. The increasing digitalization and high adoption rate of various money transfer modes such as; mobile wallets and net banking are expected to provide a significant boost to e-commerce services.
The payment processing solution market can be segmented into debit cards, credit cards, e-wallets, ACH, and others. According to FMI, the credit card segment is anticipated to expand at a CAGR of 9.3% from 2025 to 2035. With the increasing mobile payments and increasing penetration of the internet, especially in developing countries, e-Wallet and credit card segments are expected to gain significant traction in the forecast period.
The increasing application of smartphones and rising penetration of the internet across the globe have resulted in a rise in online payments, which is expected to benefit the payment processing solutions market during the forecast period. Various players and banking entities are developing mobile wallet applications for smartphones, triggering market growth.
Also, the growing demand to enhance the payment process and offer customers value-added services to maintain demand for digital processing is likely to benefit the market in the forthcoming period. In addition, the government of various countries is taking initiatives to encourage digital payments. For instance, the Indian government introduced the Unified Payments Interface (UPI) to ease digital payment across the country. Similarly, French National Cashless Payments Committee was established in 2020 to promote contactless payments.
With ongoing technological development, real-time payment solutions are advancing in various spheres, such as; banking. Various e-channels, third-party APIs, and wallets are being encouraged by banking entities. For instance, in March 2025, The Clearing House and Fiserv, Inc., a known financial services technology solution provider, announced a strategic collaboration.
Thousands of financial institutions will be able to perform real-time payments for consumers and businesses. In another instance, in October 2020, 13 financial enterprises and banks disclosed a collaboration on a new platform run by New Payments Platform Australia (NPP Australia). Owing to such initiatives, the real-time payment concept is likely to garner significant traction, thereby, benefitting the market in the forecast period.
Further, increasing interest in ‘request for pay’, a secure path for real-time payments, presents various avenues for major payment system changes. Established financial entities have already taken initiatives to launch Rfp applications.
For instance, USA Bank began providing Rfp facilities to corporate billers in the fall of 2024 and disclosed that small business customers and its consumers would be receiving Rfp messages through mail or text messages beginning in Q1 2025.
Faster payments and low fees are expected to impact the bank revenues positively, enhancing demand for Rfp, thus, fuelling the market growth in the forecast period. Using real-time payment with Rfp can reduce the merchant’s cost of accepting payment. The Fed’s real-time payment network, FedNow, is set to launch in 2025. It will provide new entrants and enterprises to escape various traditional payments, which means various largest USA banks are likely to lose massive interchange fees.
Even though strict procedures such as symmetric encryption and increased cloud security have been in function, yet, it is vulnerable to hackers’ incursion. Notorious hackers use phishing attack methods to have access to personal and financial information. In January 2024, Juspay, a payment service provider for online giants like Amazon, and Swiggy, admitted to a data breach that occurred in August 2024. The breach led to 3.5 crores of records with masked card numbers and personal data getting compromised.
Data theft and security risks appear to be higher for small businesses, with 42% of SMEs experiencing at least one cyber-attack every year. As per a recent study, about 83% of organizations in the APAC region do not consider cybersecurity while commencing a digital transformation project, making them susceptible to such attacks. Having limited funds and resources, the security measures taken by SMEs against such breaches are generally insufficient. Hackers find it easier to get access to the e-wallets of such SMEs and get away without being caught. This makes citizens reluctant to adopt e-payment services, thus, limiting the market growth in the forecast period.
As per Central Statistics Office (CSO), cyberattacks are likely to result in a loss of USD 6 trillion annually, as against USD 3 trillion in 2020. Moreover, Association for Financial Professionals (AFP) Payments Fraud and Control Survey Report 2020, globally, more than 81% of organizations have witnessed cyberattacks.
Governments and private-sector players acknowledge the importance of financial services for populations residing in rural and remote areas. There has been a rise in financial inclusion across the globe. Various developing countries such as; India, China, and others have taken initiatives to enhance financial inclusion, which is expected to benefit the market positively. As per the Reserve Bank of India report, India’s Financial Inclusion Index was 53.9 by the end of March 2024. The growing financial inclusion across developing countries is expected to benefit the market in the forecast period.
The launch of eWallet is likely to increase financial inclusion across the globe, thus, benefitting the market in the forecast period. In April 2025, the State-run Land Bank of the Philippines launched its own eWallet, called LandbankPay. It allows users to safely and easily pay bills, purchase online, and transfer funds. Such initiatives are likely to increase financial inclusion, thereby, offering remunerative opportunities to players in the forecast period.
Owing to various initiatives among developing countries to develop financially, there has been a significant rise in financial inclusion across the globe. As per World Bank, about 1.2 billion adults across the globe got access to bank accounts from 2011 to 2020. With such a rapid rise in financial inclusivity, players across the globe are likely to avail themselves of various opportunities for expansion in the forecast period.
Based on the payment method, the market can be segmented into debit cards, credit cards, e-wallets, ACH, and others. According to FMI, the credit card segment is anticipated to expand at a CAGR of 9.3% from 2025 to 2035. The growth of the segment can be attributed to the significant participation of the UK
The region experiences a high card penetration and the presence of multinational companies like MasterCard, Discover, American Express, and Visa are expected to pump the segmental growth in the forecast period. On the other hand, the e-Wallet segment is anticipated to experience robust growth in the forecast period.
As per World Payments Report 2020, globally, cashless transactions carried out with e-wallets were anticipated to be 41.8 billion. With rising mobile payments and increasing penetration of the internet, especially in developing countries, e-Wallet and credit card segments are expected to gain significant traction in the forecast period.
Based on deployment, the market can be segmented into cloud-based and on-premises. According to FMI, the cloud-based segment is anticipated to garner larger traction, than the other segment. The segment is projected to expand at a CAGR of 8.9% from 2025 to 2035. Development of the segment can be attributed to various benefits offered such as; greater flexibility, greater security, easier data integration, and better scalability.
Based on vertical, the BFSI segment is anticipated to garner maximum traction during the forecast period. The growth of the segment can be majorly attributed to the growing adoption of modern payment processing solutions by various banking entities. With the growing penetration of the internet, various projects have been initiated by banks to offer a stable ad cheap payment mechanism to allow expanding business activities.
With the rapid rise of online transactions among users, North America is anticipated to dominate the market in the forecast period. Among all, the USA is projected to make the most significant contribution to strengthening the regional market. USA is estimated at USD 120 Billion while expanding at a CAGR of 9.1% from 2025 to 2035. The growing acceptance of digital payments in the region is expected to lead the market growth.
Moreover, mobile wallets are likely to gain significant traction, thereby, driving the regional market. In the USA, NFC-based payment processing solutions are expected to have held about 40% of the market share in 2024. This can be attributed to the increasing usage of digital payment channels. The burgeoning application of smartphone-based wallets is another crucial factor motivating the application of NFC-based payment modes such as; Google Pay, Samsung Pay, and Apple Pay, among others.
In addition, the presence of established players in the region is expected to provide an enormous boost to the regional market. For instance, in January 2025, PayPal and Salesforce announced a strategic partnership to offer merchants with direct access to the PayPal Commerce Platform while using Salesforce payments. Such initiatives taken by players in the region are expected to strengthen the market growth in the forecast period.
APAC is anticipated to be the fastest-growing market in the forecast period. The growth of the region can be attributed to the expansion of the retail market in APAC. Also, with the presence of developing countries such as; China, Japan, South Korea, and India, among others, the region is anticipated to witness significant market expansion in the assessment period. According to FMI, China is expected to garner the largest revenue of USD 17.2 Billion from 2025 to 2035.
Japan and South Korea are estimated at USD 14.4 Billion and USD 9.1 Billion respectively during the aforementioned time period. The rapid adoption of modern technologies to carry out transactions in the region is expected to positively impact the market growth in the forecast period. Moreover, regional e-commerce industry growth along with growing support from the government of various countries in APAC are projected to drive the market in the forecast period.
Europe is anticipated to garner decent growth during the forecast period. In Europe, the UK is anticipated to make the most significant contribution to developing the regional market. As per FMI, the UK is projected to garner USD 10.3 Billion while expanding at a CAGR of 8.7% during the forecast period.
The growth of the region can be attributed to the increasing adoption of online payments mode, advanced payment processing solutions, and the increasing number of card transactions across the region. Moreover, regulations imposed by the government like Second Payment Services Directive (PSD2) and open banking are further anticipated to trigger regional growth in the forecast period.
| Country | Estimated CAGR |
|---|---|
| USA | 9.1% |
| UK | 8.7% |
| China | 8.9% |
| Japan | 8.6% |
| South Korea | 8.3% |
Key players in the global payment processing solutions market include Global Payments, Mastercard, Paypal, Visa, Wirecard, and others. Key developments in the industry are:
The global payment processing solutions market is estimated to be valued at USD 120.0 billion in 2025.
The market size for the payment processing solutions market is projected to reach USD 308.4 billion by 2035.
The payment processing solutions market is expected to grow at a 9.9% CAGR between 2025 and 2035.
The key product types in payment processing solutions market are credit card, e-wallet, ach, other and debit card.
In terms of mode of deployment, cloud-based segment to command 64.0% share in the payment processing solutions market in 2025.


Our Research Products

The "Full Research Suite" delivers actionable market intel, deep dives on markets or technologies, so clients act faster, cut risk, and unlock growth.

The Leaderboard benchmarks and ranks top vendors, classifying them as Established Leaders, Leading Challengers, or Disruptors & Challengers.

Locates where complements amplify value and substitutes erode it, forecasting net impact by horizon

We deliver granular, decision-grade intel: market sizing, 5-year forecasts, pricing, adoption, usage, revenue, and operational KPIs—plus competitor tracking, regulation, and value chains—across 60 countries broadly.

Spot the shifts before they hit your P&L. We track inflection points, adoption curves, pricing moves, and ecosystem plays to show where demand is heading, why it is changing, and what to do next across high-growth markets and disruptive tech

Real-time reads of user behavior. We track shifting priorities, perceptions of today’s and next-gen services, and provider experience, then pace how fast tech moves from trial to adoption, blending buyer, consumer, and channel inputs with social signals (#WhySwitch, #UX).

Partner with our analyst team to build a custom report designed around your business priorities. From analysing market trends to assessing competitors or crafting bespoke datasets, we tailor insights to your needs.
Supplier Intelligence
Discovery & Profiling
Capacity & Footprint
Performance & Risk
Compliance & Governance
Commercial Readiness
Who Supplies Whom
Scorecards & Shortlists
Playbooks & Docs
Category Intelligence
Definition & Scope
Demand & Use Cases
Cost Drivers
Market Structure
Supply Chain Map
Trade & Policy
Operating Norms
Deliverables
Buyer Intelligence
Account Basics
Spend & Scope
Procurement Model
Vendor Requirements
Terms & Policies
Entry Strategy
Pain Points & Triggers
Outputs
Pricing Analysis
Benchmarks
Trends
Should-Cost
Indexation
Landed Cost
Commercial Terms
Deliverables
Brand Analysis
Positioning & Value Prop
Share & Presence
Customer Evidence
Go-to-Market
Digital & Reputation
Compliance & Trust
KPIs & Gaps
Outputs
Full Research Suite comprises of:
Market outlook & trends analysis
Interviews & case studies
Strategic recommendations
Vendor profiles & capabilities analysis
5-year forecasts
8 regions and 60+ country-level data splits
Market segment data splits
12 months of continuous data updates
DELIVERED AS:
PDF EXCEL ONLINE
Payment Analytics Software Market Size and Share Forecast Outlook 2025 to 2035
Payment Bank Solutions Market Size and Share Forecast Outlook 2025 to 2035
ePayment System Market Analysis by Component, Deployment, Enterprise Size, Industry, and Region through 2025 to 2035
B2B Payments Platform Market
Mobile Payment Transaction Market Analysis – Growth, Applications & Outlook 2025 to 2035
Crypto Payment Gateways Market Insights - Trends & Growth 2025 to 2035
Mobile Payment Data Protection Market Trends – Growth & Demand 2024-2034
Mobile Payment Security Market Insights – Growth & Demand 2024-2034
Secure & Seamless Digital Payments – AI-Powered Payment Gateways
Mobile Payment Technologies Market
Outdoor Payment Terminal Market Size and Share Forecast Outlook 2025 to 2035
Instant Payments Market Size and Share Forecast Outlook 2025 to 2035
The global QR code payment market Analysis – Size, Share, and Forecast Outlook 2025 to 2035
Biometric Payment Cards Market Size and Share Forecast Outlook 2025 to 2035
3D Secure Payment Authentication Market Insights by Components, Application, and Region - 2025 to 2035
Electronic Payment System For Transportation Market Size and Share Forecast Outlook 2025 to 2035
Smart Home Payments Market Size and Share Forecast Outlook 2025 to 2035
In Vehicles Payment Market Size and Share Forecast Outlook 2025 to 2035
Contactless Payment Market
Contactless Payment Terminals Market

Thank you!
You will receive an email from our Business Development Manager. Please be sure to check your SPAM/JUNK folder too.
Chat With
MaRIA