Reports

- Global Locations -

Headquarters

Future Market Insights, Inc.

Christiana Corporate, 200
Continental Drive, Suite 401,
Newark, Delaware - 19713,
United States

T: +1-845-579-5705

Americas

Future Market Insights, Inc.

616 Corporate Way, Suite 2-9018,
Valley Cottage, NY 10989, United States

T: +1-347-918-3531

MEA

Future Market Insights

1602-6 Jumeirah Bay X2 Tower, Plot No: JLT-PH2-X2A,
Jumeirah Lakes Towers, Dubai,
United Arab Emirates

Europe

Future Market Insights

3rd Floor, 207 Regent Street,
W1B 3HH London
United Kingdom

T: + 44 (0) 20 8123 9659
D: +44 (0) 20 3287 4268

Asia Pacific

Future Market Insights

IndiaLand Global Tech Park, Unit UG-1, Behind Grand HighStreet, Phase 1, Hinjawadi, MH, Pune – 411057, India

Biometric Payment Cards Market Outlook (2022-2032)

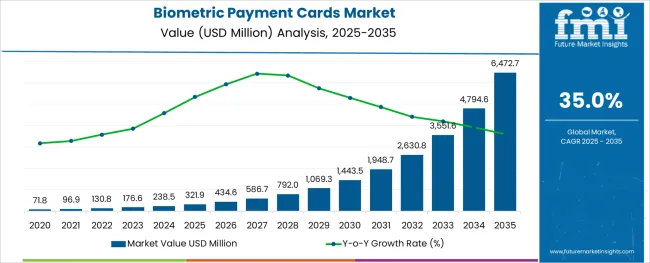
[306 Pages Report] The biometric payment cards market has been valued at USD 75.3 million for 2022; it is anticipated to grow at a CAGR of 62.3% to USD 15498.82 million by 2032. The biometric payment cards market key trends and opportunities are expanding as a result of rising technological development and widespread acceptance of contactless payments.

Due to their higher transaction limit for contactless payment transactions, biometric payment cards are becoming more and more popular over Near Field Communication (NFC) cards.

For instance, the NFC card contactless transaction limit in India is USD 68.48. As a result, biometric payment cards are replacing NFC cards and becoming more and more popular in the biometric payment cards market because they have no transactional limits like NFC cards do.

Since consumers are inclined toward the adoption of biometric payment cards to unlock their mobile phones and want a biometric sensor for simple payment processing, the biometric payment cards market future trends is expanding.

Reduced administration is another key factor boosting the demand for biometric payment cards, which surges the biometric payment cards market adoption trends.

For instance, retailers must control the lines, pay administrative costs, and accept conventional payment methods. However, by using biometric payment cards, the payment queues would be reduced because payments are processed more quickly, which lowers the administrative costs for the merchants and increase the adoption of biometric payment cards hence surging the biometric payment cards market key trends and opportunities.

Businesses have realized the potential of biometric payment cards, and as a result, numerous banks and financial institutions have integrated with biometric payment service providers to offer their clients these smart cards.

For instance, in April 2022, the National Bank of Iraq announced that it had chosen Zwipe, a biometric payment provider, to pilot biometric payment cards through the Zwipe pay platform.

This would be one of the nations of Iraq's first biometric payment cards pilot programs. The biometric payment cards market is expanding globally; thanks to such initiatives also influencing the biometric payment cards market adoption trends and the biometric payment cards market future trends as well.

As biometric payment cards market participants work together to cut costs, it is anticipated that biometric payment card fees will decrease.

Attributes Details
Biometric Payment Cards Market CAGR (2022 to 2032) 62.3%
Biometric Payment Cards Market Size (2022) USD 75.3 million
Biometric Payment Cards Market Size (2032) USD 15498.82 million

Don't pay for what you don't need

Customize your report by selecting specific countries or regions and save 30%!

What Is Propelling The Biometric Payment Cards Market?

Another significant factor driving the biometric payment cards market growth is the growing demand for biometric payment cards on a global scale. The biometric payment cards market players are heavily invested in the introduction of biometric payment cards. As a result, the introduction of more biometric payment cards has increased the adoption of these smart cards by customers and businesses.

For instance, 81.0 % of all global consumers preferred the use of fingerprint biometrics over PIN codes in 2021, according to IDEMIA, a security company.

Debit and credit cards were equipped with the same biometric technology found in mobile phones to ensure maximum security when processing contactless payments, which led to the acceptance and widespread demand for biometric payment cards.

Furthermore, the primary driver of the expansion of biometric payment cards market future trends was the widespread adoption of biometric payment cards. The aforementioned elements thus contribute to the biometric payment cards market’s continued expansion.

What Restrains The Biometric Payment Cards Market?

Although demand for biometric payment cards is growing, their higher cost poses a challenge and may limit the biometric payment cards market growth during the anticipated period.

Another problem with the biometric payment cards market is that the majority of businesses are still engaged in pilot projects, which raises doubts about the technology's eventual commercialization.

As the biometric payment cards market participants are working together to cut costs, it is anticipated that the fees for the biometric payment card will decrease.

For example, Zwipe and IDEMIA, who have partnered, are on track to deliver significant unit cost reductions for biometric payment cards by presenting a single silicon solution.

Sudip Saha
Sudip Saha

Principal Consultant

Talk to Analyst

Find your sweet spots for generating winning opportunities in this market.

What Are The Trends In The Biometric Payment Cards Market?

Although the biometric payment cards market is expanding, the higher cost of these cards can be a problem and may limit the biometric payment cards market opportunities during the anticipated period.

Another problem with the biometric payment cards market is that the majority of businesses are still running pilot programmes, which begs the question of whether the technology will actually be commercialized.

Comparative View Of Adjacent Biometric Payment Cards Market

Biometric Payment Cards Market:

Attributes Biometric Payment Cards Market
CAGR (2022 to 2032) 62.3%
Market Value (2027) USD 1376.28 million
Growth Factor A growing number of people are using the contactless payment method, which increases security and shortens the time needed to process payments.
Opportunity Due to their higher transaction limit for contactless payment transactions, biometric payment cards are becoming more and more popular over Near Field Communication (NFC) cards.
Key Trends The biometric payment cards market is expanding as a result of the rising use of biometric payment cards.

Payment Processing Solutions Market:

Attributes Payment Processing Solutions Market
CAGR (2022 to 2032) 10.1%
Market Value (2027) USD 147.4 billion
Growth Factor Rising internet penetration and rising eCommerce sales
Opportunity The eWallet's introduction has a big impact and promotes financial inclusion.
Key Trends The market for payment processing solutions is anticipated to grow favourably as a result of increasing eCommerce sales.

Digital Payment Market:

Attributes Digital Payment Market
CAGR (2022 to 2032) 15.4%
Market Value (2027) USD 207.95 billion
Growth Factor Due to global initiatives to promote digital payments, it is anticipated that the market for digital payments will expand.
Opportunity mCommerce growth is made possible by the widespread use of smartphones.
Key Trends Sales of online goods and services are rising, as is internet usage.

Get the data you need at a Fraction of the cost

Personalize your report by choosing insights you need
and save 40%!

Which Is The Leading Segment In The Biometric Payment Cards Market By End Use?

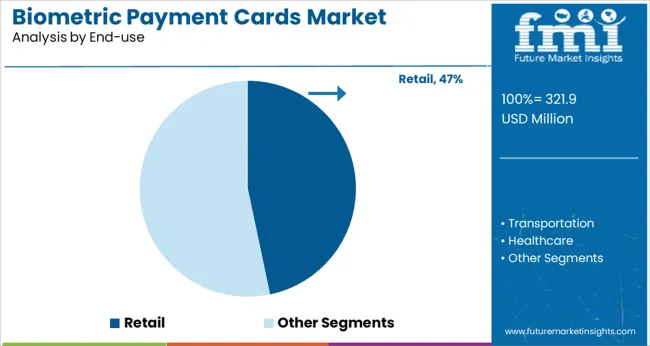
With a revenue share of more than 29%, the retail sector dominated the biometric payment cards market share. With a noteworthy CAGR of 63.3% over the course of the forecast period, the retail segment is also anticipated to grow the fastest for the biometric payment cards market.

NFC, QR codes, and voice payment methods have already been adopted by the retail sector, opening up biometric payment cards market opportunities for segment growth. Additionally, retailers are largely implementing the contactless digital payment method.

The biometric payment cards market players have also partnered with companies to use their retail networks in an effort to spread adoption of biometric payment cards.

Throughout the forecast period, it is anticipated that the hospitality segment will experience significant biometric payment cards market growth. In order to allow customers to pay directly using fingerprint scanners, restaurants and hotels have installed biometric digital payment systems.

For instance, Hitachi has developed a fingertip payment system that allows users to make purchases simply by having their fingers scanned at the device. Therefore, it is anticipated that the hospitality sector's adoption of biometric payment cards systems will accelerate the uptake adoption of biometric payment cards.

Which Is The Leading Segment In The Biometric Payment Cards Market By Card Type?

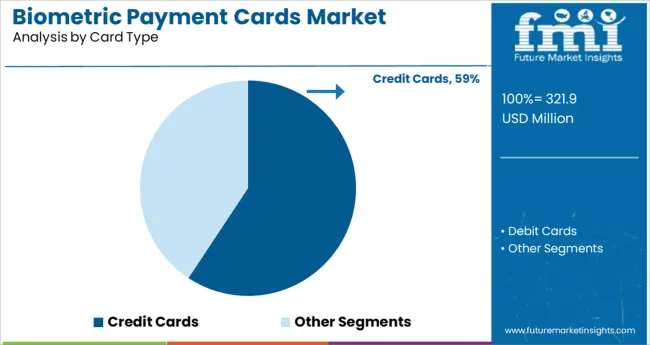
With a revenue share of more than 64.0 %, the debit cards' biometric payment cards market segment is anticipated to be the biometric payment cards market leader.

Debit cards with fingerprint sensors are currently being tested by companies in the biometric payment cards market. The majority of the biometric payment cards market players have also successfully finished the pilot program for debit cards.

During the forecast period, the credit card segment is anticipated to grow at the fastest rate, with a CAGR of 62.7 %. The segment growth is anticipated to be fueled by people using credit cards more frequently, surging the biometric payment cards market size. The adoption of biometric payment cards is the result of a variety of factors, including, among others, using the bank's leverage, receiving cash back, and receiving discounts.

Additionally, banks are starting to test out biometric credit cards, which is increasing the adoption of biometric payment cards.
Which Is The Leading Region In The Biometric Payment Cards Market?

North America held a commanding biometric payment cards market share of more than 35.0%. The existence of a sizable number of businesses operating in the biometric payment cards market can be blamed for the expansion of the regional biometric payment cards market.

According to Visa, contactless payments will be possible on more than 70% of Visa cards in New York as of April 2021.

Such acceptance is being sparked by the New York MTA's introduction of contactless on all subways and buses. Therefore, it is anticipated that the increased use of contactless cards as a form of payment in North America will open up biometric payment cards market opportunities and hence biometric payment cards market growth for the local biometric payment cards market.

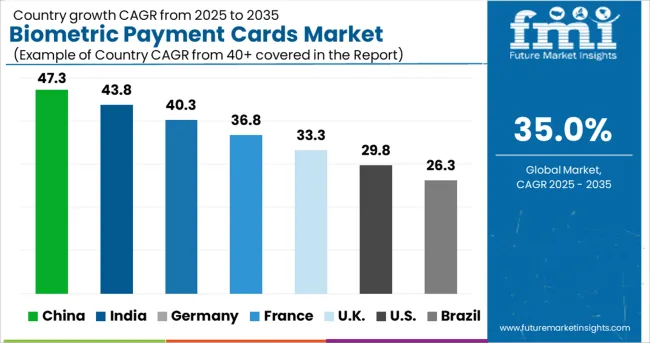
With a CAGR of 63.6%, Asia Pacific is anticipated to grow the fastest during the forecast period. Some of the major biometric payment cards market players, including Goldpac Fintech, are based in Asia Pacific. Additionally, biometric payment cards market participants plan to introduce biometric payment cards in nations throughout the Asia Pacific.
How Competition Influences The Biometric Payment Cards Market?

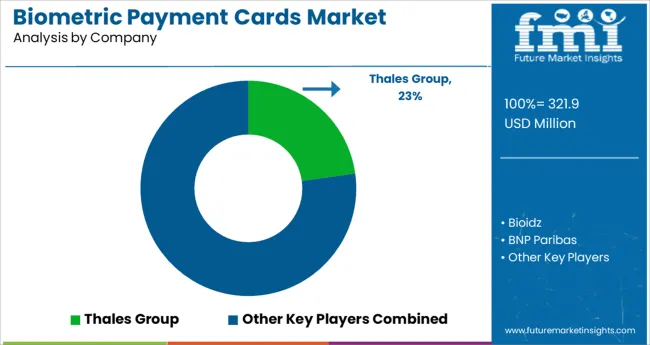
The biometric payment cards market can be characterised as being slightly fragmented. In an effort to strengthen their position in the biometric payment cards market, leading biometric payment cards market players are pursuing a variety of strategies, including strategic partnerships, product innovations and launches, mergers and acquisitions, and geographic expansion.

While some biometric payment cards market players are concentrating on piloting the biometric credit and debit cards to quickly introduce the commercialization of these smart cards, others are concentrating on launching the biometric payment cards to offer customers a secured contactless payment processing experience.

Businesses are implementing a variety of strategies to increase biometric payment cards market share as a result of biometric payment cards market competition. The most widely used tactic is strategic partnerships. The businesses are collaborating to introduce biometric payment cards.

Recent Development:

  • Zwipe and Easy Pay, an Indian payment provider, partnered in December 2021. Zwipe will launch its biometric payment cards in India with the help of Easy Pay, which has a network of nearly 2 million retailers.
  • Rocker launched the Rocker Touch, a biometric payment card, in Sweden in February 2022. One of the first biometric payment cards in the world was made available to consumers by Rocker in collaboration with IDEMIA and IDEX.
  • MasterCard launched its first pilot of a biometric payment card with a fingerprint sensor to authorise in-store payment transactions across Asia in October 2020 in collaboration with IDEMIA, a security company, and Match Move, a Fintech company. The segment is expected to grow as a result of these partnerships for testing and launching biometric payment cards throughout Asia and the Pacific.
  • NatWest announced in October 2019 that 150 customers would test biometric credit cards across the United Kingdom. Customers in the U.K. can now use this service thanks to a partnership between NatWest, MasterCard, and Gem Alto.

Key Players

  • Bio-idz
  • BNP Paribas
  • Goldpac Fintech
  • IDEX Biometrics ASA
  • Infineon Technologies AG
  • MasterCard
  • NXP Semiconductors
  • Thales Group
  • Visa Inc.
  • Zwipe

Key Segments

By Card Type:

  • Credit Cards
  • Debit Cards

By End-use:

  • Retail
  • Transportation
  • Healthcare
  • Hospitality
  • Government
  • Others

Frequently Asked Questions

What is the CAGR of the Biometric Payment Cards Market?

The biometric payment cards market is projected to have a CAGR of 62.3% through 2032.

Which is the Leading Region in the Biometric Payment Cards Market?

North America is the leading region in the biometric payment cards market, with an anticipated market share of 35%.

Which Segment Leads in the Biometric Payment Cards Market by Card Type?

With a revenue share of 64.0 %, the debit cards’ segment is anticipated to be the biometric payment cards market leader in the segment.

What is the Growth Estimated for the Biometric Payment Cards Market by 2030?

The biometric payment cards market is predicted to grow USD 5883.85 million by 2030.

Which Segment Leads in the Biometric Payment Cards Market by End Use?

With a noteworthy CAGR of 63.3%, the retail segment is anticipated to grow the fastest for the biometric payment cards market.

Table of Content

1. Executive Summary

    1.1. Global Market Outlook

    1.2. Demand-side Trends

    1.3. Supply-side Trends

    1.4. Technology Roadmap Analysis

    1.5. Analysis and Recommendations

2. Market Overview

    2.1. Market Coverage / Taxonomy

    2.2. Market Definition / Scope / Limitations

3. Market Background

    3.1. Market Dynamics

        3.1.1. Drivers

        3.1.2. Restraints

        3.1.3. Opportunity

        3.1.4. Trends

    3.2. Scenario Forecast

        3.2.1. Demand in Optimistic Scenario

        3.2.2. Demand in Likely Scenario

        3.2.3. Demand in Conservative Scenario

    3.3. Opportunity Map Analysis

    3.4. Investment Feasibility Matrix

    3.5. Value Chain Analysis

        3.5.1. Profit Margin Analysis

        3.5.2. Service Providers

    3.6. PESTLE and Porter’s Analysis

    3.7. Regulatory Landscape

        3.7.1. By Key Regions

        3.7.2. By Key Countries

    3.8. Regional Parent Market Outlook

4. Global Analysis 2017-2021 and Forecast, 2022-2032

    4.1. Historical Market Size Value (US$ Mn) Analysis, 2017-2021

    4.2. Current and Future Market Size Value (US$ Mn) Projections, 2022-2032

        4.2.1. Y-o-Y Growth Trend Analysis

        4.2.2. Absolute $ Opportunity Analysis

5. Global Analysis 2017-2021 and Forecast 2022-2032, By Card Type

    5.1. Introduction / Key Findings

    5.2. Historical Market Size Value (US$ Mn) Analysis By Card Type, 2017-2021

    5.3. Current and Future Market Size Value (US$ Mn) Analysis and Forecast By Card Type, 2022-2032

        5.3.1. Credit Cards

        5.3.2. Debit Cards

    5.4. Y-o-Y Growth Trend Analysis By Card Type, 2017-2021

    5.5. Absolute $ Opportunity Analysis By Card Type, 2022-2032

6. Global Analysis 2017-2021 and Forecast 2022-2032, By End-use

    6.1. Introduction / Key Findings

    6.2. Historical Market Size Value (US$ Mn) Analysis By End-use, 2017-2021

    6.3. Current and Future Market Size Value (US$ Mn) Analysis and Forecast By End-use, 2022-2032

        6.3.1. Retail

        6.3.2. Transportation

        6.3.3. Healthcare

        6.3.4. Hospitality

        6.3.5. Government

        6.3.6. Others

    6.4. Y-o-Y Growth Trend Analysis By End-use, 2017-2021

    6.5. Absolute $ Opportunity Analysis By End-use, 2022-2032

7. Global Analysis 2017-2021 and Forecast 2022-2032, By Region

    7.1. Introduction

    7.2. Historical Market Size Value (US$ Mn) Analysis By Region, 2017-2021

    7.3. Current Market Size Value (US$ Mn) Analysis and Forecast By Region, 2022-2032

        7.3.1. North America

        7.3.2. Latin America

        7.3.3. Europe

        7.3.4. East Asia

        7.3.5. South Asia & Pacific

        7.3.6. MEA

    7.4. Market Attractiveness Analysis By Region

8. North America Analysis 2017-2021 and Forecast 2022-2032, By Country

    8.1. Historical Market Size Value (US$ Mn) Trend Analysis By Market Taxonomy, 2017-2021

    8.2. Market Size Value (US$ Mn) Forecast By Market Taxonomy, 2022-2032

        8.2.1. By Country

            8.2.1.1. U.S.

            8.2.1.2. Canada

        8.2.2. By Card Type

        8.2.3. By End-use

    8.3. Market Attractiveness Analysis

        8.3.1. By Country

        8.3.2. By Card Type

        8.3.3. By End-use

    8.4. Key Takeaways

9. Latin America Analysis 2017-2021 and Forecast 2022-2032, By Country

    9.1. Historical Market Size Value (US$ Mn) Trend Analysis By Market Taxonomy, 2017-2021

    9.2. Market Size Value (US$ Mn) Forecast By Market Taxonomy, 2022-2032

        9.2.1. By Country

            9.2.1.1. Mexico

            9.2.1.2. Brazil

            9.2.1.3. Rest of Latin America

        9.2.2. By Card Type

        9.2.3. By End-use

    9.3. Market Attractiveness Analysis

        9.3.1. By Country

        9.3.2. By Card Type

        9.3.3. By End-use

    9.4. Key Takeaways

10. Europe Analysis 2017-2021 and Forecast 2022-2032, By Country

    10.1. Historical Market Size Value (US$ Mn) Trend Analysis By Market Taxonomy, 2017-2021

    10.2. Market Size Value (US$ Mn) Forecast By Market Taxonomy, 2022-2032

        10.2.1. By Country

            10.2.1.1. Germany

            10.2.1.2. Italy

            10.2.1.3. France

            10.2.1.4. U.K.

            10.2.1.5. Spain

            10.2.1.6. BENELUX

            10.2.1.7. Russia

            10.2.1.8. Rest of Europe

        10.2.2. By Card Type

        10.2.3. By End-use

    10.3. Market Attractiveness Analysis

        10.3.1. By Country

        10.3.2. By Card Type

        10.3.3. By End-use

    10.4. Key Takeaways

11. East Asia Analysis 2017-2021 and Forecast 2022-2032, By Country

    11.1. Historical Market Size Value (US$ Mn) Trend Analysis By Market Taxonomy, 2017-2021

    11.2. Market Size Value (US$ Mn) Forecast By Market Taxonomy, 2022-2032

        11.2.1. By Country

            11.2.1.1. China

            11.2.1.2. Japan

            11.2.1.3. South Korea

        11.2.2. By Card Type

        11.2.3. By End-use

    11.3. Market Attractiveness Analysis

        11.3.1. By Country

        11.3.2. By Card Type

        11.3.3. By End-use

    11.4. Key Takeaways

12. South Asia & Pacific Analysis 2017-2021 and Forecast 2022-2032, By Country

    12.1. Historical Market Size Value (US$ Mn) Trend Analysis By Market Taxonomy, 2017-2021

    12.2. Market Size Value (US$ Mn) Forecast By Market Taxonomy, 2022-2032

        12.2.1. By Country

            12.2.1.1. India

            12.2.1.2. ASEAN

            12.2.1.3. Australia and New Zealand

            12.2.1.4. Rest of South Asia & Pacific

        12.2.2. By Card Type

        12.2.3. By End-use

    12.3. Market Attractiveness Analysis

        12.3.1. By Country

        12.3.2. By Card Type

        12.3.3. By End-use

    12.4. Key Takeaways

13. MEA Analysis 2017-2021 and Forecast 2022-2032, By Country

    13.1. Historical Market Size Value (US$ Mn) Trend Analysis By Market Taxonomy, 2017-2021

    13.2. Market Size Value (US$ Mn) Forecast By Market Taxonomy, 2022-2032

        13.2.1. By Country

            13.2.1.1. GCC Countries

            13.2.1.2. Turkey

            13.2.1.3. South Africa

            13.2.1.4. Rest of MEA

        13.2.2. By Card Type

        13.2.3. By End-use

    13.3. Market Attractiveness Analysis

        13.3.1. By Country

        13.3.2. By Card Type

        13.3.3. By End-use

    13.4. Key Takeaways

14. Key Countries Analysis

    14.1. U.S.

        14.1.1. Pricing Analysis

        14.1.2. Market Share Analysis, 2021

            14.1.2.1. By Card Type

            14.1.2.2. By End-use

    14.2. Canada

        14.2.1. Pricing Analysis

        14.2.2. Market Share Analysis, 2021

            14.2.2.1. By Card Type

            14.2.2.2. By End-use

    14.3. Mexico

        14.3.1. Pricing Analysis

        14.3.2. Market Share Analysis, 2021

            14.3.2.1. By Card Type

            14.3.2.2. By End-use

    14.4. Brazil

        14.4.1. Pricing Analysis

        14.4.2. Market Share Analysis, 2021

            14.4.2.1. By Card Type

            14.4.2.2. By End-use

    14.5. Germany

        14.5.1. Pricing Analysis

        14.5.2. Market Share Analysis, 2021

            14.5.2.1. By Card Type

            14.5.2.2. By End-use

    14.6. Italy

        14.6.1. Pricing Analysis

        14.6.2. Market Share Analysis, 2021

            14.6.2.1. By Card Type

            14.6.2.2. By End-use

    14.7. France

        14.7.1. Pricing Analysis

        14.7.2. Market Share Analysis, 2021

            14.7.2.1. By Card Type

            14.7.2.2. By End-use

    14.8. U.K.

        14.8.1. Pricing Analysis

        14.8.2. Market Share Analysis, 2021

            14.8.2.1. By Card Type

            14.8.2.2. By End-use

    14.9. Spain

        14.9.1. Pricing Analysis

        14.9.2. Market Share Analysis, 2021

            14.9.2.1. By Card Type

            14.9.2.2. By End-use

    14.10. BENELUX

        14.10.1. Pricing Analysis

        14.10.2. Market Share Analysis, 2021

            14.10.2.1. By Card Type

            14.10.2.2. By End-use

    14.11. Russia

        14.11.1. Pricing Analysis

        14.11.2. Market Share Analysis, 2021

            14.11.2.1. By Card Type

            14.11.2.2. By End-use

    14.12. China

        14.12.1. Pricing Analysis

        14.12.2. Market Share Analysis, 2021

            14.12.2.1. By Card Type

            14.12.2.2. By End-use

    14.13. Japan

        14.13.1. Pricing Analysis

        14.13.2. Market Share Analysis, 2021

            14.13.2.1. By Card Type

            14.13.2.2. By End-use

    14.14. South Korea

        14.14.1. Pricing Analysis

        14.14.2. Market Share Analysis, 2021

            14.14.2.1. By Card Type

            14.14.2.2. By End-use

    14.15. India

        14.15.1. Pricing Analysis

        14.15.2. Market Share Analysis, 2021

            14.15.2.1. By Card Type

            14.15.2.2. By End-use

    14.16. ASEAN

        14.16.1. Pricing Analysis

        14.16.2. Market Share Analysis, 2021

            14.16.2.1. By Card Type

            14.16.2.2. By End-use

    14.17. Australia and New Zealand

        14.17.1. Pricing Analysis

        14.17.2. Market Share Analysis, 2021

            14.17.2.1. By Card Type

            14.17.2.2. By End-use

    14.18. GCC Countries

        14.18.1. Pricing Analysis

        14.18.2. Market Share Analysis, 2021

            14.18.2.1. By Card Type

            14.18.2.2. By End-use

    14.19. Turkey

        14.19.1. Pricing Analysis

        14.19.2. Market Share Analysis, 2021

            14.19.2.1. By Card Type

            14.19.2.2. By End-use

    14.20. South Africa

        14.20.1. Pricing Analysis

        14.20.2. Market Share Analysis, 2021

            14.20.2.1. By Card Type

            14.20.2.2. By End-use

15. Market Structure Analysis

    15.1. Competition Dashboard

    15.2. Competition Benchmarking

    15.3. Market Share Analysis of Top Players

        15.3.1. By Regional

        15.3.2. By Card Type

        15.3.3. By End-use

16. Competition Analysis

    16.1. Competition Deep Dive

        16.1.1. Bio-idz

            16.1.1.1. Overview

            16.1.1.2. Product Portfolio

            16.1.1.3. Profitability by Market Segments

            16.1.1.4. Sales Footprint

            16.1.1.5. Strategy Overview

                16.1.1.5.1. Marketing Strategy

                16.1.1.5.2. Product Strategy

                16.1.1.5.3. Channel Strategy

        16.1.2. BNP Paribas

            16.1.2.1. Overview

            16.1.2.2. Product Portfolio

            16.1.2.3. Profitability by Market Segments

            16.1.2.4. Sales Footprint

            16.1.2.5. Strategy Overview

                16.1.2.5.1. Marketing Strategy

                16.1.2.5.2. Product Strategy

                16.1.2.5.3. Channel Strategy

        16.1.3. Goldpac Fintech

            16.1.3.1. Overview

            16.1.3.2. Product Portfolio

            16.1.3.3. Profitability by Market Segments

            16.1.3.4. Sales Footprint

            16.1.3.5. Strategy Overview

                16.1.3.5.1. Marketing Strategy

                16.1.3.5.2. Product Strategy

                16.1.3.5.3. Channel Strategy

        16.1.4. IDEX Biometrics ASA

            16.1.4.1. Overview

            16.1.4.2. Product Portfolio

            16.1.4.3. Profitability by Market Segments

            16.1.4.4. Sales Footprint

            16.1.4.5. Strategy Overview

                16.1.4.5.1. Marketing Strategy

                16.1.4.5.2. Product Strategy

                16.1.4.5.3. Channel Strategy

        16.1.5. Infineon Technologies AG

            16.1.5.1. Overview

            16.1.5.2. Product Portfolio

            16.1.5.3. Profitability by Market Segments

            16.1.5.4. Sales Footprint

            16.1.5.5. Strategy Overview

                16.1.5.5.1. Marketing Strategy

                16.1.5.5.2. Product Strategy

                16.1.5.5.3. Channel Strategy

        16.1.6. MasterCard

            16.1.6.1. Overview

            16.1.6.2. Product Portfolio

            16.1.6.3. Profitability by Market Segments

            16.1.6.4. Sales Footprint

            16.1.6.5. Strategy Overview

                16.1.6.5.1. Marketing Strategy

                16.1.6.5.2. Product Strategy

                16.1.6.5.3. Channel Strategy

        16.1.7. NXP Semiconductors

            16.1.7.1. Overview

            16.1.7.2. Product Portfolio

            16.1.7.3. Profitability by Market Segments

            16.1.7.4. Sales Footprint

            16.1.7.5. Strategy Overview

                16.1.7.5.1. Marketing Strategy

                16.1.7.5.2. Product Strategy

                16.1.7.5.3. Channel Strategy

        16.1.8. Thales Group

            16.1.8.1. Overview

            16.1.8.2. Product Portfolio

            16.1.8.3. Profitability by Market Segments

            16.1.8.4. Sales Footprint

            16.1.8.5. Strategy Overview

                16.1.8.5.1. Marketing Strategy

                16.1.8.5.2. Product Strategy

                16.1.8.5.3. Channel Strategy

        16.1.9. Visa Inc.

            16.1.9.1. Overview

            16.1.9.2. Product Portfolio

            16.1.9.3. Profitability by Market Segments

            16.1.9.4. Sales Footprint

            16.1.9.5. Strategy Overview

                16.1.9.5.1. Marketing Strategy

                16.1.9.5.2. Product Strategy

                16.1.9.5.3. Channel Strategy

        16.1.10. Zwipe

            16.1.10.1. Overview

            16.1.10.2. Product Portfolio

            16.1.10.3. Profitability by Market Segments

            16.1.10.4. Sales Footprint

            16.1.10.5. Strategy Overview

                16.1.10.5.1. Marketing Strategy

                16.1.10.5.2. Product Strategy

                16.1.10.5.3. Channel Strategy

17. Assumptions & Acronyms Used

18. Research Methodology

List of Tables

Table 01: Global Value (US$ Mn) Forecast by Region, 2017-2032

Table 02: Global Value (US$ Mn) Forecast by Card Type, 2017-2032

Table 03: Global Value (US$ Mn) Forecast by End-use, 2017-2032

Table 04: North America Value (US$ Mn) Forecast by Country, 2017-2032

Table 05: North America Value (US$ Mn) Forecast by Card Type, 2017-2032

Table 06: North America Value (US$ Mn) Forecast by End-use, 2017-2032

Table 07: Latin America Value (US$ Mn) Forecast by Country, 2017-2032

Table 08: Latin America Value (US$ Mn) Forecast by Card Type, 2017-2032

Table 09: Latin America Value (US$ Mn) Forecast by End-use, 2017-2032

Table 10: Europe Value (US$ Mn) Forecast by Country, 2017-2032

Table 11: Europe Value (US$ Mn) Forecast by Card Type, 2017-2032

Table 12: Europe Value (US$ Mn) Forecast by End-use, 2017-2032

Table 13: East Asia Value (US$ Mn) Forecast by Country, 2017-2032

Table 14: East Asia Value (US$ Mn) Forecast by Card Type, 2017-2032

Table 15: East Asia Value (US$ Mn) Forecast by End-use, 2017-2032

Table 16: South Asia & Pacific Value (US$ Mn) Forecast by Country, 2017-2032

Table 17: South Asia & Pacific Value (US$ Mn) Forecast by Card Type, 2017-2032

Table 18: South Asia & Pacific Value (US$ Mn) Forecast by End-use, 2017-2032

Table 19: MEA Value (US$ Mn) Forecast by Country, 2017-2032

Table 20: MEA Value (US$ Mn) Forecast by Card Type, 2017-2032

Table 21: MEA Value (US$ Mn) Forecast by End-use, 2017-2032

List of Charts

Figure 01: Global Value (US$ Mn) by Card Type, 2022-2032

Figure 02: Global Value (US$ Mn) by End-use, 2022-2032

Figure 03: Global Value (US$ Mn) by Region, 2022-2032

Figure 04: Global Value (US$ Mn) Analysis by Region, 2017-2032

Figure 05: Global Value Share (%) and BPS Analysis by Region, 2022-2032

Figure 06: Global Y-o-Y Growth (%) Projections by Region, 2022-2032

Figure 07: Global Value (US$ Mn) Analysis by Card Type, 2017-2032

Figure 08: Global Value Share (%) and BPS Analysis by Card Type, 2022-2032

Figure 09: Global Y-o-Y Growth (%) Projections by Card Type, 2022-2032

Figure 10: Global Value (US$ Mn) Analysis by End-use, 2017-2032

Figure 11: Global Value Share (%) and BPS Analysis by End-use, 2022-2032

Figure 12: Global Y-o-Y Growth (%) Projections by End-use, 2022-2032

Figure 13: Global Attractiveness by Card Type, 2022-2032

Figure 14: Global Attractiveness by End-use, 2022-2032

Figure 15: Global Attractiveness by Region, 2022-2032

Figure 16: North America Value (US$ Mn) by Card Type, 2022-2032

Figure 17: North America Value (US$ Mn) by End-use, 2022-2032

Figure 18: North America Value (US$ Mn) by Country, 2022-2032

Figure 19: North America Value (US$ Mn) Analysis by Country, 2017-2032

Figure 20: North America Value Share (%) and BPS Analysis by Country, 2022-2032

Figure 21: North America Y-o-Y Growth (%) Projections by Country, 2022-2032

Figure 22: North America Value (US$ Mn) Analysis by Card Type, 2017-2032

Figure 23: North America Value Share (%) and BPS Analysis by Card Type, 2022-2032

Figure 24: North America Y-o-Y Growth (%) Projections by Card Type, 2022-2032

Figure 25: North America Value (US$ Mn) Analysis by End-use, 2017-2032

Figure 26: North America Value Share (%) and BPS Analysis by End-use, 2022-2032

Figure 27: North America Y-o-Y Growth (%) Projections by End-use, 2022-2032

Figure 28: North America Attractiveness by Card Type, 2022-2032

Figure 29: North America Attractiveness by End-use, 2022-2032

Figure 30: North America Attractiveness by Country, 2022-2032

Figure 31: Latin America Value (US$ Mn) by Card Type, 2022-2032

Figure 32: Latin America Value (US$ Mn) by End-use, 2022-2032

Figure 33: Latin America Value (US$ Mn) by Country, 2022-2032

Figure 34: Latin America Value (US$ Mn) Analysis by Country, 2017-2032

Figure 35: Latin America Value Share (%) and BPS Analysis by Country, 2022-2032

Figure 36: Latin America Y-o-Y Growth (%) Projections by Country, 2022-2032

Figure 37: Latin America Value (US$ Mn) Analysis by Card Type, 2017-2032

Figure 38: Latin America Value Share (%) and BPS Analysis by Card Type, 2022-2032

Figure 39: Latin America Y-o-Y Growth (%) Projections by Card Type, 2022-2032

Figure 40: Latin America Value (US$ Mn) Analysis by End-use, 2017-2032

Figure 41: Latin America Value Share (%) and BPS Analysis by End-use, 2022-2032

Figure 42: Latin America Y-o-Y Growth (%) Projections by End-use, 2022-2032

Figure 43: Latin America Attractiveness by Card Type, 2022-2032

Figure 44: Latin America Attractiveness by End-use, 2022-2032

Figure 45: Latin America Attractiveness by Country, 2022-2032

Figure 46: Europe Value (US$ Mn) by Card Type, 2022-2032

Figure 47: Europe Value (US$ Mn) by End-use, 2022-2032

Figure 48: Europe Value (US$ Mn) by Country, 2022-2032

Figure 49: Europe Value (US$ Mn) Analysis by Country, 2017-2032

Figure 50: Europe Value Share (%) and BPS Analysis by Country, 2022-2032

Figure 51: Europe Y-o-Y Growth (%) Projections by Country, 2022-2032

Figure 52: Europe Value (US$ Mn) Analysis by Card Type, 2017-2032

Figure 53: Europe Value Share (%) and BPS Analysis by Card Type, 2022-2032

Figure 54: Europe Y-o-Y Growth (%) Projections by Card Type, 2022-2032

Figure 55: Europe Value (US$ Mn) Analysis by End-use, 2017-2032

Figure 56: Europe Value Share (%) and BPS Analysis by End-use, 2022-2032

Figure 57: Europe Y-o-Y Growth (%) Projections by End-use, 2022-2032

Figure 58: Europe Attractiveness by Card Type, 2022-2032

Figure 59: Europe Attractiveness by End-use, 2022-2032

Figure 60: Europe Attractiveness by Country, 2022-2032

Figure 61: East Asia Value (US$ Mn) by Card Type, 2022-2032

Figure 62: East Asia Value (US$ Mn) by End-use, 2022-2032

Figure 63: East Asia Value (US$ Mn) by Country, 2022-2032

Figure 64: East Asia Value (US$ Mn) Analysis by Country, 2017-2032

Figure 65: East Asia Value Share (%) and BPS Analysis by Country, 2022-2032

Figure 66: East Asia Y-o-Y Growth (%) Projections by Country, 2022-2032

Figure 67: East Asia Value (US$ Mn) Analysis by Card Type, 2017-2032

Figure 68: East Asia Value Share (%) and BPS Analysis by Card Type, 2022-2032

Figure 69: East Asia Y-o-Y Growth (%) Projections by Card Type, 2022-2032

Figure 70: East Asia Value (US$ Mn) Analysis by End-use, 2017-2032

Figure 71: East Asia Value Share (%) and BPS Analysis by End-use, 2022-2032

Figure 72: East Asia Y-o-Y Growth (%) Projections by End-use, 2022-2032

Figure 73: East Asia Attractiveness by Card Type, 2022-2032

Figure 74: East Asia Attractiveness by End-use, 2022-2032

Figure 75: East Asia Attractiveness by Country, 2022-2032

Figure 76: South Asia & Pacific Value (US$ Mn) by Card Type, 2022-2032

Figure 77: South Asia & Pacific Value (US$ Mn) by End-use, 2022-2032

Figure 78: South Asia & Pacific Value (US$ Mn) by Country, 2022-2032

Figure 79: South Asia & Pacific Value (US$ Mn) Analysis by Country, 2017-2032

Figure 80: South Asia & Pacific Value Share (%) and BPS Analysis by Country, 2022-2032

Figure 81: South Asia & Pacific Y-o-Y Growth (%) Projections by Country, 2022-2032

Figure 82: South Asia & Pacific Value (US$ Mn) Analysis by Card Type, 2017-2032

Figure 83: South Asia & Pacific Value Share (%) and BPS Analysis by Card Type, 2022-2032

Figure 84: South Asia & Pacific Y-o-Y Growth (%) Projections by Card Type, 2022-2032

Figure 85: South Asia & Pacific Value (US$ Mn) Analysis by End-use, 2017-2032

Figure 86: South Asia & Pacific Value Share (%) and BPS Analysis by End-use, 2022-2032

Figure 87: South Asia & Pacific Y-o-Y Growth (%) Projections by End-use, 2022-2032

Figure 88: South Asia & Pacific Attractiveness by Card Type, 2022-2032

Figure 89: South Asia & Pacific Attractiveness by End-use, 2022-2032

Figure 90: South Asia & Pacific Attractiveness by Country, 2022-2032

Figure 91: MEA Value (US$ Mn) by Card Type, 2022-2032

Figure 92: MEA Value (US$ Mn) by End-use, 2022-2032

Figure 93: MEA Value (US$ Mn) by Country, 2022-2032

Figure 94: MEA Value (US$ Mn) Analysis by Country, 2017-2032

Figure 95: MEA Value Share (%) and BPS Analysis by Country, 2022-2032

Figure 96: MEA Y-o-Y Growth (%) Projections by Country, 2022-2032

Figure 97: MEA Value (US$ Mn) Analysis by Card Type, 2017-2032

Figure 98: MEA Value Share (%) and BPS Analysis by Card Type, 2022-2032

Figure 99: MEA Y-o-Y Growth (%) Projections by Card Type, 2022-2032

Figure 100: MEA Value (US$ Mn) Analysis by End-use, 2017-2032

Figure 101: MEA Value Share (%) and BPS Analysis by End-use, 2022-2032

Figure 102: MEA Y-o-Y Growth (%) Projections by End-use, 2022-2032

Figure 103: MEA Attractiveness by Card Type, 2022-2032

Figure 104: MEA Attractiveness by End-use, 2022-2032

Figure 105: MEA Attractiveness by Country, 2022-2032

Recommendations

Technology

Mobile Payment Transaction Market

Published : October 2023

Explore Technology Insights

View Reports

Biometric Payment Cards Market