

- Market Size (2026)
- USD 1.2 Bn
- Forecast (2036)
- USD 2.9 Bn
- CAGR (2026 to 2036)
- 8.9%
How big is the peptide coupling reagents market in 2026?
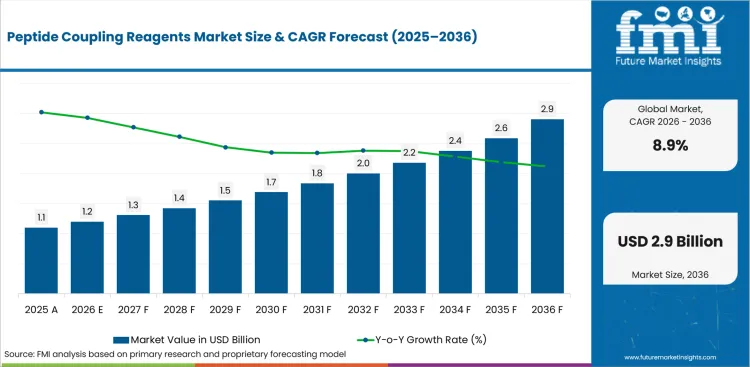
USD 1.2 billion in 2026 and USD 2.9 billion by 2036 at an 8.9% CAGR.
The peptide coupling reagents market is projected to grow from USD 1.1 billion in 2025 to USD 2.9 billion by 2036 at an 8.9% CAGR due to peptide API scale-up and stronger documentation needs across regulated synthesis. Uronium / Guanidinium Reagents are expected to hold 38.7% share in 2026 owing to use in difficult couplings and faster activation. Solid Phase Peptide Synthesis is projected to hold 64.3% share in 2026 as automated synthesis lines require repeatable activation chemistry.
Regulated peptide development is turning reagent selection into a process-risk decision for pharma and CDMO buyers. FDA reported 46 CDER novel drug approvals for 2025 in January 2026, showing an active review environment for complex therapies and process chemistry support. NIH reported USD 35.3 billion in fiscal year 2025 extramural grants in March 2026, reinforcing the research base that sustains early peptide synthesis demand. CordenPharma announced EUR 900 million in peptide platform expansion in July 2024, which shows how GLP-1 capacity commitments can raise upstream demand for qualified coupling inputs.
| Metric | Value |
|---|---|
| 2026 Market Size | USD 1.2 billion |
| 2036 Market Size | USD 2.9 billion |
| Forecast CAGR (2026-2036) | 8.9% |
| Leading Reagent Type | Uronium / Guanidinium Reagents |
| Uronium / Guanidinium Reagents Share (2026) | 38.7% |
| Leading Synthesis Method | Solid Phase Peptide Synthesis |
| Solid Phase Peptide Synthesis Share (2026) | 64.3% |
| Fastest-growing Country | India |
| India CAGR by 2036 | 10.0% |
Summary of the Peptide Coupling Reagents Market
| Market Signal | Commercial Impact |
|---|---|
| Demand and Growth Drivers | Demand for peptide coupling reagents is increasing as therapeutic peptide development advances from discovery into regulated manufacturing, creating stronger requirements for reliable coupling chemistry, documented quality, and scalable production workflows.
|
| Product and Segment View | Uronium/Guanidinium reagents, Solid Phase Peptide Synthesis, therapeutic peptide manufacturing, pharmaceutical and biotechnology companies, and direct procurement remain the leading market segments.
|
| Geography and Growth Outlook | Asia continues to strengthen its position as peptide manufacturing capacity expands through API production, CDMO investments, and fine chemical capabilities.
|
| Competitive Landscape | Competition increasingly centers on reagent consistency, technical expertise, regulatory documentation, and reliable global supply capabilities.
|
| Analyst Perspective | Peptide coupling reagents are increasingly evaluated as process-critical materials where coupling efficiency, impurity control, and manufacturing consistency influence supplier selection beyond purchase price.
- Anurag Sharma, Principal Analyst at Future Market Insights |
Which factors support expansion in the peptide coupling reagents market?
Peptide API scale-up and documented reagent supply support market value across pharma and CDMO accounts.
- Market value is supported by regulated peptide synthesis demand before research-grade restocking adds recurring sales.
- Supplier pricing reflects reagent purity and hazard documentation before pack-size discounts affect purchase approval.
- Revenue improves as CDMOs move complex peptide sequences into repeat campaigns that require qualified inputs.
- Buyer trust rises as certificates and impurity data make reagent approval easier during route transfer.
Why is the peptide coupling reagents market growing?
Peptide API scale-up needs repeatable activation chemistry that protects yield across long and aggregation-prone sequences.
Growth is supported by safer reagent selection and stronger quality expectations in peptide manufacturing. Bachem states that TBTU, HBTU and PyBOP are useful for standard coupling reactions but contain potentially explosive HOBt as part of the molecule. That safety issue matters because larger plants must evaluate storage, waste and transport exposure before approving a route. Suppliers with Oxyma-based alternatives and clear hazard files can defend premium positioning in regulated accounts.
How is the peptide coupling reagents market segmented?
The peptide coupling reagents industry is segmented by reagent type, synthesis method, application, end use, and sales channel.
- Uronium / Guanidinium Reagents are projected to secure 38.7% share in 2026 due to use in difficult peptide couplings.
- Solid Phase Peptide Synthesis is anticipated to hold 64.3% share in 2026 as automated workflows need repeatable cycles.
- Therapeutic Peptides are expected to capture 46.8% share in 2026 due to GLP-1 and oncology route demand.
- Pharma & Biotech is forecast to represent 44.1% share in 2026 due to early reagent qualification by sponsors.
- Direct Supply is projected to account for 52.6% share in 2026 as documentation and batch traceability shape purchasing.
Which reagent type category holds a notable share in the peptide coupling reagents market?
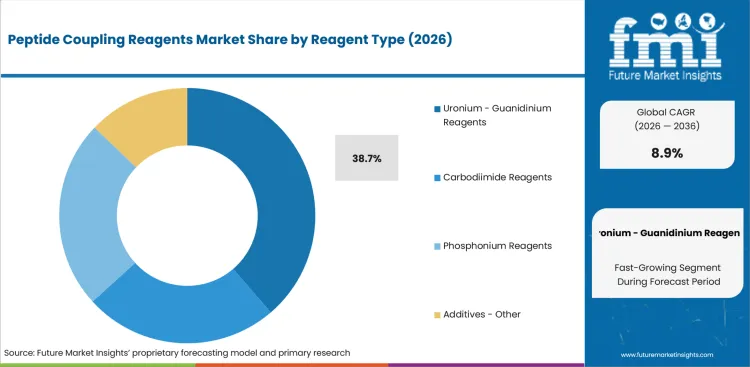
- Uronium / Guanidinium Reagents are projected to account for 38.7% share in 2026 owing to fast activation performance.
- Carbodiimide reagents retain routine demand in research use, but safety and impurity needs limit premium positioning.
How does the synthesis method segment perform in the peptide coupling reagents market?
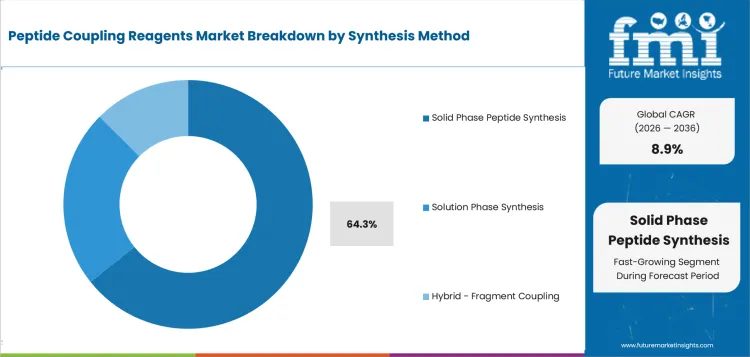
- Solid Phase Peptide Synthesis is estimated to hold 64.3% share in 2026 due to automated cycle control.
- Solution phase synthesis remains relevant for selected fragments and short sequences that suit traditional process routes.
What drives demand across application options in the peptide coupling reagents market?
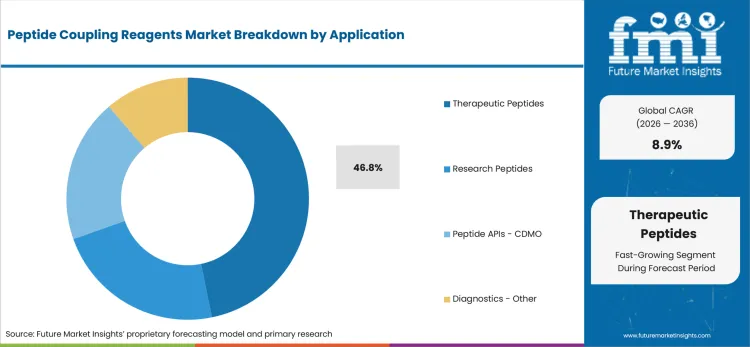
- Therapeutic Peptides are anticipated to hold 46.8% share in 2026 because regulated drug programs need validated grades.
- Research Peptides continue to support small-pack demand from academic users and early discovery groups.
How are end-use buyers selecting peptide coupling reagents?
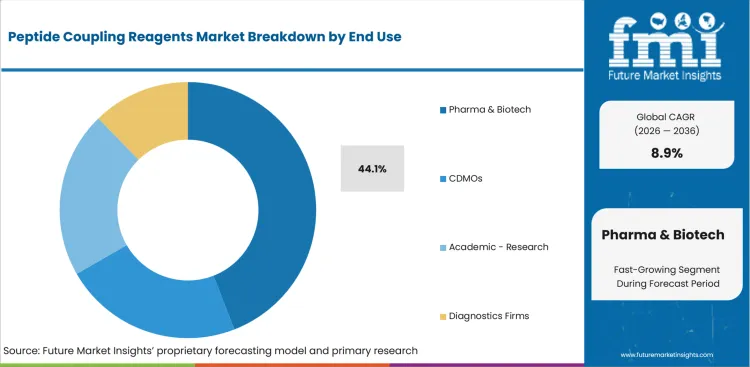
- Pharma & Biotech buyers are expected to represent 44.1% share in 2026 due to internal route design work.
- CDMOs are projected to gain share as outsourced peptide campaigns require supply continuity and technical support.
Which sales channel shows a prominent position in the peptide coupling reagents market?
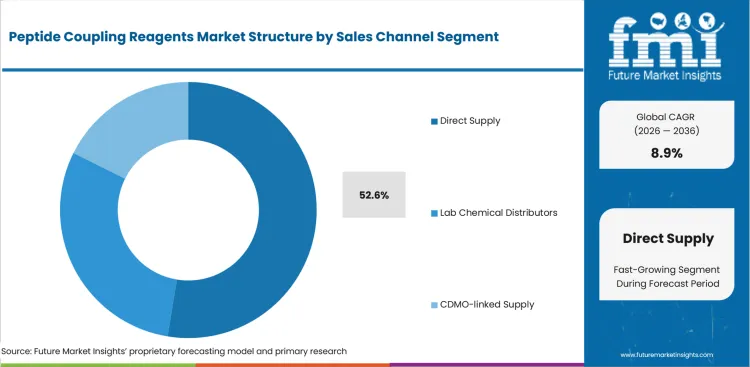
- Direct Supply is forecast to capture 52.6% share in 2026 as regulated buyers require certificates and change control.
- Lab chemical distributors remain important for research buyers that need quick access to gram-scale packs.
What are the driver, restraints, and opportunities in the peptide coupling reagents market?
Peptide drug scale-up supports demand while safety rules and solvent controls limit older reagent systems.
- Driver: GLP-1 and oncology peptide scale-up is expected to increase demand for qualified SPPS and fragment-coupling inputs.
- Restraint: HOBt-related hazard concerns are expected to limit use of older coupling systems in large regulated plants.
- Opportunity: Safer activation systems can gain adoption as buyers seek lower-risk routes and clearer impurity documentation.
Peptide API Scale-Up Raises Qualified Reagent Demand
Peptide CDMO expansion is turning coupling reagents into long-run supply inputs rather than simple catalog chemicals. CordenPharma announced EUR 900 million in peptide platform investment in July 2024, tied to long-term GLP-1 demand. This supports reagent suppliers that can provide repeatable lot quality and documented change control for scale-up programs.
HOBt Substitution Is Reshaping Reagent Selection
Safety substitution is a practical selection factor in larger synthesis rooms. Bachem notes that TBTU, HBTU and PyBOP contain potentially explosive HOBt within the molecule. This evidence supports buyer movement toward Oxyma Pure-based options and suppliers that provide clearer storage and transport documentation.
Residual Solvent Expectations Support Cleaner Route Design
Solvent control affects reagent approval even when the reagent is not part of the finished API. ICH Q3C(R9) defines residual solvents as volatile organic chemicals used or produced during manufacture. That guidance reinforces demand for reagent systems that simplify impurity review and reduce avoidable process risk.
Which countries are growing fastest in the peptide coupling reagents market?
India 10.0% CAGR, China 9.6% CAGR, United States 9.2% CAGR, South Korea 9.1% CAGR, Germany 8.7% CAGR, Japan 8.5% CAGR, United Kingdom 8.3% CAGR, France 8.0% CAGR through 2036.
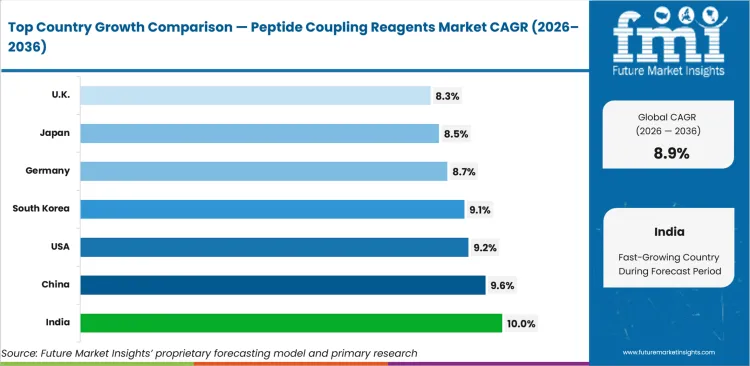
| Country | CAGR |
|---|---|
| India | 10.0% |
| China | 9.6% |
| United States | 9.2% |
| South Korea | 9.1% |
| Germany | 8.7% |
| Japan | 8.5% |
| United Kingdom | 8.3% |
| France | 8.0% |
Source: Future Market Insights, 2026.
How do country-level CAGRs compare in the peptide coupling reagents market?
- India is projected to record 10.0% CAGR by 2036 as export-oriented API capability and CDMO work support faster reagent qualification.
- China is projected to record 9.6% CAGR by 2036 as domestic drug innovation and fine chemical capacity increase local synthesis demand.
- United States is projected to record 9.2% CAGR by 2036 as research intensity and peptide manufacturing investment support direct supplier demand.
- South Korea is projected to record 9.1% CAGR by 2036 as biotech clusters and imported catalog access support specialty reagent buying.
- Germany is projected to record 8.7% CAGR by 2036 as specialty chemical knowledge and EU compliance support quality-led demand.
- Japan is projected to record 8.5% CAGR by 2036 as domestic catalog strength and high trust procurement support qualified reagent use.
- United Kingdom is projected to record 8.3% CAGR by 2036 as CDMO peptide services and life science clusters support recurring reagent purchases.
- France is projected to record 8.0% CAGR by 2036 as pharma development and research procurement sustain steady reagent consumption.
How fast is the peptide coupling reagents market growing in India?
A 10.0% CAGR through 2036 reflects country-specific peptide synthesis demand and supplier qualification needs.
Country Market Snapshot Table
| Parameter | Value |
|---|---|
| Market Size in 2025 (Value) | USD 83.6 million |
| Market Size in 2026 (Value) | USD 92.0 million |
| Market Forecast in 2036 (Value) | USD 238.6 million |
| CAGR (2026 to 2036) | 10.0% |
| Years Considered | 2021 to 2036 |
| Base Year | 2025 |
| Forecast Period | 2026 to 2036 |
| Units Considered | Value (USD million) |
| Leading Sub-Region | Hyderabad, Ahmedabad, Mumbai and Bengaluru API clusters |
India Peptide Coupling Reagents Market Outlook
India demand is shaped by export-facing API makers and wider peptide CDMO work. Buyers balance price sensitivity with documentation needs for regulated synthesis inputs.
Distributor reach remains important for research accounts, but direct technical selling is more useful for export-facing API projects.
Key Growth Drivers
- Pharma export scale creates qualified synthesis-input demand. Pharmexcil reported pharmaceutical exports of USD 30466.85 million for FY2025, reinforcing the buyer base for documented reagents.
- Regulatory activity supports route-development work for complex products. CDSCO keeps rolling new-drug approval updates for 2026, which sustains demand for process inputs used in filings.
- Direct supply gains relevance as regulated peptide projects require certificates and impurity support before route approval.
- Research labs sustain small-pack demand by screening multiple coupling systems before scale-up candidates are selected.
Key Restraints
- Import dependence can create lead-time risk for specialty activation systems. Pharmexcil reported 9.40% export growth in FY2025, increasing pressure on input reliability for export accounts.
- Premium reagent pricing can restrict use in routine research work when lower-cost activation systems meet project needs.
- Switching risk remains high after a peptide route is qualified because impurity studies may need to be repeated.
What makes India unique
India is unique because export-oriented API capability is moving into more complex peptide chemistry.
Key Companies
- Sigma-Aldrich Chemicals Pvt. Ltd.
- Thermo Fisher Scientific India Pvt. Ltd.
- TCI Chemicals India Pvt. Ltd.
- Sisco Research Laboratories Pvt. Ltd.
- Loba Chemie Pvt. Ltd.
- Spectrochem Pvt. Ltd.
Sales & Marketing Channels
- API manufacturer direct sales
- Regional chemical distributors
- Importer-led lab supply
- CDMO route qualification
- Academic procurement portals
- Technical workshops for process teams
Country Segment Breakdown Table
| Segment | Sub-Segments |
|---|---|
| By Reagent Type | Carbodiimide Reagents · Uronium / Guanidinium Reagents · Phosphonium Reagents · Additives / Other |
| By Synthesis Method | Solid Phase Peptide Synthesis · Solution Phase Synthesis · Hybrid / Fragment Coupling |
| By Application | Therapeutic Peptides · Research Peptides · Peptide APIs / CDMO · Diagnostics / Other |
| By End Use | Pharma & Biotech · CDMOs · Academic / Research · Diagnostics Firms |
| By Sales Channel | Direct Supply · Lab Chemical Distributors · CDMO-linked Supply |
| Key Sub-Regions Covered, Manufacturing and Research Corridors | Hyderabad, Ahmedabad, Mumbai and Bengaluru API clusters |
Frequently Asked Questions
How fast is India peptide coupling reagents market growing?
India is forecast to grow at 10.0% CAGR from 2026 to 2036 due to country-specific peptide synthesis demand.
Who leads India peptide coupling reagents market?
Sigma-Aldrich Chemicals Pvt. Ltd., Thermo Fisher Scientific India Pvt. Ltd., TCI Chemicals India Pvt. Ltd., and Sisco Research Laboratories Pvt. Ltd. compete through verified local or regional market presence.
What supports adoption in India peptide coupling reagents market?
Adoption is supported by peptide research, regulated process chemistry needs and supplier documentation across qualified channels.
What supports peptide coupling reagents growth in China?
A 9.6% CAGR through 2036 reflects country-specific peptide synthesis demand and supplier qualification needs.
Country Market Snapshot Table
| Parameter | Value |
|---|---|
| Market Size in 2025 (Value) | USD 191.6 million |
| Market Size in 2026 (Value) | USD 210.0 million |
| Market Forecast in 2036 (Value) | USD 525.2 million |
| CAGR (2026 to 2036) | 9.6% |
| Years Considered | 2021 to 2036 |
| Base Year | 2025 |
| Forecast Period | 2026 to 2036 |
| Units Considered | Value (USD million) |
| Leading Sub-Region | Shanghai, Suzhou, Beijing and Shenzhen fine chemical corridors |
China Peptide Coupling Reagents Market Outlook
China demand is influenced by domestic drug innovation and fine chemical manufacturing depth. Research users buy broadly, while regulated peptide API manufacturers need tighter assay proof.
Digital chemical platforms support discovery demand, although export-facing customers still require audited quality documents and batch traceability.
Key Growth Drivers
- Faster development review supports peptide research activity. NMPA announced an optimized clinical trial review process for innovative drugs in October 2025, helping development teams plan earlier synthesis work.
- Fine chemical capacity gives local buyers broader supply options. GL Biochem lists coupling reagents from its Shanghai peptide product platform, supporting reagent access for research users.
- Direct supply gains relevance as regulated peptide projects require certificates and impurity support before route approval.
- Research labs sustain small-pack demand by screening multiple coupling systems before scale-up candidates are selected.
Key Restraints
- Quality variation can restrict use by regulated peptide API buyers. Export-facing customers require documentation that meets USA and EU audits before supplier approval.
- Premium reagent pricing can restrict use in routine research work when lower-cost activation systems meet project needs.
- Switching risk remains high after a peptide route is qualified because impurity studies may need to be repeated.
What makes China unique
China is unique because demand growth and fine chemical supply depth develop in the same market.
Key Companies
- GL Biochem Shanghai Ltd.
- Nanjing Peptide Biotech Ltd.
- ChinaPeptides Co. Ltd.
- MedChemExpress China
- Merck Life Science China
- TCI Shanghai
Sales & Marketing Channels
- Direct API manufacturer sales
- Local chemical distributors
- Digital chemical platforms
- CDMO qualification routes
- Export documentation support
- Pharma park account sales
Country Segment Breakdown Table
| Segment | Sub-Segments |
|---|---|
| By Reagent Type | Carbodiimide Reagents · Uronium / Guanidinium Reagents · Phosphonium Reagents · Additives / Other |
| By Synthesis Method | Solid Phase Peptide Synthesis · Solution Phase Synthesis · Hybrid / Fragment Coupling |
| By Application | Therapeutic Peptides · Research Peptides · Peptide APIs / CDMO · Diagnostics / Other |
| By End Use | Pharma & Biotech · CDMOs · Academic / Research · Diagnostics Firms |
| By Sales Channel | Direct Supply · Lab Chemical Distributors · CDMO-linked Supply |
| Key Sub-Regions Covered, Manufacturing and Research Corridors | Shanghai, Suzhou, Beijing and Shenzhen fine chemical corridors |
Frequently Asked Questions
How fast is China peptide coupling reagents market growing?
China is forecast to grow at 9.6% CAGR from 2026 to 2036 due to country-specific peptide synthesis demand.
Who leads China peptide coupling reagents market?
GL Biochem Shanghai Ltd., Nanjing Peptide Biotech Ltd., ChinaPeptides Co. Ltd., and MedChemExpress China compete through verified local or regional market presence.
What supports adoption in China peptide coupling reagents market?
Adoption is supported by peptide research, regulated process chemistry needs and supplier documentation across qualified channels.
What is the peptide coupling reagents market outlook in the United States?
A 9.2% CAGR through 2036 reflects country-specific peptide synthesis demand and supplier qualification needs.
Country Market Snapshot Table
| Parameter | Value |
|---|---|
| Market Size in 2025 (Value) | USD 329.7 million |
| Market Size in 2026 (Value) | USD 360.0 million |
| Market Forecast in 2036 (Value) | USD 868.0 million |
| CAGR (2026 to 2036) | 9.2% |
| Years Considered | 2021 to 2036 |
| Base Year | 2025 |
| Forecast Period | 2026 to 2036 |
| Units Considered | Value (USD million) |
| Leading Sub-Region | Boston, San Diego, Bay Area and Colorado peptide manufacturing corridors |
United States Peptide Coupling Reagents Market Outlook
United States demand is shaped by pharmaceutical research intensity and peptide manufacturing investment. Regulated sponsors prefer suppliers that combine documentation with reliable technical support.
Direct supplier qualification carries greater value than simple catalog access once a peptide route moves toward GMP supply.
Key Growth Drivers
- Drug review activity supports process chemistry demand in the United States. FDA reported 46 novel drug approvals for 2025 in January 2026, reinforcing route-development work.
- Biomedical research funding sustains early peptide discovery demand. NIH reported USD 35.3 billion in fiscal year 2025 extramural grants in March 2026, supporting research reagent use.
- Direct supply gains relevance as regulated peptide projects require certificates and impurity support before route approval.
- Research labs sustain small-pack demand by screening multiple coupling systems before scale-up candidates are selected.
Key Restraints
- Safety review can limit older activation systems in larger plants. ICH Q3C(R9) defines residual solvents used or produced during manufacture, reinforcing process-control expectations.
- Premium reagent pricing can restrict use in routine research work when lower-cost activation systems meet project needs.
- Switching risk remains high after a peptide route is qualified because impurity studies may need to be repeated.
What makes United States unique
The United States is unique because research funding and peptide manufacturing investment support direct supplier qualification.
Key Companies
- MilliporeSigma
- Thermo Fisher Scientific
- CordenPharma Colorado
- PolyPeptide Laboratories San Diego
- Chem-Impex International
- Combi-Blocks Inc.
- CEM Corporation
Sales & Marketing Channels
- Direct pharma accounts
- CDMO qualification programs
- Lab chemical distributors
- Research catalog platforms
- Technical field support
- Process chemistry seminars
Country Segment Breakdown Table
| Segment | Sub-Segments |
|---|---|
| By Reagent Type | Carbodiimide Reagents · Uronium / Guanidinium Reagents · Phosphonium Reagents · Additives / Other |
| By Synthesis Method | Solid Phase Peptide Synthesis · Solution Phase Synthesis · Hybrid / Fragment Coupling |
| By Application | Therapeutic Peptides · Research Peptides · Peptide APIs / CDMO · Diagnostics / Other |
| By End Use | Pharma & Biotech · CDMOs · Academic / Research · Diagnostics Firms |
| By Sales Channel | Direct Supply · Lab Chemical Distributors · CDMO-linked Supply |
| Key Sub-Regions Covered, Manufacturing and Research Corridors | Boston, San Diego, Bay Area and Colorado peptide manufacturing corridors |
Frequently Asked Questions
How fast is United States peptide coupling reagents market growing?
United States is forecast to grow at 9.2% CAGR from 2026 to 2036 due to country-specific peptide synthesis demand.
Who leads United States peptide coupling reagents market?
MilliporeSigma, Thermo Fisher Scientific, CordenPharma Colorado, and PolyPeptide Laboratories San Diego compete through verified local or regional market presence.
What supports adoption in United States peptide coupling reagents market?
Adoption is supported by peptide research, regulated process chemistry needs and supplier documentation across qualified channels.
How is South Korea performing in the peptide coupling reagents market?
A 9.1% CAGR through 2036 reflects country-specific peptide synthesis demand and supplier qualification needs.
Country Market Snapshot Table
| Parameter | Value |
|---|---|
| Market Size in 2025 (Value) | USD 47.7 million |
| Market Size in 2026 (Value) | USD 52.0 million |
| Market Forecast in 2036 (Value) | USD 124.2 million |
| CAGR (2026 to 2036) | 9.1% |
| Years Considered | 2021 to 2036 |
| Base Year | 2025 |
| Forecast Period | 2026 to 2036 |
| Units Considered | Value (USD million) |
| Leading Sub-Region | Seoul, Daejeon, Incheon and Gyeonggi biotech corridors |
South Korea Peptide Coupling Reagents Market Outlook
South Korea demand is supported by biotech clusters and imported specialty catalogs. Buyers rely on distributor reliability because public evidence for local coupling reagent production remains limited.
Imported brands can gain stable account access when lead times and Korean-language technical files support procurement review.
Key Growth Drivers
- Regulatory transparency supports planning for drug-development suppliers. MFDS published its 2024 Drug Approval Report in July 2025, helping buyers connect reagent demand to active review workflows.
- Biotech activity supports imported specialty reagent demand. KoreaBIO reported continued bioindustry policy work in 2025, keeping peptide research suppliers focused on technical documentation.
- Direct supply gains relevance as regulated peptide projects require certificates and impurity support before route approval.
- Research labs sustain small-pack demand by screening multiple coupling systems before scale-up candidates are selected.
Key Restraints
- Import lead times can affect research continuity during tight project windows. MFDS reporting improves transparency, but reagent availability still depends on distributor supply.
- Premium reagent pricing can restrict use in routine research work when lower-cost activation systems meet project needs.
- Switching risk remains high after a peptide route is qualified because impurity studies may need to be repeated.
What makes South Korea unique
South Korea is unique because imported catalog access serves a high-science biotech market.
Key Companies
- Merck Korea
- Thermo Fisher Scientific Korea
- TCI Korea
- Peptron Inc.
- AnyGen Co. Ltd.
- Bioneer Corporation
Sales & Marketing Channels
- Import distributor networks
- Biotech direct accounts
- University procurement routes
- CRO synthesis services
- Technical documentation support
- Research catalog platforms
Country Segment Breakdown Table
| Segment | Sub-Segments |
|---|---|
| By Reagent Type | Carbodiimide Reagents · Uronium / Guanidinium Reagents · Phosphonium Reagents · Additives / Other |
| By Synthesis Method | Solid Phase Peptide Synthesis · Solution Phase Synthesis · Hybrid / Fragment Coupling |
| By Application | Therapeutic Peptides · Research Peptides · Peptide APIs / CDMO · Diagnostics / Other |
| By End Use | Pharma & Biotech · CDMOs · Academic / Research · Diagnostics Firms |
| By Sales Channel | Direct Supply · Lab Chemical Distributors · CDMO-linked Supply |
| Key Sub-Regions Covered, Manufacturing and Research Corridors | Seoul, Daejeon, Incheon and Gyeonggi biotech corridors |
Frequently Asked Questions
How fast is South Korea peptide coupling reagents market growing?
South Korea is forecast to grow at 9.1% CAGR from 2026 to 2036 due to country-specific peptide synthesis demand.
Who leads South Korea peptide coupling reagents market?
Merck Korea, Thermo Fisher Scientific Korea, TCI Korea, and Peptron Inc. compete through verified local or regional market presence.
What supports adoption in South Korea peptide coupling reagents market?
Adoption is supported by peptide research, regulated process chemistry needs and supplier documentation across qualified channels.
What is shaping peptide coupling reagents demand in Germany?
A 8.7% CAGR through 2036 reflects country-specific peptide synthesis demand and supplier qualification needs.
Country Market Snapshot Table
| Parameter | Value |
|---|---|
| Market Size in 2025 (Value) | USD 87.4 million |
| Market Size in 2026 (Value) | USD 95.0 million |
| Market Forecast in 2036 (Value) | USD 218.8 million |
| CAGR (2026 to 2036) | 8.7% |
| Years Considered | 2021 to 2036 |
| Base Year | 2025 |
| Forecast Period | 2026 to 2036 |
| Units Considered | Value (USD million) |
| Leading Sub-Region | Darmstadt, Berlin, Munich and Rhine-Main chemistry clusters |
Germany Peptide Coupling Reagents Market Outlook
Germany demand is shaped by specialty chemical know-how and EU compliance expectations. Domestic technical references help buyers evaluate safer substitutes for HOBt-related systems.
Suppliers should lead with safety substitution evidence and impurity control because German buyers review chemical handling closely.
Key Growth Drivers
- Domestic technical depth supports reagent selection discipline. Merck lists Novabiochem peptide and DNA synthesis reagents, giving German buyers a local portfolio reference.
- Pharmaceutical industry scale supports steady process chemistry demand. EFPIA reported Germany as one of Europe’s major pharmaceutical markets in May 2025, reinforcing reagent opportunities.
- Direct supply gains relevance as regulated peptide projects require certificates and impurity support before route approval.
- Research labs sustain small-pack demand by screening multiple coupling systems before scale-up candidates are selected.
Key Restraints
- Strict handling expectations can raise cost for hazardous reagent systems. ICH Q3C(R9) guidance reinforces cleaner solvent control and route design discipline.
- Premium reagent pricing can restrict use in routine research work when lower-cost activation systems meet project needs.
- Switching risk remains high after a peptide route is qualified because impurity studies may need to be repeated.
What makes Germany unique
Germany is unique because specialty chemical know-how and EU compliance shape reagent selection.
Key Companies
- Merck KGaA
- Iris Biotech GmbH
- Biosynth Germany
- Carl Roth GmbH
- Thermo Fisher Scientific Germany
- TCI Deutschland GmbH
Sales & Marketing Channels
- Direct chemical supplier accounts
- EU distributor networks
- GMP process chemistry support
- Research institute catalogs
- Safety compliance selling
- CDMO route-transfer supply
Country Segment Breakdown Table
| Segment | Sub-Segments |
|---|---|
| By Reagent Type | Carbodiimide Reagents · Uronium / Guanidinium Reagents · Phosphonium Reagents · Additives / Other |
| By Synthesis Method | Solid Phase Peptide Synthesis · Solution Phase Synthesis · Hybrid / Fragment Coupling |
| By Application | Therapeutic Peptides · Research Peptides · Peptide APIs / CDMO · Diagnostics / Other |
| By End Use | Pharma & Biotech · CDMOs · Academic / Research · Diagnostics Firms |
| By Sales Channel | Direct Supply · Lab Chemical Distributors · CDMO-linked Supply |
| Key Sub-Regions Covered, Manufacturing and Research Corridors | Darmstadt, Berlin, Munich and Rhine-Main chemistry clusters |
Frequently Asked Questions
How fast is Germany peptide coupling reagents market growing?
Germany is forecast to grow at 8.7% CAGR from 2026 to 2036 due to country-specific peptide synthesis demand.
Who leads Germany peptide coupling reagents market?
Merck KGaA, Iris Biotech GmbH, Biosynth Germany, and Carl Roth GmbH compete through verified local or regional market presence.
What supports adoption in Germany peptide coupling reagents market?
Adoption is supported by peptide research, regulated process chemistry needs and supplier documentation across qualified channels.
How is the peptide coupling reagents forecast developing in Japan?
A 8.5% CAGR through 2036 reflects country-specific peptide synthesis demand and supplier qualification needs.
Country Market Snapshot Table
| Parameter | Value |
|---|---|
| Market Size in 2025 (Value) | USD 103.2 million |
| Market Size in 2026 (Value) | USD 112.0 million |
| Market Forecast in 2036 (Value) | USD 253.2 million |
| CAGR (2026 to 2036) | 8.5% |
| Years Considered | 2021 to 2036 |
| Base Year | 2025 |
| Forecast Period | 2026 to 2036 |
| Units Considered | Value (USD million) |
| Leading Sub-Region | Tokyo, Osaka, Kyoto and Yokohama life science corridors |
Japan Peptide Coupling Reagents Market Outlook
Japan demand is influenced by high-trust procurement and domestic catalog access. Buyers prioritize supplier history and Japanese-language documentation before switching qualified reagents.
Domestic distributors can widen access, but foreign suppliers need local support that reduces switching risk for process teams.
Key Growth Drivers
- Domestic catalog access supports rapid research procurement. TCI lists peptide coupling agents in Japan, giving labs a trusted route for gram-scale reagent orders.
- Pharma market size sustains qualified synthesis demand. PMDA described Japan as the fourth-largest pharmaceutical market in Summer 2025, supporting process chemistry need.
- Direct supply gains relevance as regulated peptide projects require certificates and impurity support before route approval.
- Research labs sustain small-pack demand by screening multiple coupling systems before scale-up candidates are selected.
Key Restraints
- Conservative supplier switching slows new entrant penetration. PMDA’s 2025 update highlights Japan’s large regulated market, which raises scrutiny for new suppliers.
- Premium reagent pricing can restrict use in routine research work when lower-cost activation systems meet project needs.
- Switching risk remains high after a peptide route is qualified because impurity studies may need to be repeated.
What makes Japan unique
Japan is unique because domestic catalog trust and quality documentation guide buyer confidence.
Key Companies
- TCI Chemicals
- FUJIFILM Wako Pure Chemical Corporation
- Peptide Institute Inc.
- Merck Biopharma Japan
- Thermo Fisher Scientific Japan
- CEM Japan
Sales & Marketing Channels
- Domestic chemical catalogs
- Pharma direct supply
- University procurement systems
- Distributor technical support
- GMP documentation selling
- Process chemistry seminars
Country Segment Breakdown Table
| Segment | Sub-Segments |
|---|---|
| By Reagent Type | Carbodiimide Reagents · Uronium / Guanidinium Reagents · Phosphonium Reagents · Additives / Other |
| By Synthesis Method | Solid Phase Peptide Synthesis · Solution Phase Synthesis · Hybrid / Fragment Coupling |
| By Application | Therapeutic Peptides · Research Peptides · Peptide APIs / CDMO · Diagnostics / Other |
| By End Use | Pharma & Biotech · CDMOs · Academic / Research · Diagnostics Firms |
| By Sales Channel | Direct Supply · Lab Chemical Distributors · CDMO-linked Supply |
| Key Sub-Regions Covered, Manufacturing and Research Corridors | Tokyo, Osaka, Kyoto and Yokohama life science corridors |
Frequently Asked Questions
How fast is Japan peptide coupling reagents market growing?
Japan is forecast to grow at 8.5% CAGR from 2026 to 2036 due to country-specific peptide synthesis demand.
Who leads Japan peptide coupling reagents market?
TCI Chemicals, FUJIFILM Wako Pure Chemical Corporation, Peptide Institute Inc., and Merck Biopharma Japan compete through verified local or regional market presence.
What supports adoption in Japan peptide coupling reagents market?
Adoption is supported by peptide research, regulated process chemistry needs and supplier documentation across qualified channels.
What supports peptide coupling reagents demand in the United Kingdom?
A 8.3% CAGR through 2036 reflects country-specific peptide synthesis demand and supplier qualification needs.
Country Market Snapshot Table
| Parameter | Value |
|---|---|
| Market Size in 2025 (Value) | USD 62.8 million |
| Market Size in 2026 (Value) | USD 68.0 million |
| Market Forecast in 2036 (Value) | USD 150.9 million |
| CAGR (2026 to 2036) | 8.3% |
| Years Considered | 2021 to 2036 |
| Base Year | 2025 |
| Forecast Period | 2026 to 2036 |
| Units Considered | Value (USD million) |
| Leading Sub-Region | Cambridge, Belfast, Manchester and Oxford peptide service clusters |
United Kingdom Peptide Coupling Reagents Market Outlook
United Kingdom demand is supported by peptide service providers and strong university procurement channels. CDMO buyers need documented reagents for route transfer and client audits.
Catalog access supports research buying, while CDMO projects require qualified release data and route-specific technical advice.
Key Growth Drivers
- CDMO peptide expertise supports route-transfer demand. Almac states it has manufactured more than 12000 peptides, giving UK buyers a strong service base.
- Life science investment supports specialty reagent use. The Office for Life Sciences published competitiveness indicators in March 2026, reinforcing the policy focus on biopharma capability.
- Direct supply gains relevance as regulated peptide projects require certificates and impurity support before route approval.
- Research labs sustain small-pack demand by screening multiple coupling systems before scale-up candidates are selected.
Key Restraints
- Qualification cycles can slow reagent switching in peptide services. MHRA-regulated manufacturing practice creates added review needs for suppliers serving GMP projects.
- Premium reagent pricing can restrict use in routine research work when lower-cost activation systems meet project needs.
- Switching risk remains high after a peptide route is qualified because impurity studies may need to be repeated.
What makes United Kingdom unique
The United Kingdom is unique because peptide CDMO service capability supports route-transfer demand.
Key Companies
- Biosynth UK
- Cambridge Research Biochemicals
- Almac Sciences
- Fluorochem Ltd.
- Apollo Scientific
- Merck Life Science UK
Sales & Marketing Channels
- CDMO technical selling
- University purchasing frameworks
- Biotech direct accounts
- Life science distributors
- Process chemistry workshops
- GMP supply qualification
Country Segment Breakdown Table
| Segment | Sub-Segments |
|---|---|
| By Reagent Type | Carbodiimide Reagents · Uronium / Guanidinium Reagents · Phosphonium Reagents · Additives / Other |
| By Synthesis Method | Solid Phase Peptide Synthesis · Solution Phase Synthesis · Hybrid / Fragment Coupling |
| By Application | Therapeutic Peptides · Research Peptides · Peptide APIs / CDMO · Diagnostics / Other |
| By End Use | Pharma & Biotech · CDMOs · Academic / Research · Diagnostics Firms |
| By Sales Channel | Direct Supply · Lab Chemical Distributors · CDMO-linked Supply |
| Key Sub-Regions Covered, Manufacturing and Research Corridors | Cambridge, Belfast, Manchester and Oxford peptide service clusters |
Frequently Asked Questions
How fast is United Kingdom peptide coupling reagents market growing?
United Kingdom is forecast to grow at 8.3% CAGR from 2026 to 2036 due to country-specific peptide synthesis demand.
Who leads United Kingdom peptide coupling reagents market?
Biosynth UK, Cambridge Research Biochemicals, Almac Sciences, and Fluorochem Ltd. compete through verified local or regional market presence.
What supports adoption in United Kingdom peptide coupling reagents market?
Adoption is supported by peptide research, regulated process chemistry needs and supplier documentation across qualified channels.
How does France compare in the peptide coupling reagents market?
A 8.0% CAGR through 2036 reflects country-specific peptide synthesis demand and supplier qualification needs.
Country Market Snapshot Table
| Parameter | Value |
|---|---|
| Market Size in 2025 (Value) | USD 64.8 million |
| Market Size in 2026 (Value) | USD 70.0 million |
| Market Forecast in 2036 (Value) | USD 151.1 million |
| CAGR (2026 to 2036) | 8.0% |
| Years Considered | 2021 to 2036 |
| Base Year | 2025 |
| Forecast Period | 2026 to 2036 |
| Units Considered | Value (USD million) |
| Leading Sub-Region | Paris, Lyon, Strasbourg and Toulouse pharmaceutical research corridors |
France Peptide Coupling Reagents Market Outlook
France demand is shaped by pharma development clusters and EU chemical compliance. Research buyers need reliable small-pack supply while regulated accounts require stronger documentation.
Supplier credibility matters more than local production depth because buyers evaluate compliance, delivery reliability and application support.
Key Growth Drivers
- Drug discovery chemistry supports route-screening demand. Novalix describes a Strasbourg chemistry platform for medicinal chemistry and process support, strengthening local service access.
- European pharma scale supports recurring reagent buying. EFPIA’s May 2025 industry figures place France among major European pharmaceutical markets, reinforcing process input demand.
- Direct supply gains relevance as regulated peptide projects require certificates and impurity support before route approval.
- Research labs sustain small-pack demand by screening multiple coupling systems before scale-up candidates are selected.
Key Restraints
- Medicine pricing pressure can limit local late-stage manufacturing appetite. EFPIA’s 2025 industry figures show Europe facing competitiveness pressure, which affects investment decisions.
- Premium reagent pricing can restrict use in routine research work when lower-cost activation systems meet project needs.
- Switching risk remains high after a peptide route is qualified because impurity studies may need to be repeated.
What makes France unique
France is unique because pharma research demand relies on supplier credibility and EU documentation.
Key Companies
- Novalix
- Merck Life Science SAS
- Thermo Fisher Scientific France
- PolyPeptide France
- Biosolve Chimie
- TCI Europe
Sales & Marketing Channels
- Pharma direct accounts
- Lab distributor sales
- University research procurement
- CRO synthesis supply
- EU compliance documentation
- Biotech cluster marketing
Country Segment Breakdown Table
| Segment | Sub-Segments |
|---|---|
| By Reagent Type | Carbodiimide Reagents · Uronium / Guanidinium Reagents · Phosphonium Reagents · Additives / Other |
| By Synthesis Method | Solid Phase Peptide Synthesis · Solution Phase Synthesis · Hybrid / Fragment Coupling |
| By Application | Therapeutic Peptides · Research Peptides · Peptide APIs / CDMO · Diagnostics / Other |
| By End Use | Pharma & Biotech · CDMOs · Academic / Research · Diagnostics Firms |
| By Sales Channel | Direct Supply · Lab Chemical Distributors · CDMO-linked Supply |
| Key Sub-Regions Covered, Manufacturing and Research Corridors | Paris, Lyon, Strasbourg and Toulouse pharmaceutical research corridors |
Frequently Asked Questions
How fast is France peptide coupling reagents market growing?
France is forecast to grow at 8.0% CAGR from 2026 to 2036 due to country-specific peptide synthesis demand.
Who leads France peptide coupling reagents market?
Novalix, Merck Life Science SAS, Thermo Fisher Scientific France, and PolyPeptide France compete through verified local or regional market presence.
What supports adoption in France peptide coupling reagents market?
Adoption is supported by peptide research, regulated process chemistry needs and supplier documentation across qualified channels.
Who are the leading companies in the peptide coupling reagents market?
Merck KGaA plus Thermo Fisher Scientific and TCI Chemicals are profiled alongside Bachem, Biosynth and Iris Biotech for peptide chemistry relevance.
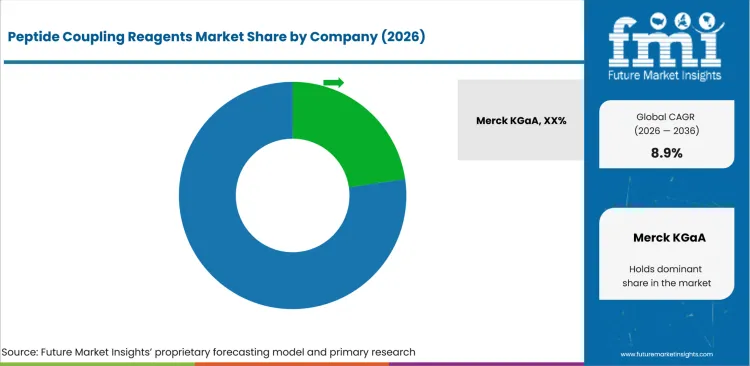
- Competition is shaped by reagent portfolio depth and buyer trust in documentation for scale-up work.
- Catalog leaders gain account access by offering HATU and HBTU plus DIC, PyBOP and COMU systems.
- Peptide specialists gain influence by advising buyers on route performance, hazard handling and impurity control.
- Workflow suppliers gain relevance when automated SPPS equipment expands reagent consumption in regulated projects.
The market includes global catalog companies, peptide chemistry specialists and workflow suppliers. Global catalog leaders compete on product breadth and distribution reach, while specialists compete on sequence-level chemistry support. Buyers compare purity, assay consistency, safety data and documentation before approving suppliers for regulated projects.
Manufacturing and service activity is strengthening the competitive base. PolyPeptide started large-scale SPPS capacity in Braine-l’Alleud in December 2024, which supports demand for qualified reagent and resin supply. Bachem’s long-term peptide supply agreement in March 2025 also reinforces the need for stable upstream inputs.
Companies with broad portfolios and technical support are better positioned because buyers need more than pack availability. Merck KGaA, Thermo Fisher Scientific and TCI Chemicals hold catalog reach, while Bachem, Biosynth and Iris Biotech add chemistry knowledge that supports difficult sequence work.
How do top peptide coupling reagents companies compare?
Companies compare most clearly by reagent portfolio and documentation strength plus peptide chemistry support and geographic service reach.
| Company | Reagent Portfolio | Documentation Depth | Channel Reach | Technical Support | Geographic Footprint |
|---|---|---|---|---|---|
| Merck KGaA | Very Strong | Very Strong | Very Strong | Strong | Global |
| Thermo Fisher Scientific | Strong | Strong | Very Strong | Moderate to Strong | Global |
| TCI Chemicals | Very Strong | Moderate to Strong | Strong | Strong | Global |
| Bachem | Moderate | Very Strong | Strong | Very Strong | Europe and United States |
| Biosynth | Strong | Strong | Strong | Strong | Europe and United States |
| Iris Biotech | Specialty Focus | Moderate to Strong | Moderate | Very Strong | Europe |
| Chem-Impex International | Strong | Moderate | Strong | Moderate | United States |
| Combi-Blocks | Research Focus | Moderate | Strong | Moderate | United States |
| CEM Corporation | Workflow Linked | Strong | Strong | Strong | Global |
Source: Future Market Insights, 2026.
Who are the key players in the peptide coupling reagents market?
The market includes global catalog leaders alongside peptide chemistry specialists and synthesis workflow suppliers.
Key global companies leading the peptide coupling reagents market include:
- Merck KGaA
- Thermo Fisher Scientific
- TCI Chemicals
- Bachem
- Biosynth
- Iris Biotech
- Chem-Impex International
- Combi-Blocks
- CEM Corporation
- PolyPeptide Group
Key Developments in Peptide Coupling Reagents Market
- In July 2024, CordenPharma committed EUR 900 million to peptide platform expansion in the United States and Europe.
- In December 2024, PolyPeptide started large-scale SPPS capacity in Braine-l’Alleud and planned ramp-up during 2025.
- In August 2025, Cambrex expanded Snapdragon Chemistry’s Waltham API facility with a new GMP suite that increased the facility footprint by 20%. The company said the site can support SPPS, LPPS, or hybrid peptide projects, while LPPS reduces solvent demand and excess reagent use versus standard SPPS.
Key Players in the Peptide Coupling Reagents Market
Global Catalog Leaders
- Merck KGaA
- Thermo Fisher Scientific
- TCI Chemicals
- Chem-Impex International
- Combi-Blocks
Peptide Chemistry Specialists
- Bachem
- Biosynth
- Iris Biotech
- PolyPeptide Group
- Almac Sciences
Workflow and Regional Suppliers
- CEM Corporation
- FUJIFILM Wako Pure Chemical Corporation
- GL Biochem Shanghai Ltd.
- Peptide Institute Inc.
- Sisco Research Laboratories Pvt. Ltd.
What is included in the peptide coupling reagents market report scope?
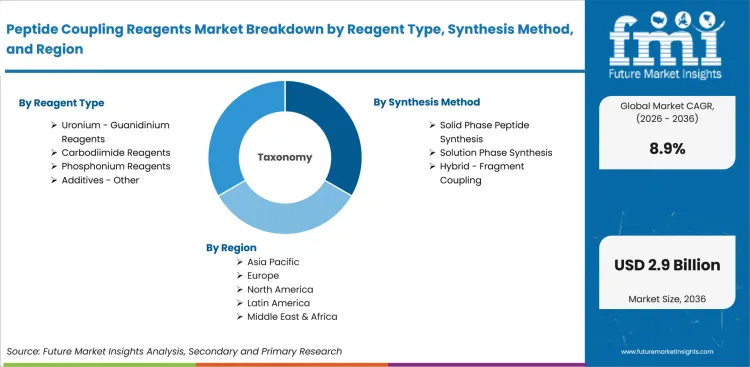
| Parameter | Details |
|---|---|
| Forecast period | 2026 to 2036 |
| Historical period | 2021 to 2025 |
| Quantitative unit | Revenue in USD Billion |
| By reagent type | Carbodiimide Reagents, Uronium / Guanidinium Reagents, Phosphonium Reagents, Additives / Other |
| By synthesis method | Solid Phase Peptide Synthesis, Solution Phase Synthesis, Hybrid / Fragment Coupling |
| By application | Therapeutic Peptides, Research Peptides, Peptide APIs / CDMO, Diagnostics / Other |
| By end use | Pharma & Biotech, CDMOs, Academic / Research, Diagnostics Firms |
| By sales channel | Direct Supply, Lab Chemical Distributors, CDMO-linked Supply |
| Regions covered | North America, Latin America, Europe, East Asia, South Asia and Pacific, Middle East and Africa |
| Countries covered | India, China, United States, South Korea, Germany, Japan, United Kingdom, France |
| Key companies profiled | Merck KGaA, Thermo Fisher Scientific, TCI Chemicals, Bachem, Biosynth, Iris Biotech, Chem-Impex International, CEM Corporation |
| Approach | Bottom-up reagent-consumption model using route mix, buyer type, country demand, supplier portfolios and pricing checks |
Source: Future Market Insights, 2026.
What is the scope and definition of the peptide coupling reagents market?
| Attribute | Detail |
|---|---|
| Market Definition | Chemicals used to activate amino acid carboxyl groups so peptide bonds form during peptide synthesis. |
| Functions Covered | Carboxyl activation, peptide bond formation, coupling acceleration, racemization control and route support. |
| Applications Covered | Therapeutic peptides, research peptides, peptide APIs, CDMO projects and selected diagnostic peptide workflows. |
| End-Use Industries | Pharma and biotech companies, CDMOs, academic research groups, diagnostics firms and specialty synthesis providers. |
| Grades Covered | Research grade, high purity grade, GMP-aligned supply and documented batch supply for regulated buyers. |
| Inclusions | Carbodiimide reagents, uronium systems, guanidinium systems, phosphonium reagents and activation additives used in peptide bond formation. |
| Exclusions | Amino acids, carrier resins, peptide synthesizer instruments, standalone solvents, finished peptide APIs, finished peptide drugs and cosmetic peptide formulations. |
How was the peptide coupling reagents market researched?
| Method | Description |
|---|---|
| Primary Research | FMI analysts reviewed buying behavior across pharma process chemistry teams, peptide CDMOs, research labs and specialty chemical distributors. |
| Desk Research | Review covered regulator data, drug approval references, company product information and peptide synthesis technical literature. |
| Market Sizing & Forecasting | The model combined reagent consumption intensity, route mix, buyer type, country demand and average selling price. |
| Data Validation | Forecasts were cross-checked against peptide synthesis services, peptide therapeutics, pharmaceutical intermediates and supplier portfolios. |
Peptide Coupling Reagents Breakdown by Reagent Type, Synthesis Method, Application, End Use, Sales Channel, and Region
Peptide Coupling Reagents Segmented by Reagent Type
- Carbodiimide Reagents
- Uronium / Guanidinium Reagents
- Phosphonium Reagents
- Additives / Other
Peptide Coupling Reagents Segmented by Synthesis Method
- Solid Phase Peptide Synthesis
- Solution Phase Synthesis
- Hybrid / Fragment Coupling
Peptide Coupling Reagents Segmented by Application
- Therapeutic Peptides
- Research Peptides
- Peptide APIs / CDMO
- Diagnostics / Other
Peptide Coupling Reagents Segmented by End Use
- Pharma & Biotech
- CDMOs
- Academic / Research
- Diagnostics Firms
Peptide Coupling Reagents Segmented by Sales Channel
- Direct Supply
- Lab Chemical Distributors
- CDMO-linked Supply
Peptide Coupling Reagents by Region
- North America
- Latin America
- Europe
- East Asia
- South Asia and Pacific
- Middle East and Africa
Research Sources and Bibliography
- USA Food and Drug Administration. (2026, January). Novel Drug Therapy Approvals for 2025. USA Food and Drug Administration.
- National Institutes of Health. (2026, March). Fiscal Year 2025 by the Numbers: Extramural Grant Investments in Research. National Institutes of Health.
- International Council for Harmonisation. (2024, January). ICH Q3C(R9) Impurities: Guideline for Residual Solvents. ICH.
- CordenPharma. (2024, July). CordenPharma invests EUR 900 million in transformational peptide platform expansion in USA and Europe. CordenPharma.
- Bachem. (2026). Efficient peptide synthesis: A guide to coupling reagents and additives. Bachem.
- PolyPeptide Group. (2024, December). Large-scale SPPS capacity in Braine-l’Alleud starts production. PolyPeptide Group.
- Iris Biotech. (2024, October). PotM: MYTsA, a novel ynamide coupling reagent. Iris Biotech.
- Pharmaceuticals Export Promotion Council of India. (2025, June). Indian Pharmaceuticals Industry Handbook 2025. Pharmexcil.
- Pharmaceuticals and Medical Devices Agency. (2025, July). PMDA Updates, Summer 2025. PMDA.
- European Federation of Pharmaceutical Industries and Associations. (2025, May). The Pharmaceutical Industry in Figures 2025. EFPIA.
- Ministry of Food and Drug Safety. (2025, July). 2024 Drug Approval Report. MFDS.
- Tokyo Chemical Industry. (2026). Peptide Coupling Agents. TCI Chemicals.
- Merck KGaA. (2026). Peptide Coupling Reagents Guide. Sigma-Aldrich.
- Almac Group. (2026). Custom Peptide Synthesis for Research Use. Almac Sciences.
- Cambrex Corporation. August 25, 2025. Cambrex Expands Peptide Manufacturing Capabilities in Waltham, Massachusetts. Cambrex.
- GL Biochem Shanghai. (2026). Reagents for Peptide Synthesis. GL Biochem Shanghai Ltd.
The bibliography uses regulator, official industry body, standards-body and company-authored sources that support evidence-backed claims inside the report.
This Report Answers
- What is the current and future value of the peptide coupling reagents market from 2026 to 2036?
- What CAGR is forecast for peptide coupling reagents across the 2026 to 2036 assessment period?
- Which reagent type is projected to lead peptide coupling reagent demand in 2026?
- Which synthesis method creates the largest consumption pool for peptide coupling reagents?
- How do therapeutic peptide pipelines and CDMO scale-up affect reagent buying behavior?
- How do HOBt safety concerns and residual solvent rules influence reagent selection?
- Which selected countries are expected to grow fastest in peptide coupling reagent demand?
- Which companies are active across coupling reagents, peptide chemistry and synthesis workflows?
- What products are included and excluded in the peptide coupling reagents scope?
- How does FMI size and validate this specialty pharma chemical market?
Frequently Asked Questions
How large is the Peptide Coupling Reagents Market expected to be in the near term?
The market is expanding as peptide synthesis moves from research toward regulated pharmaceutical and CDMO scale up.
What is the long term outlook for the Peptide Coupling Reagents Market?
The outlook remains strong as therapeutic peptide programs increase reliance on documented, high performance coupling chemistry.
How fast is the Peptide Coupling Reagents Market expected to grow?
Growth is driven by expanding peptide drug pipelines, automated synthesis adoption, and stricter quality expectations.
What is the main driver of peptide coupling reagent demand?
Demand is driven by peptide API scale up that requires reliable activation chemistry with controlled impurity profiles.
Which reagent type dominates the market?
Uronium and guanidinium reagents dominate due to their effectiveness in difficult and aggregation prone peptide couplings.
Which synthesis method generates considerable demand?
Solid phase peptide synthesis leads demand as automated workflows depend on repeatable and efficient coupling cycles.
Which application contributes most to market demand?
Therapeutic peptides lead demand because regulated drug programs require validated and traceable reagents.
Which end use segment is most important?
Pharma and biotech companies dominate as early route design and qualification drive reagent selection.
Which sales channel is most widely used?
Direct supply leads because regulated buyers require certificates, batch traceability, and change control support.
Which regions show strong demand for peptide coupling reagents?
Asia, North America, and Europe show strong demand due to peptide manufacturing investment and research intensity.
Which countries are key markets for peptide coupling reagents?
India, China, the United States, South Korea, Germany, Japan, the United Kingdom, and France are key markets.
What supports India’s leading growth momentum?
Export oriented API manufacturing and rapid CDMO expansion drive higher qualification of peptide synthesis inputs.
Why is China an important growth market?
Domestic drug innovation and strong fine chemical supply support both research and regulated peptide synthesis.
What drives demand in the United States?
High research funding and active peptide drug development sustain strong demand for qualified coupling reagents.
What restrains growth in the peptide coupling reagents market?
Safety concerns, solvent controls, and route qualification risk can limit switching from established reagent systems.
Who are the leading companies in the Peptide Coupling Reagents Market?
Leading companies include Merck KGaA, Thermo Fisher Scientific, TCI Chemicals, Bachem, Biosynth, and Iris Biotech.
Preview the report firsthand - request a free sample
Get SampleGet the brochure for pricing and purchase details.
Get PDFTable of Content
- Key Takeaways
- Market Size and CAGR
- Top Growth Driver
- Fastest Growing Segment
- Leading Region
- Key Companies
- Emerging Opportunities
- Executive Summary
- Global Market Outlook
- Demand-side Trends
- Supply-side Trends
- Technology Roadmap Analysis
- Analysis and Recommendations
- Analyst Perspective (What is happening? Why now? What should investors know?)
- Key Questions Answered
- How large is the market?
- What is the CAGR?
- What are key trends?
- Which region dominates?
- Who are the leaders?
- Market Overview
- Market Coverage / Taxonomy
- Market Definition / Scope / Limitations
- Research Methodology
- Chapter Orientation
- Analytical Lens and Working Hypotheses
- Market Structure, Signals, and Trend Drivers
- Benchmarking and Cross-market Comparability
- Market Sizing, Forecasting, and Opportunity Mapping
- Research Design and Evidence Framework
- Desk Research Programme (Secondary Evidence)
- Expert Input and Fieldwork (Primary Evidence)
- Tooling, Models, and Reference Databases
- Data Engineering and Model Build
- Quality Assurance and Audit Trail
- Market Background
- Market Dynamics (Drivers, Restraints, Opportunity, Trends)
- Scenario Forecast (Optimistic, Likely, Conservative)
- Impact Analysis
- AI Impact
- Sustainability Impact
- Regulatory Impact
- Technology Impact
- Consumer / Buyer Analysis
- Purchase Drivers
- Adoption Barriers
- Buyer Journey
- Opportunity Map Analysis
- Product Life Cycle Analysis
- Supply Chain Analysis
- Investment Feasibility Matrix
- Value Chain Analysis
- PESTLE and Porter's Analysis
- Regulatory Landscape
- Regional Parent Market Outlook
- Production and Consumption Statistics
- Import and Export Statistics
- Global Market Analysis and Forecast, 2021 to 2036
- Historical Market Size Value (USD Billion) & Volume (Unit) Analysis, 2021 to 2025
- Current and Future Market Size Value (USD Billion) & Volume (Unit) Projections, 2026 to 2036
- Y-o-Y Growth Trend Analysis
- Absolute $ Opportunity Analysis
- Global Market Pricing Analysis, 2021 to 2036
- Global Market Analysis and Forecast, By Reagent Type, 2021 to 2036
- Introduction / Key Findings
- Historical Market Size Value (USD Billion) & Volume (Unit) Analysis By Reagent Type, 2021 to 2025
- Current and Future Market Size Value (USD Billion) & Volume (Unit) Analysis and Forecast By Reagent Type, 2026 to 2036
- Uronium - Guanidinium Reagents
- Carbodiimide Reagents
- Phosphonium Reagents
- Additives - Other
- Uronium - Guanidinium Reagents
- Y-o-Y Growth Trend Analysis By Reagent Type, 2021 to 2025
- Absolute $ Opportunity Analysis By Reagent Type, 2026 to 2036
- Global Market Analysis and Forecast, By Synthesis Method, 2021 to 2036
- Introduction / Key Findings
- Historical Market Size Value (USD Billion) & Volume (Unit) Analysis By Synthesis Method, 2021 to 2025
- Current and Future Market Size Value (USD Billion) & Volume (Unit) Analysis and Forecast By Synthesis Method, 2026 to 2036
- Solid Phase Peptide Synthesis
- Solution Phase Synthesis
- Hybrid - Fragment Coupling
- Solid Phase Peptide Synthesis
- Y-o-Y Growth Trend Analysis By Synthesis Method, 2021 to 2025
- Absolute $ Opportunity Analysis By Synthesis Method, 2026 to 2036
- Global Market Analysis and Forecast, By Application, 2021 to 2036
- Introduction / Key Findings
- Historical Market Size Value (USD Billion) & Volume (Unit) Analysis By Application, 2021 to 2025
- Current and Future Market Size Value (USD Billion) & Volume (Unit) Analysis and Forecast By Application, 2026 to 2036
- Therapeutic Peptides
- Research Peptides
- Peptide APIs - CDMO
- Diagnostics - Other
- Therapeutic Peptides
- Y-o-Y Growth Trend Analysis By Application, 2021 to 2025
- Absolute $ Opportunity Analysis By Application, 2026 to 2036
- Global Market Analysis and Forecast, By End Use, 2021 to 2036
- Introduction / Key Findings
- Historical Market Size Value (USD Billion) & Volume (Unit) Analysis By End Use, 2021 to 2025
- Current and Future Market Size Value (USD Billion) & Volume (Unit) Analysis and Forecast By End Use, 2026 to 2036
- Pharma & Biotech
- CDMOs
- Academic - Research
- Diagnostics Firms
- Pharma & Biotech
- Y-o-Y Growth Trend Analysis By End Use, 2021 to 2025
- Absolute $ Opportunity Analysis By End Use, 2026 to 2036
- Global Market Analysis and Forecast, By Sales Channel, 2021 to 2036
- Introduction / Key Findings
- Historical Market Size Value (USD Billion) & Volume (Unit) Analysis By Sales Channel, 2021 to 2025
- Current and Future Market Size Value (USD Billion) & Volume (Unit) Analysis and Forecast By Sales Channel, 2026 to 2036
- Direct Supply
- Lab Chemical Distributors
- CDMO-linked Supply
- Direct Supply
- Y-o-Y Growth Trend Analysis By Sales Channel, 2021 to 2025
- Absolute $ Opportunity Analysis By Sales Channel, 2026 to 2036
- Global Market Analysis and Forecast, By Region, 2021 to 2036
- Introduction
- Historical Market Size Value (USD Billion) & Volume (Unit) Analysis By Region, 2021 to 2025
- Current Market Size Value (USD Billion) & Volume (Unit) Analysis and Forecast By Region, 2026 to 2036
- North America
- Latin America
- Western Europe
- Eastern Europe
- East Asia
- South Asia and Pacific
- Middle East & Africa
- Market Attractiveness Analysis By Region
- North America Market Analysis and Forecast, By Country, 2021 to 2036
- Historical Market Size Value (USD Billion) & Volume (Unit) Trend Analysis By Market Taxonomy, 2021 to 2025
- Market Size Value (USD Billion) & Volume (Unit) Forecast By Market Taxonomy, 2026 to 2036
- By Country
- USA
- Canada
- Mexico
- By Reagent Type
- By Synthesis Method
- By Application
- By End Use
- By Sales Channel
- By Country
- Market Attractiveness Analysis
- By Country
- By Reagent Type
- By Synthesis Method
- By Application
- By End Use
- By Sales Channel
- Key Takeaways
- Latin America Market Analysis and Forecast, By Country
- Historical Market Size Value (USD Billion) & Volume (Unit) Trend Analysis By Market Taxonomy, 2021 to 2025
- Market Size Value (USD Billion) & Volume (Unit) Forecast By Market Taxonomy, 2026 to 2036
- By Country
- Brazil
- Chile
- Rest of Latin America
- By Reagent Type
- By Synthesis Method
- By Application
- By End Use
- By Sales Channel
- By Country
- Market Attractiveness Analysis
- By Country
- By Reagent Type
- By Synthesis Method
- By Application
- By End Use
- By Sales Channel
- Key Takeaways
- Western Europe Market Analysis and Forecast, By Country
- Historical Market Size Value (USD Billion) & Volume (Unit) Trend Analysis By Market Taxonomy, 2021 to 2025
- Market Size Value (USD Billion) & Volume (Unit) Forecast By Market Taxonomy, 2026 to 2036
- By Country
- Germany
- UK
- Italy
- Spain
- France
- Nordic
- BENELUX
- Rest of Western Europe
- By Reagent Type
- By Synthesis Method
- By Application
- By End Use
- By Sales Channel
- By Country
- Market Attractiveness Analysis
- By Country
- By Reagent Type
- By Synthesis Method
- By Application
- By End Use
- By Sales Channel
- Key Takeaways
- Eastern Europe Market Analysis and Forecast, By Country
- Historical Market Size Value (USD Billion) & Volume (Unit) Trend Analysis By Market Taxonomy, 2021 to 2025
- Market Size Value (USD Billion) & Volume (Unit) Forecast By Market Taxonomy, 2026 to 2036
- By Country
- Russia
- Poland
- Hungary
- Balkan & Baltic
- Rest of Eastern Europe
- By Reagent Type
- By Synthesis Method
- By Application
- By End Use
- By Sales Channel
- By Country
- Market Attractiveness Analysis
- By Country
- By Reagent Type
- By Synthesis Method
- By Application
- By End Use
- By Sales Channel
- Key Takeaways
- East Asia Market Analysis and Forecast, By Country
- Historical Market Size Value (USD Billion) & Volume (Unit) Trend Analysis By Market Taxonomy, 2021 to 2025
- Market Size Value (USD Billion) & Volume (Unit) Forecast By Market Taxonomy, 2026 to 2036
- By Country
- China
- Japan
- South Korea
- By Reagent Type
- By Synthesis Method
- By Application
- By End Use
- By Sales Channel
- By Country
- Market Attractiveness Analysis
- By Country
- By Reagent Type
- By Synthesis Method
- By Application
- By End Use
- By Sales Channel
- Key Takeaways
- South Asia and Pacific Market Analysis and Forecast, By Country
- Historical Market Size Value (USD Billion) & Volume (Unit) Trend Analysis By Market Taxonomy, 2021 to 2025
- Market Size Value (USD Billion) & Volume (Unit) Forecast By Market Taxonomy, 2026 to 2036
- By Country
- India
- ASEAN
- Australia & New Zealand
- Rest of South Asia and Pacific
- By Reagent Type
- By Synthesis Method
- By Application
- By End Use
- By Sales Channel
- By Country
- Market Attractiveness Analysis
- By Country
- By Reagent Type
- By Synthesis Method
- By Application
- By End Use
- By Sales Channel
- Key Takeaways
- Middle East & Africa Market Analysis and Forecast, By Country
- Historical Market Size Value (USD Billion) & Volume (Unit) Trend Analysis By Market Taxonomy, 2021 to 2025
- Market Size Value (USD Billion) & Volume (Unit) Forecast By Market Taxonomy, 2026 to 2036
- By Country
- Kingdom of Saudi Arabia
- Other GCC Countries
- Türkiye
- South Africa
- Other African Union
- Rest of Middle East & Africa
- By Reagent Type
- By Synthesis Method
- By Application
- By End Use
- By Sales Channel
- By Country
- Market Attractiveness Analysis
- By Country
- By Reagent Type
- By Synthesis Method
- By Application
- By End Use
- By Sales Channel
- Key Takeaways
- Key Countries Market Analysis
- USA
- Pricing Analysis
- Market Share Analysis, 2025
- By Reagent Type
- By Synthesis Method
- By Application
- By End Use
- By Sales Channel
- Canada
- Pricing Analysis
- Market Share Analysis, 2025
- By Reagent Type
- By Synthesis Method
- By Application
- By End Use
- By Sales Channel
- Mexico
- Pricing Analysis
- Market Share Analysis, 2025
- By Reagent Type
- By Synthesis Method
- By Application
- By End Use
- By Sales Channel
- Brazil
- Pricing Analysis
- Market Share Analysis, 2025
- By Reagent Type
- By Synthesis Method
- By Application
- By End Use
- By Sales Channel
- Chile
- Pricing Analysis
- Market Share Analysis, 2025
- By Reagent Type
- By Synthesis Method
- By Application
- By End Use
- By Sales Channel
- Germany
- Pricing Analysis
- Market Share Analysis, 2025
- By Reagent Type
- By Synthesis Method
- By Application
- By End Use
- By Sales Channel
- UK
- Pricing Analysis
- Market Share Analysis, 2025
- By Reagent Type
- By Synthesis Method
- By Application
- By End Use
- By Sales Channel
- Italy
- Pricing Analysis
- Market Share Analysis, 2025
- By Reagent Type
- By Synthesis Method
- By Application
- By End Use
- By Sales Channel
- Spain
- Pricing Analysis
- Market Share Analysis, 2025
- By Reagent Type
- By Synthesis Method
- By Application
- By End Use
- By Sales Channel
- France
- Pricing Analysis
- Market Share Analysis, 2025
- By Reagent Type
- By Synthesis Method
- By Application
- By End Use
- By Sales Channel
- India
- Pricing Analysis
- Market Share Analysis, 2025
- By Reagent Type
- By Synthesis Method
- By Application
- By End Use
- By Sales Channel
- ASEAN
- Pricing Analysis
- Market Share Analysis, 2025
- By Reagent Type
- By Synthesis Method
- By Application
- By End Use
- By Sales Channel
- Australia & New Zealand
- Pricing Analysis
- Market Share Analysis, 2025
- By Reagent Type
- By Synthesis Method
- By Application
- By End Use
- By Sales Channel
- China
- Pricing Analysis
- Market Share Analysis, 2025
- By Reagent Type
- By Synthesis Method
- By Application
- By End Use
- By Sales Channel
- Japan
- Pricing Analysis
- Market Share Analysis, 2025
- By Reagent Type
- By Synthesis Method
- By Application
- By End Use
- By Sales Channel
- South Korea
- Pricing Analysis
- Market Share Analysis, 2025
- By Reagent Type
- By Synthesis Method
- By Application
- By End Use
- By Sales Channel
- Russia
- Pricing Analysis
- Market Share Analysis, 2025
- By Reagent Type
- By Synthesis Method
- By Application
- By End Use
- By Sales Channel
- Poland
- Pricing Analysis
- Market Share Analysis, 2025
- By Reagent Type
- By Synthesis Method
- By Application
- By End Use
- By Sales Channel
- Hungary
- Pricing Analysis
- Market Share Analysis, 2025
- By Reagent Type
- By Synthesis Method
- By Application
- By End Use
- By Sales Channel
- Kingdom of Saudi Arabia
- Pricing Analysis
- Market Share Analysis, 2025
- By Reagent Type
- By Synthesis Method
- By Application
- By End Use
- By Sales Channel
- Türkiye
- Pricing Analysis
- Market Share Analysis, 2025
- By Reagent Type
- By Synthesis Method
- By Application
- By End Use
- By Sales Channel
- South Africa
- Pricing Analysis
- Market Share Analysis, 2025
- By Reagent Type
- By Synthesis Method
- By Application
- By End Use
- By Sales Channel
- USA
- Market Structure Analysis
- Competition Dashboard
- Competition Benchmarking
- Market Share Analysis of Top Players
- By Regional
- By Reagent Type
- By Synthesis Method
- By Application
- By End Use
- By Sales Channel
- Emerging Startups
- Innovation Benchmarking
- Competition Analysis
- Competition Deep Dive
- Merck KGaA
- Overview
- Product Portfolio
- Profitability by Market Segments (Product/Region/Sales Channel)
- Sales Footprint
- Strategy Overview
- Marketing Strategy
- Product Strategy
- Channel Strategy
- Thermo Fisher Scientific
- TCI Chemicals
- Bachem
- Biosynth
- Iris Biotech
- Chem-Impex International
- CEM Corporation
- Merck KGaA
- Case Studies
- Success Stories
- Recent Developments
- Competition Deep Dive
- Assumptions & Acronyms Used


