
- Market Size (2026)
- USD 14.3 Bn
- Forecast (2036)
- USD 22.4 Bn
- CAGR (2026 to 2036)
- 4.6%
How big is the Personal Care Ingredient Market in 2026?
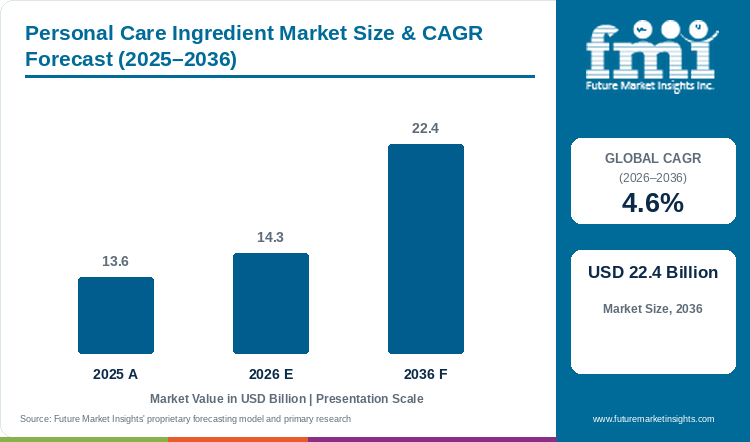
The Personal Care Ingredient Market is projected to reach USD 22.4 billion by 2036, expanding at a 4.6% CAGR from 2026 to 2036. FMI estimates the market at USD 14.3 billion in 2026. The market was valued at USD 13.6 billion in 2025. This outlook sits well below recent growth in finished beauty exports from Asia, where Korean cosmetics exports rose 12.3% to USD 11.4 billion in 2025 [9].
The difference reflects revenue mix. Functional chemistry such as surfactants and emollients is bought mainly on price, so its growth follows consumer volumes. Actives backed by clinical data command a premium and are growing faster within the same supplier portfolios. Croda's Beauty Actives sales rose 19.0% organically in January to June 2026, against 4.0% for its Beauty Care range [1].
Input cost is the main limitation on supplier margins. Galaxy Surfactants reported oleochemical feedstock near USD 2,800.0 per tonne early in the April to June 2026 quarter [19]. Prices then touched USD 3,300.0 per tonne before easing. Demand itself depends on the pace of formula launches. China's cosmetics retail sales grew 6.1% in January to September 2026, against 1.1% for all consumer goods [14]. Each new launch requires emulsifiers, thickeners and actives from ingredient suppliers.
Key Market Trends & Insights
- Actives are growing faster than commodity care chemistry, which shifts supplier revenue mix toward claim-led products. Symrise recorded double-digit organic growth in Advanced Actives and Probiotics in the third quarter of 2026, while its UV Filters line declined at a double-digit rate [22]. Ashland reported double-digit growth in biofunctional actives in its fiscal quarter to September 2026 [23]. Suppliers with clinical data behind their actives therefore retain pricing power when base volumes soften.
- US sunscreen regulation has opened to new filters for the first time since the late 1990s. The Food and Drug Administration added bemotrizinol to the over-the-counter sunscreen monograph in June 2026 at concentrations up to 6.0% [12]. US sun care brands can now reformulate with a broad-spectrum filter already used in Europe, which creates demand for tested filter blends.
- China is shortening the approval cycle for new ingredients, which improves the payback period on novel actives. The National Medical Products Administration recorded 327 registered or filed new cosmetic ingredients by the end of October 2025 [13]. Its reform plan cuts review time for high-risk product changes from 90 to 60 working days and moves ingredient safety files into company archives.
Regional Highlights
- Europe is compressing the timetable for hazardous substances while adding new producer costs. EU negotiators agreed in June 2026 that products containing newly banned CMR substances must leave the market within 6 to 12 months where no derogation is sought [20]. Cosmetics and medicine producers must also cover at least 80.0% of the cost of removing micro-pollutants from urban wastewater by the end of 2028 [21]. Suppliers with qualified replacement chemistry are positioned to capture the resulting reformulation work.
- Asia Pacific is attracting supplier investment because brand demand there is growing faster than in mature regions. Givaudan's Asia Pacific sales rose 10.6% like-for-like in January to September 2026, against 1.1% in North America [4]. Suppliers such as Dow are also using regional events for product introductions, with four functional ingredients launched at in-cosmetics Asia in Bangkok in November 2026 [29]. Regional labs and local stock shorten lead times for brands that refresh ranges every season.
Personal Care Ingredient Market Size and Forecast
Table 1: Personal Care Ingredient Market Size and Forecast
| Market size and forecast | Value |
|---|---|
| Market size in 2025 | USD 13.6 billion |
| Estimated market size in 2026 | USD 14.3 billion |
| Projected market size by 2036 | USD 22.4 billion |
| CAGR from 2026 to 2036 | 4.6% |
Source: Future Market Insights analysis of the personal care ingredient market, 2026.
Analyst Perspective
“Brand owners procure base chemistry such as surfactants and emollients primarily on price and security of supply. They pay a premium only for actives with clinical data that supports a printable claim. Suppliers that pair such actives with regional application labs hold a competitive advantage, because they shorten a brand's launch calendar. Qualification remains the main barrier. Each new ingredient requires market-specific safety files, and each reformulation adds stability testing before launch.”
- Rahul Pandita, Principal Consultant, FMI
How is the Personal Care Ingredient Market segmented?
- By product type: Emollients, Conditioning Polymers, Surfactants, Rheology Modifiers, UV Absorbers, Emulsifiers, Antimicrobials, and Others. Renewable cleansing chemistry overlaps with the bio based cosmetic surfactants market that FMI tracks separately.
- By ingredients: Natural and Synthetic.
- By application: Skincare, Make-up, Oral Care, Hair Care, Toiletries, and Others.
- By region: North America, Latin America, Western Europe, Eastern Europe, East Asia, South Asia and Pacific, and Middle East and Africa.
Why do Conditioning Polymers lead by Product Type in the Personal Care Ingredient Market in 2026?
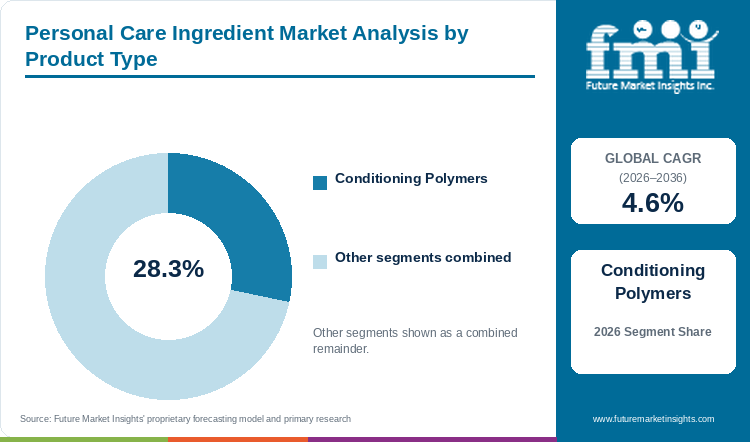
Conditioning Polymers hold 28.3% of the Personal Care Ingredient Market by product type in 2026.
Their lead rests on dosage economics in hair care. Cationic polymers and quaternary compounds deposit on the hair fibre and deliver the slip and softness that define a conditioner. Because the core benefit depends on the polymer, brands rarely reduce its dosage to save cost. Hair care volumes were firm in 2026. Brazilian hair product exports rose 29.8% to USD 301.0 million in 2025, according to the ABIHPEC trade association [16]. Supplier results point the same way, with Ashland reporting double-digit growth in hair care ingredients in its quarter to September 2026 [23].
Suppliers are reworking this chemistry for biodegradability, which protects the category as brands tighten rinse-off formulation standards. BASF presented Dehyquart S18, a readily biodegradable conditioning agent, at the SEPAWA Congress in October 2026 [2]. Grades of this type allow brands to switch formulas without a loss in conditioning performance.
Emollients, Surfactants, Rheology Modifiers, UV Absorbers, Emulsifiers, Antimicrobials and Others together hold the remaining 71.7% by product type. Most of these product types serve several applications at once, so their demand is spread across skin, sun and cleansing launches.
Table 2: Product Type, 2026 Share
| Leading Share | 2026 market share |
|---|---|
| Conditioning Polymers | 28.3% |
| All Other Segments Combined Share | 71.7% |
Source: Future Market Insights analysis of the personal care ingredient market, 2026.
Why do Natural ingredients lead by Ingredients in the Personal Care Ingredient Market in 2026?
By ingredients, Natural ingredients account for 60.4% of the Personal Care Ingredient Market in 2026.
Natural-origin claims now appear on mass and premium packs alike, which has pushed suppliers to certify the origin of their raw material base. Supplier disclosures show the scale of that shift. Croda says the majority of its organic raw materials already come from bio-based sources [5]. Its Malvallin active, launched in June 2026, is 100.0% naturally derived under ISO 16128 and holds COSMOS approval [5]. Dow's newest elastomer blend contains 97.0% bio-based carbon [29].
Certification of this kind allows a brand to print a natural-origin index on pack, which supports its price position at the shelf. Part of this demand overlaps with the upcycled cosmetic ingredients market, where by-product feedstocks serve the same natural-origin claims.
Synthetic ingredients represent the remaining 39.6%. Their position holds in preservation, silicone feel and UV protection, where synthetic chemistry still gives the most stable performance. Brands therefore keep synthetic grades wherever a natural switch would weaken a product claim.
Table 3: Ingredients, 2026 Share
| Leading Share | 2026 market share |
|---|---|
| Natural | 60.4% |
| All Other Segments Combined Share | 39.6% |
Source: Future Market Insights analysis of the personal care ingredient market, 2026.
Why does Skincare lead by Application in the Personal Care Ingredient Market in 2026?
Skincare represents 31.8% of the Personal Care Ingredient Market by application in 2026.
Skincare leads because each formula draws on the widest ingredient stack. A moisturiser or serum combines emollients, emulsifiers, thickeners, preservatives and one or more actives. That combination gives skincare the highest ingredient value per unit of any application. Official trade data confirm the weight of the category. Skincare accounted for USD 8.5 billion of Korea's USD 11.4 billion in cosmetics exports in 2025 [9]. In Germany, the IKW industry association projected 11.1% growth in skin and face care sales for 2025 [15].
Premium skincare is also where brands introduce their newest actives, which raises ingredient value per kilogram. Hindustan Unilever reported double-digit, volume-led growth in Skin Care in its September 2026 quarter, with Premium Skin Care growing in organised trade [18]. Brand growth at this level converts directly into procurement of actives and emulsifiers.
Hair Care, Toiletries, Make-up, Oral Care and Others together account for the remaining 68.2%. These applications rely more heavily on surfactants and conditioning polymers, so their ingredient spend tracks unit volumes more closely than skincare does.
Table 4: Application, 2026 Share
| Leading Share | 2026 market share |
|---|---|
| Skincare | 31.8% |
| All Other Segments Combined Share | 68.2% |
Source: Future Market Insights analysis of the personal care ingredient market, 2026.
What are the key drivers restraints and opportunities?
Personal care ingredient revenue depends on the number of formulas brands launch and on the price each formula pays for function or claims. Input costs and safety rules determine how much of that value suppliers retain.
Driver
Export-led beauty brands are adding destinations, and each destination adds ingredient grades per brand. Korean cosmetics reached 202 export markets in 2025, up from 172 a year earlier [9]. The Ministry of Trade, Industry and Resources plans 2026 programmes to support global online malls and cross-border delivery for these brands [10]. Because each market requires its own registration file and often a local formula variant, suppliers gain grade volume within every brand account.
Restraint
Raw material and energy inflation compressed supplier margins in 2026, and recovery depends on pricing power. Eastman announced price increases of about USD 500.0 million across its portfolio for the rest of 2026 to offset raw material costs [31]. Specialty suppliers can pass such costs through to customers. Smaller brands with fixed retail prices have the least room to absorb them, which can delay their launch plans.
Opportunity
Biotech and clinically tested actives offer the highest margin per kilogram in the category, because brands pay for proven claims. Clariant launched AlgaSurge, a skin longevity active, at in-cosmetics Global 2026 [26]. Claims that link skin condition and mood also connect to the neurocosmetic ingredients market. The commercial condition is clinical evidence, since brands pay a premium only after suppliers fund efficacy studies.
How do safety, environmental and competition rules affect personal care ingredient purchasing?
Hazard rules determine how long a brand can keep a formula on sale. EU co-legislators agreed in June 2026 that companies will have 6 months to stop supplying affected products once a CMR ban applies [20]. A company may request a derogation within 12 months of a new classification. The short exit window favours early reformulation, which brings ingredient switching forward.
Environmental cost rules are now as material as safety rules. The revised Urban Wastewater Treatment Directive entered into force on 1 January 2025 [21]. It requires producers of cosmetics and medicines to fund at least 80.0% of micro-pollutant removal costs by 31 December 2028, which raises the cost of rinse-off formulas. In the United States, the bemotrizinol order shows that new sunscreen filters can now clear a faster administrative process [12]. Competition enforcement adds a further exposure in concentrated supply categories such as fragrance. Givaudan's 2026 half-year accounts include litigation settlements and provisions linked to competition authorities' investigations into the fragrance industry [7].
What limits reliable personal care ingredient supply and quality?
Input cost volatility sets the first limit on reliable supply. Clariant said a conflict in the Middle East from late February 2026 created an inflationary raw material, energy and logistics environment [26]. Suppliers that buy feedstock on spot terms must then choose between thinner margins and delayed price changes. Brands reduce that exposure by qualifying a second source for core surfactants and emollients.
Plant capacity and proof of efficacy set the second limit. Innospec expects to commission efficiency upgrades at its North Carolina plant by the end of 2026 [25]. The work should raise capacity and yields across a wide range of personal care products [25]. New actives face a longer path, because brands require clinical evidence before launch. That requirement lengthens qualification and concentrates active supply among firms that can fund trials.
Where can suppliers win additional business?
Suppliers gain additional briefs by locating formulation teams close to fast-growing brands, because local labs shorten sampling and testing cycles. Large suppliers such as Lubrizol and Nouryon are building application centres in Brazil [30][24]. Fragrance offers a second route into the same accounts. Symrise is investing in additional world-scale capacity for its Globalide musk ingredient in India [3]. Musk and aroma chemicals sit inside the perfume ingredients chemicals market, so a supplier with both lines can provide scent and function to the same brand account.
Personal Care Ingredient Market by Country (2026 to 2036)
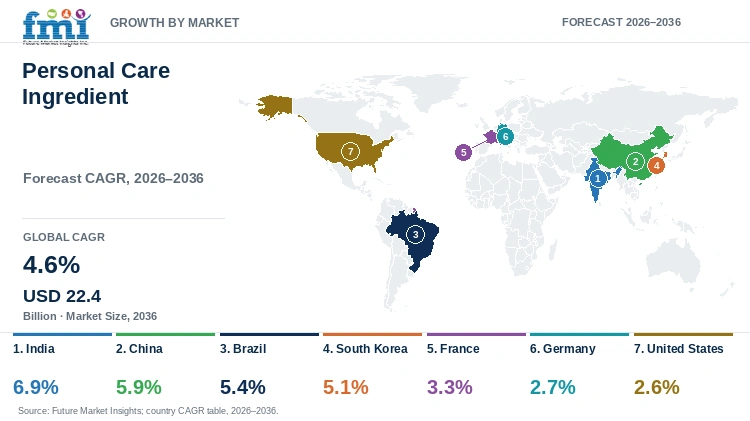
Table 5: Personal Care Ingredient Market Country Growth Forecast
| Country | CAGR, 2026 to 2036 |
|---|---|
| India | 6.9% |
| China | 5.9% |
| Brazil | 5.4% |
| South Korea | 5.1% |
| France | 3.3% |
| Germany | 2.7% |
| United States | 2.6% |
Source: Future Market Insights analysis of the personal care ingredient market, 2026.
India
India's ingredient demand is driven by volume growth at large consumer brands, which converts directly into batch-level procurement. Hindustan Unilever reported 15.0% underlying sales growth in the quarter to September 2026, with 7.0% volume growth [18]. Its Beauty and Wellbeing division grew 16.0%, and Hair Care accelerated at a double-digit rate. Personal Care grew 9.0%, led by double-digit growth in skin cleansing [18]. Each additional unit requires surfactants, conditioning polymers and emollients, so brand volume growth reaches supplier order books with little delay.
Domestic supply is responding to this demand. Galaxy Surfactants reported 11.0% growth in India volumes in its first fiscal quarter of 2026-27 [19]. It also recorded a recovery in orders from large customers after several quarters of reformulation [19]. Local production also cuts import lead times for formulators that refresh ranges often. Oleochemical feedstock volatility is the principal exposure for brands that sell small packs at low price points, because they have limited room to pass on cost increases.
Brand volume growth and new domestic capacity support a 6.9% CAGR for India between 2026 and 2036, the highest among the seven profiled countries. Suppliers with local plants and flexible feedstock sourcing are positioned to secure the next round of contracts. Value-focused brands reward partners that can hold both price and lead time. Contract terms will therefore favour suppliers that keep local stock and stable pricing through feedstock cycles.
China
China's beauty spending is outpacing its wider consumer economy, which sustains formula launch activity. The National Bureau of Statistics reported cosmetics retail sales of CNY 349.1 billion in January to September 2026, up 6.1% [14]. Total retail sales grew 1.1% over the same period. Channel structure is also shifting. Across all goods, sales at brand-exclusive stores fell 10.3% while supermarkets and convenience stores grew [14]. Online retail sales of goods rose 3.8% over the same nine months.
Regulation has been redesigned to bring new ingredients to market faster. The National Medical Products Administration recorded 327 registered or filed new cosmetic ingredients by October 2025 [13]. It also cited industry data showing a market above CNY 1.0 trillion in 2024. The NMPA plans dedicated review routes for products with new efficacy claims. Its reform plan also cuts review time for high-risk product changes from 90 to 60 working days [13]. Together these measures give local brands a faster path to market for novel actives.
Faster approvals and beauty spending ahead of total retail translate into a 5.9% CAGR for China over 2026 to 2036. Competition for these briefs now turns on sampling speed and local technical service. Suppliers without application labs in China are at a disadvantage, because local brands can register novel actives faster than before. Channel shifts away from brand-exclusive stores also favour suppliers that can support new formats at short notice.
Brazil
Brazilian personal care has developed into an export business anchored in hair care. The ABIHPEC trade association reported record sector exports of USD 1.1 billion in 2025, up 20.1% on 2024 [16]. Hair products led export categories at USD 301.0 million. Latin America accounted for about 80.0% of the total, with Argentina the single largest buyer. Soap exports rose 17.0% to USD 170.0 million. Oral care exports reached USD 115.0 million, up 6.7%. These categories widen the export base beyond hair care, which adds demand for surfactants and cleansing chemistry.
Global suppliers are investing in local application capability to serve this export base. Nouryon broke ground in December 2025 on a home and personal care innovation center in Itupeva [24]. It expects the center to be fully operational by the end of 2026, subject to local approval [24]. The company already runs nine manufacturing facilities in Brazil. Local labs shorten testing cycles for formulas designed for curly and textured hair, which Brazilian brands sell at home and across the region.
Hair care exports and new technical capacity support a 5.4% CAGR for Brazil over 2026 to 2036, ahead of the 4.6% global rate. Concentration in neighbouring markets limits that outlook, because currency swings in Argentina can change order volumes quickly. Suppliers that develop polymers for textured hair can serve Brazilian brands in both domestic and export ranges with the same grades.
South Korea
South Korea has become a major source of new skincare formulas for global retail, which makes it a design centre for ingredient demand. Korean cosmetics exports reached a record USD 11.4 billion in 2025, according to the Ministry of Food and Drug Safety [9]. The United States was the largest destination at USD 2.2 billion, ahead of China at USD 2.0 billion. Skincare accounted for USD 8.5 billion of the total.
Government policy now targets direct sales abroad. The Ministry of Trade, Industry and Resources reported exports of USD 9.4 billion in January to October 2025 [10]. It plans 2026 programmes for global online malls, delivery and payment services. Direct-to-consumer channels allow brands to test products abroad faster than retail listings permit. Each test batch draws on actives, texture agents and emulsifiers. This channel supports a 5.1% CAGR for Korean ingredient demand from 2026 to 2036, slightly above the global rate.
Export concentration limits the upside. The top ten markets accounted for 70.7% of exports in 2025 [9], so a trade dispute in one large market could slow orders quickly. Contract manufacturers that serve many brands favour suppliers that hold stock locally. Each additional destination also requires a separate registration file, which multiplies the number of formula variants a brand must source. Suppliers with application labs in Korea can feed these local formats into global launches for brands in other regions.
France
French beauty exports stalled in 2025 after a decade of steady growth. The FEBEA industry federation reported exports of EUR 22.4 billion, down 0.1% [11]. Sales to the United States fell nearly 19.0% to EUR 2.4 billion after new tariffs and a weaker dollar. Exports to other EU countries rose 4.0% to EUR 12.1 billion, lifting the EU share of French cosmetics exports to 54.3% from 51.3%.
The product mix is shifting toward fragrance, which changes the ingredient basket. Perfume exports rose 1.9% to EUR 8.0 billion and now represent about 36.0% of the total [11]. Make-up and facial care remained the largest category at EUR 11.0 billion but fell 2.1%. Shampoos and hair preparations grew 5.5% to EUR 1.5 billion. Imports grew 6.0%, led by products from South Korea and China, which raises competitive pressure on domestic brands.
High value per kilogram and flat export volumes hold France to a 3.3% CAGR between 2026 and 2036. Premium skincare houses continue to pay for advanced actives, while EU rules raise the cost of each reformulation. Faster CMR phase-outs agreed in June 2026 shorten the window for replacing affected substances [20]. Brands with large fragrance portfolios will sustain demand for aroma chemicals and fixatives, which partly offsets weaker volumes in make-up and facial care. New free trade agreements with India and Indonesia may help exporters offset softer US demand [11].
Germany
German domestic beauty demand is holding while the export business weakens. The IKW industry association projected domestic sales of EUR 23.9 billion for 2025, up 5.5% [15]. Exports were projected to fall 2.1% to EUR 11.8 billion, and IKW expects only 1.5% industry growth in 2026. Drugstores handled 53.0% of cosmetics purchases, with skin and face care leading domestic growth. IKW also reports that high energy and personnel costs narrow the room for investment at German sites [15].
Supplier consolidation is now a live prospect in the home market of two large chemical groups. BASF confirmed exploratory talks in September 2026 about a possible takeover of Evonik, with the outcome still open [8]. Evonik's Care division held 2025 sales at about the prior-year level as prices improved slightly [27]. A combination would bring a wider range of care chemistry under one owner, which would reduce supplier choice for brands that dual-source critical grades.
Mature domestic demand and high site costs hold Germany to a 2.7% CAGR for 2026 to 2036. Environmental rules add a further cost layer. The EU wastewater rules shift most micro-pollutant treatment costs onto cosmetics and medicine producers by the end of 2028 [21], and IKW has called for changes to that regime [15]. Brands with large rinse-off portfolios face the highest exposure. E-commerce is the faster-growing channel, with IKW projecting 22.5% online growth for cosmetics in 2025 and a 7.0% channel share.
United States
US brands depend heavily on imported ingredients and finished products. The Personal Care Products Council reported a 2025 trade deficit of USD 5.9 billion in personal care products [17]. Imports reached USD 21.7 billion, against exports of USD 15.8 billion. The council estimates that more than 40.0% of ingredients used in US cosmetics cannot be sourced domestically or at scale [17]. Import dependence exposes US formulators to tariff and freight costs, which limits their room for volume growth. Procurement teams therefore weigh supply security alongside price when they award ingredient contracts.
That exposure and mature volumes leave the United States with the lowest forecast of the seven profiled countries, at a 2.6% CAGR during 2026 to 2036. Supplier pricing reflects the cost pressure. Eastman still described personal care as a stable end market [31], even after raising prices across its portfolio in 2026 on raw material inflation. Stable demand with rising input costs favours suppliers that hold pricing power in specialty grades.
Sun care is the clearest new opportunity. The FDA added bemotrizinol to the list of permitted sunscreen actives in June 2026 at up to 6.0% [12]. US brands can now reformulate with a filter that has long been used in Europe. Suppliers able to deliver tested filter blends are positioned to capture much of that reformulation work, since brands need stability data before relaunching a sunscreen.
Who are the notable companies in the Personal Care Ingredient Market?
Competition in personal care ingredients divides into three commercial models. Croda and BASF supply broad ranges of functional ingredients and actives. Givaudan and Symrise combine fragrance with active beauty ingredients. Croda, Givaudan and Symrise each reported faster growth in actives or fragrance than in their base lines during 2026 [1][4][22]. That pattern indicates where pricing power sits.
Croda's Consumer Care sales rose 8.0% organically in the six months to 30 June 2026 [1]. Its strategy relies on actives, botanical extracts and local hubs such as Guangzhou [6]. BASF's Care Chemicals division sells the full range from surfactants and emulsifiers to actives and UV filters [2]. Its exploratory talks with Evonik could create a substantially larger supplier of care chemistry [8].
Givaudan grew Fragrance and Beauty sales 8.8% like-for-like in the first nine months of 2026 [4]. Its Fragrance Ingredients and Active Beauty unit declined 2.5% over the same period. Symrise's Scent and Care segment grew 5.6% organically in its latest quarter [22]. Specialty suppliers form the third model and compete in narrower niches. Ashland focuses on biofunctional actives and microbial protection [23], while Innospec and Clariant sell surfactant and care ingredient ranges alongside other chemistries [25][26]. For brand procurement teams, clinical data, regional lab support and supply security are the main points of differentiation between these suppliers.
Key Developments in the Personal Care Ingredient Market
- In March 2026, Lubrizol inaugurated a Beauty Research Institute in Brazil, which it describes as a strategic hub for beauty innovation [30].
- On 26 June 2026, Croda commissioned its Guangzhou facility, which combines Beauty Actives with Iberchem fragrance creation and production for customers in China [6].
- On 15 October 2026, Symrise announced investment in additional world-scale production capacity for its Globalide musk fragrance ingredient in India [3].
Key Players in the Personal Care Ingredient Market
- BASF SE
- Dow Inc.
- Evonik Industries AG
- Eastman Chemical Company
- Kao Corporation
- Croda International Plc
- Ashland Inc.
- Clariant AG
- The Lubrizol Corporation
- Nouryon
- ADEKA Corporation
- Innospec Inc.
- Givaudan SA
- Symrise AG
Personal Care Ingredient Market Report Scope
Table 6: Personal Care Ingredient Market Report Scope
| Coverage field | Report scope |
|---|---|
| Market definition | Functional and active ingredients sold to makers of skincare, make-up, oral care, hair care and toiletries, including emollients, conditioning polymers, surfactants, rheology modifiers, UV absorbers, emulsifiers and antimicrobials. Finished consumer products are excluded. |
| Product Type | Emollients; Conditioning Polymers; Surfactants; Rheology Modifiers; UV Absorbers; Emulsifiers; Antimicrobials; Others |
| Ingredients | Natural; Synthetic |
| Application | Skincare; Make-up; Oral Care; Hair Care; Toiletries; Others |
| Buyer groups | Multinational beauty and personal care brands; regional and independent brands; contract manufacturers |
| Regions covered | North America, Latin America, Western Europe, Eastern Europe, East Asia, South Asia and Pacific, Middle East and Africa |
| Profiled markets | India, China, Brazil, South Korea, France, Germany, United States |
| Companies covered | BASF SE; Dow Inc.; Evonik Industries AG; Eastman Chemical Company; Kao Corporation; Croda International Plc; Ashland Inc.; Clariant AG; The Lubrizol Corporation; Nouryon; ADEKA Corporation; Innospec Inc.; Givaudan SA; Symrise AG |
| Quantitative Units | USD billion |
Source: Future Market Insights analysis of the personal care ingredient market, 2026.
Personal Care Ingredient Market Research Methodology
The personal care ingredient assessment draws on regulator statistics, trade association data and supplier disclosures [9][14][15][1]. FMI measures the annual sales value of functional and active ingredients sold to personal care manufacturers. Segment values are classified by product type, ingredient origin and application. Country forecasts reflect local brand activity, regulation and supplier investment over the same 2026 to 2036 period. Finished-product sales, ingredient prices and supplier segment results are reviewed as separate measures.
Personal Care Ingredient Market by Segments
Personal Care Ingredient Market segmented by Product Type:
- Emollients
- Conditioning Polymers
- Surfactants
- Rheology Modifiers
- UV Absorbers
- Emulsifiers
- Antimicrobials
- Others
Personal Care Ingredient Market segmented by Ingredients:
- Natural
- Synthetic
Personal Care Ingredient Market segmented by Application:
- Skincare
- Make-up
- Oral Care
- Hair Care
- Toiletries
- Others
Personal Care Ingredient Market by Region
- North America
- United States
- Canada
- Latin America
- Brazil
- Mexico
- Argentina
- Chile
- Western Europe
- Germany
- France
- United Kingdom
- Italy
- Spain
- Benelux
- Nordics
- Eastern Europe
- Poland
- Czech Republic
- Romania
- Hungary
- East Asia
- China
- Japan
- South Korea
- South Asia and Pacific
- India
- ASEAN
- Australia and New Zealand
- Middle East and Africa
- GCC Countries
- South Africa
- Türkiye
- Israel
Research Sources and Bibliography
- [1] Croda International Plc. (2026, July 28). Half Year Results Announcement 2026. https://www.croda.com/en-gb/media-hub/news/general/2026-half-year-results
- [2] BASF SE. (2026, October 8). SEPAWA 2026: BASF draws inspiration from beauty rituals around the world to drive personal care innovation. https://www.basf.com/global/en/media/news-releases/2026/10/p-26-171
- [3] Symrise AG. (2026, October 15). Symrise expands global production platform for sustainable musk fragrance ingredient. https://www.symrise.com/newsroom/article/symrise-expands-global-production-platform-for-sustainable-musk-fragrance-ingredient/
- [4] Givaudan SA. (2026, October 13). 2026 Nine month sales. https://www.givaudan.com/media/media-releases/2026/2026-nine-month-sales
- [5] Croda International Plc. (2026, June 17). Croda strengthens premium beauty pipeline with next-generation skincare active Malvallin. https://www.croda.com/en-gb/media-hub/news/general/croda-strengthens-premium-beauty-pipeline-with-next-generation-skincare-active-malvallin
- [6] Croda International Plc. (2026, June 26). Croda commissions Guangzhou Hub to strengthen strategic growth and innovation in China. https://www.croda.com/en-gb/media-hub/news/general/croda-commissions-guangzhou-hub-to-strengthen-strategic-growth-and-innovation-in-china
- [7] Givaudan SA. (2026, July 23). 2026 Half-year results. https://www.givaudan.com/media/media-releases/2026/2026-half-year-results
- [8] BASF SE. (2026, September 25). BASF confirms exploratory talks regarding potential takeover of Evonik. https://www.basf.com/global/en/media/news-releases/2026/09/p-26-172
- [9] Korea.net, Korean Culture and Information Service. (2026, January 13). Year of beauty: cosmetics exports hit record USD 11.4B in 2025 (Ministry of Food and Drug Safety data).
- [10] Ministry of Trade, Industry and Resources, Republic of Korea. (2025, November 7). K-Beauty Expands Global Reach with New Export Models. https://english.motir.go.kr/eng/article/EATCLdfa319ada/2394/view
- [11] Fédération des Entreprises de la Beauté (FEBEA). (2026, February 6). Coup de frein sur les exportations de cosmétiques français en 2025. https://www.febea.fr/presse/coup-frein-exportations-cosmetiques-francais-2025-le-secteur-demeure-deuxieme-contributeur-a
- [12] U.S. Food and Drug Administration. (2026, June 9). FDA Expands Sunscreen Options for the First Time in 20 Years.
- [13] National Medical Products Administration, China. (2025, December 22). Policy Interpretation of the NMPA's Opinions on Deepening the Reform of Cosmetics Regulation and Promoting High-Quality Industry Development. https://english.nmpa.gov.cn/2025-12/22/c_1156417.htm
- [14] National Bureau of Statistics of China. (2026, October 20). Total Retail Sales of Consumer Goods from January to September 2026.
- [15] Industrieverband Körperpflege- und Waschmittel (IKW). (2025, December 3). Erneutes Wachstumsplus für die Schönheits- und Haushaltspflegebranche. https://www.ikw.org/presse/erneutes-wachstumsplus-fuer-die-schoenheits-und-haushaltspflegebranche
- [16] Associação Brasileira da Indústria de Higiene Pessoal, Perfumaria e Cosméticos (ABIHPEC). (2026). Setor de Beleza e Cuidados Pessoais bate recorde de exportações e ultrapassa US$ 1 bi, accessed 4 November 2026. https://abihpec.org.br/release/setor-de-beleza-e-cuidados-pessoais-bate-recorde-de-exportacoes-e-ultrapassa-us-1-bi/
- [17] Personal Care Products Council. (2026, April 22). International Trade: U.S. Cosmetics and Personal Care Products Trade Data. https://www.personalcarecouncil.org/issues/international-trade/
- [18] Hindustan Unilever Limited. (2026, October 28). Results for the quarter ended 30th September 2026. https://www.hul.co.in/news/press-releases/2026/results-for-the-quarter-ended-30th-september-2026/
- [19] Galaxy Surfactants Limited. (2026, August 14). Q1 FY27 Earnings Conference Call transcript. https://galaxysurfactants.com/pdf/presentations/Financial-Year-2026-27/Q1-Apr-Jun/earnings-call-transcript-q1-fy-27.pdf
- [20] European Parliament. (2026, June 17). Chemicals: deal on simplification of cosmetics, fertiliser and labelling rules.
- [21] European Parliament. (2026, March 24). Urban wastewater treatment rules' impact on pharmaceutical sector. https://www.europarl.europa.eu/news/en/agenda/plenary-news/2026-03-25/6/urban-wastewater-treatment-rules-impact-on-pharmaceutical-sector
- [22] Symrise AG. (2026, October 28). Symrise delivered strong volume-driven organic sales growth in Q3 2026 and reaffirms full-year outlook. https://www.symrise.com/newsroom/article/symrise-delivered-strong-volume-driven-organic-sales-growth-in-q3-2026-and-reaffirms-full-year-outlook/
- [23] Ashland Inc. (2026, November 3). Ashland reports fourth quarter and full-year fiscal 2026 results and issues outlook for fiscal 2027. https://investor.ashland.com/news-releases/news-release-details/ashland-reports-fourth-quarter-and-full-year-fiscal-2026-results
- [24] Nouryon. (2025, December 10). Nouryon advances South America growth strategy with new customer experience and innovation center in Brazil for its home and personal care business. https://www.nouryon.com/newsroom/news-overview/2025/nouryon-advances-south-america-growth-strategy-with-new-customer-experience-and-innovation-center-in-brazil-for-its-home-and-personal-care-business
- [25] Innospec Inc. (2026, November 3). Innospec reports third quarter 2026 financial results. https://investors.innospec.com/static-files/42846043-7761-4fd2-b285-058fb12afeef
- [26] Clariant AG. (2026, May 8). Clariant delivers resilient performance in challenging environment. https://www.clariant.com/en/Corporate/News/2026/05/Clariant-delivers-resilient-performance-in-challenging-environment
- [27] Evonik Industries AG. (2026, March 4). Evonik meets 2025 guidance, confirms 2026 earnings outlook. https://www.evonik.com/en/news/press-releases/2026/03/Q4-reporting-2025.html
- [28] Kao Corporation. (2026, August 5). Consolidated Financial Results for the Six Months Ended June 30, 2026. https://www.kao.com/content/dam/sites/kao/www-kao-com/global/en/investor-relations/pdf/kao-earnings-fy2026q2-en.pdf
- [29] Dow Inc. (2026, November 3). Dow launches four functional ingredients to advance high-performance beauty formulations at in-cosmetics Asia 2026. https://corporate.dow.com/en-us/news/press-releases/dow-launches-four-functional-ingredients-to-advance-high-performance-beauty.html
- [30] The Lubrizol Corporation. (2026, March). Lubrizol inaugurates its Beauty Research Institute in Brazil. https://www.lubrizol.com/company/news/2026/03/lubrizol-inaugurates-beauty-research-institute-in-brazil
- [31] Eastman Chemical Company. (2026, April 30). Eastman Q1 2026 Financial Results Prepared Remarks. https://s29.q4cdn.com/397220757/files/doc_financials/2026/q1/Eastman-Q1-2026-Prepared-Comments.pdf
Table of Content
Table of Content
- Key Takeaways
- Market Size and CAGR
- Top Growth Driver
- Fastest Growing Segment
- Leading Region
- Key Companies
- Emerging Opportunities
- Executive Summary
- Global Market Outlook
- Demand-side Trends
- Supply-side Trends
- Technology Roadmap Analysis
- Analysis and Recommendations
- Analyst Perspective (What is happening? Why now? What should investors know?)
- Key Questions Answered
- How large is the market?
- What is the CAGR?
- What are key trends?
- Which region dominates?
- Who are the leaders?
Read More...
- Market Overview
- Market Coverage / Taxonomy
- Market Definition / Scope / Limitations
- Research Methodology
- Chapter Orientation
- Analytical Lens and Working Hypotheses
- Market Structure, Signals, and Trend Drivers
- Benchmarking and Cross-market Comparability
- Market Sizing, Forecasting, and Opportunity Mapping
- Research Design and Evidence Framework
- Desk Research Programme (Secondary Evidence)
- Expert Input and Fieldwork (Primary Evidence)
- Tooling, Models, and Reference Databases
- Data Engineering and Model Build
- Quality Assurance and Audit Trail
- Market Background
- Market Dynamics (Drivers, Restraints, Opportunity, Trends)
- Scenario Forecast (Optimistic, Likely, Conservative)
- Impact Analysis
- AI Impact
- Sustainability Impact
- Regulatory Impact
- Technology Impact
- Consumer / Buyer Analysis
- Purchase Drivers
- Adoption Barriers
- Buyer Journey
- Opportunity Map Analysis
- Product Life Cycle Analysis
- Supply Chain Analysis
- Investment Feasibility Matrix
- Value Chain Analysis
- PESTLE and Porter's Analysis
- Regulatory Landscape
- Regional Parent Market Outlook
- Production and Consumption Statistics
- Import and Export Statistics
- Global Market Analysis and Forecast, 2021 to 2036
- Historical Market Size Value (USD Billion) Analysis, 2021 to 2025
- Current and Future Market Size Value (USD Billion) Projections, 2026 to 2036
- Y-o-Y Growth Trend Analysis
- Absolute $ Opportunity Analysis
- Global Market Pricing Analysis, 2021 to 2036
- Global Market Analysis and Forecast, By Product Type, 2021 to 2036
- Introduction / Key Findings
- Historical Market Size Value (USD Billion) Analysis By Product Type, 2021 to 2025
- Current and Future Market Size Value (USD Billion) Analysis and Forecast By Product Type, 2026 to 2036
- Emollients
- Conditioning Polymers
- Surfactants
- Rheology Modifiers
- UV Absorbers
- Emulsifiers
- Antimicrobials
- Others
- Y-o-Y Growth Trend Analysis By Product Type, 2021 to 2025
- Absolute $ Opportunity Analysis By Product Type, 2026 to 2036
- Global Market Analysis and Forecast, By Ingredients, 2021 to 2036
- Introduction / Key Findings
- Historical Market Size Value (USD Billion) Analysis By Ingredients, 2021 to 2025
- Current and Future Market Size Value (USD Billion) Analysis and Forecast By Ingredients, 2026 to 2036
- Natural
- Synthetic
- Y-o-Y Growth Trend Analysis By Ingredients, 2021 to 2025
- Absolute $ Opportunity Analysis By Ingredients, 2026 to 2036
- Global Market Analysis and Forecast, By Application, 2021 to 2036
- Introduction / Key Findings
- Historical Market Size Value (USD Billion) Analysis By Application, 2021 to 2025
- Current and Future Market Size Value (USD Billion) Analysis and Forecast By Application, 2026 to 2036
- Skincare
- Make-up
- Oral Care
- Hair Care
- Toiletries
- Others
- Y-o-Y Growth Trend Analysis By Application, 2021 to 2025
- Absolute $ Opportunity Analysis By Application, 2026 to 2036
- Global Market Analysis and Forecast, By Region, 2021 to 2036
- Introduction
- Historical Market Size Value (USD Billion) Analysis By Region, 2021 to 2025
- Current Market Size Value (USD Billion) Analysis and Forecast By Region, 2026 to 2036
- North America
- Latin America
- Western Europe
- Eastern Europe
- East Asia
- South Asia and Pacific
- Middle East and Africa
- Market Attractiveness Analysis By Region
- North America Market Analysis and Forecast, By Country, 2021 to 2036
- Historical Market Size Value (USD Billion) Trend Analysis By Market Taxonomy, 2021 to 2025
- Market Size Value (USD Billion) Forecast By Market Taxonomy, 2026 to 2036
- By Country
- United States
- Canada
- By Product Type
- By Ingredients
- By Application
- By Country
- Market Attractiveness Analysis
- By Country
- By Product Type
- By Ingredients
- By Application
- Key Takeaways
- Latin America Market Analysis and Forecast, By Country
- Historical Market Size Value (USD Billion) Trend Analysis By Market Taxonomy, 2021 to 2025
- Market Size Value (USD Billion) Forecast By Market Taxonomy, 2026 to 2036
- By Country
- Brazil
- Mexico
- Argentina
- Chile
- By Product Type
- By Ingredients
- By Application
- By Country
- Market Attractiveness Analysis
- By Country
- By Product Type
- By Ingredients
- By Application
- Key Takeaways
- Western Europe Market Analysis and Forecast, By Country
- Historical Market Size Value (USD Billion) Trend Analysis By Market Taxonomy, 2021 to 2025
- Market Size Value (USD Billion) Forecast By Market Taxonomy, 2026 to 2036
- By Country
- Germany
- France
- United Kingdom
- Italy
- Spain
- Benelux
- Nordics
- By Product Type
- By Ingredients
- By Application
- By Country
- Market Attractiveness Analysis
- By Country
- By Product Type
- By Ingredients
- By Application
- Key Takeaways
- Eastern Europe Market Analysis and Forecast, By Country
- Historical Market Size Value (USD Billion) Trend Analysis By Market Taxonomy, 2021 to 2025
- Market Size Value (USD Billion) Forecast By Market Taxonomy, 2026 to 2036
- By Country
- Poland
- Czech Republic
- Romania
- Hungary
- By Product Type
- By Ingredients
- By Application
- By Country
- Market Attractiveness Analysis
- By Country
- By Product Type
- By Ingredients
- By Application
- Key Takeaways
- East Asia Market Analysis and Forecast, By Country
- Historical Market Size Value (USD Billion) Trend Analysis By Market Taxonomy, 2021 to 2025
- Market Size Value (USD Billion) Forecast By Market Taxonomy, 2026 to 2036
- By Country
- China
- Japan
- South Korea
- By Product Type
- By Ingredients
- By Application
- By Country
- Market Attractiveness Analysis
- By Country
- By Product Type
- By Ingredients
- By Application
- Key Takeaways
- South Asia and Pacific Market Analysis and Forecast, By Country
- Historical Market Size Value (USD Billion) Trend Analysis By Market Taxonomy, 2021 to 2025
- Market Size Value (USD Billion) Forecast By Market Taxonomy, 2026 to 2036
- By Country
- India
- ASEAN
- Australia and New Zealand
- By Product Type
- By Ingredients
- By Application
- By Country
- Market Attractiveness Analysis
- By Country
- By Product Type
- By Ingredients
- By Application
- Key Takeaways
- Middle East and Africa Market Analysis and Forecast, By Country
- Historical Market Size Value (USD Billion) Trend Analysis By Market Taxonomy, 2021 to 2025
- Market Size Value (USD Billion) Forecast By Market Taxonomy, 2026 to 2036
- By Country
- GCC Countries
- South Africa
- Türkiye
- Israel
- By Product Type
- By Ingredients
- By Application
- By Country
- Market Attractiveness Analysis
- By Country
- By Product Type
- By Ingredients
- By Application
- Key Takeaways
- Key Countries Market Analysis
- United States
- Pricing Analysis
- Market Share Analysis, 2025
- By Product Type
- By Ingredients
- By Application
- Canada
- Pricing Analysis
- Market Share Analysis, 2025
- By Product Type
- By Ingredients
- By Application
- Mexico
- Pricing Analysis
- Market Share Analysis, 2025
- By Product Type
- By Ingredients
- By Application
- Brazil
- Pricing Analysis
- Market Share Analysis, 2025
- By Product Type
- By Ingredients
- By Application
- Chile
- Pricing Analysis
- Market Share Analysis, 2025
- By Product Type
- By Ingredients
- By Application
- Germany
- Pricing Analysis
- Market Share Analysis, 2025
- By Product Type
- By Ingredients
- By Application
- United Kingdom
- Pricing Analysis
- Market Share Analysis, 2025
- By Product Type
- By Ingredients
- By Application
- Italy
- Pricing Analysis
- Market Share Analysis, 2025
- By Product Type
- By Ingredients
- By Application
- Spain
- Pricing Analysis
- Market Share Analysis, 2025
- By Product Type
- By Ingredients
- By Application
- France
- Pricing Analysis
- Market Share Analysis, 2025
- By Product Type
- By Ingredients
- By Application
- India
- Pricing Analysis
- Market Share Analysis, 2025
- By Product Type
- By Ingredients
- By Application
- ASEAN
- Pricing Analysis
- Market Share Analysis, 2025
- By Product Type
- By Ingredients
- By Application
- Australia and New Zealand
- Pricing Analysis
- Market Share Analysis, 2025
- By Product Type
- By Ingredients
- By Application
- China
- Pricing Analysis
- Market Share Analysis, 2025
- By Product Type
- By Ingredients
- By Application
- Japan
- Pricing Analysis
- Market Share Analysis, 2025
- By Product Type
- By Ingredients
- By Application
- South Korea
- Pricing Analysis
- Market Share Analysis, 2025
- By Product Type
- By Ingredients
- By Application
- Poland
- Pricing Analysis
- Market Share Analysis, 2025
- By Product Type
- By Ingredients
- By Application
- Hungary
- Pricing Analysis
- Market Share Analysis, 2025
- By Product Type
- By Ingredients
- By Application
- Türkiye
- Pricing Analysis
- Market Share Analysis, 2025
- By Product Type
- By Ingredients
- By Application
- South Africa
- Pricing Analysis
- Market Share Analysis, 2025
- By Product Type
- By Ingredients
- By Application
- United States
- Market Structure Analysis
- Competition Dashboard
- Competition Benchmarking
- Market Share Analysis of Top Players
- By Regional
- By Product Type
- By Ingredients
- By Application
- Emerging Startups
- Innovation Benchmarking
- Competition Analysis
- Competition Deep Dive
- Croda International Plc
- Overview
- Product Portfolio
- Profitability by Market Segments
- Sales Footprint
- Strategy Overview
- Marketing Strategy
- Product Strategy
- Channel Strategy
- BASF SE
- Givaudan SA
- Symrise AG
- Ashland Inc.
- Dow Inc.
- Evonik Industries AG
- Eastman Chemical Company
- Kao Corporation
- Clariant AG
- The Lubrizol Corporation
- Nouryon
- ADEKA Corporation
- Innospec Inc.
- Croda International Plc
- Case Studies
- Success Stories
- Recent Developments
- Competition Deep Dive
- Assumptions & Acronyms Used
List of Tables
- Table 1: Global Market Value (USD Billion) Forecast by Region, 2021 to 2036
- Table 2: Global Market Value (USD Billion) Forecast by Product Type, 2021 to 2036
- Table 3: Global Market Value (USD Billion) Forecast by Ingredients, 2021 to 2036
- Table 4: Global Market Value (USD Billion) Forecast by Application, 2021 to 2036
- Table 5: North America Market Value (USD Billion) Forecast by Country, 2021 to 2036
- Table 6: North America Market Value (USD Billion) Forecast by Product Type, 2021 to 2036
- Table 7: North America Market Value (USD Billion) Forecast by Ingredients, 2021 to 2036
- Table 8: North America Market Value (USD Billion) Forecast by Application, 2021 to 2036
- Table 9: Latin America Market Value (USD Billion) Forecast by Country, 2021 to 2036
- Table 10: Latin America Market Value (USD Billion) Forecast by Product Type, 2021 to 2036
- Table 11: Latin America Market Value (USD Billion) Forecast by Ingredients, 2021 to 2036
- Table 12: Latin America Market Value (USD Billion) Forecast by Application, 2021 to 2036
- Table 13: Western Europe Market Value (USD Billion) Forecast by Country, 2021 to 2036
- Table 14: Western Europe Market Value (USD Billion) Forecast by Product Type, 2021 to 2036
- Table 15: Western Europe Market Value (USD Billion) Forecast by Ingredients, 2021 to 2036
- Table 16: Western Europe Market Value (USD Billion) Forecast by Application, 2021 to 2036
- Table 17: Eastern Europe Market Value (USD Billion) Forecast by Country, 2021 to 2036
- Table 18: Eastern Europe Market Value (USD Billion) Forecast by Product Type, 2021 to 2036
- Table 19: Eastern Europe Market Value (USD Billion) Forecast by Ingredients, 2021 to 2036
- Table 20: Eastern Europe Market Value (USD Billion) Forecast by Application, 2021 to 2036
- Table 21: East Asia Market Value (USD Billion) Forecast by Country, 2021 to 2036
- Table 22: East Asia Market Value (USD Billion) Forecast by Product Type, 2021 to 2036
- Table 23: East Asia Market Value (USD Billion) Forecast by Ingredients, 2021 to 2036
- Table 24: East Asia Market Value (USD Billion) Forecast by Application, 2021 to 2036
- Table 25: South Asia and Pacific Market Value (USD Billion) Forecast by Country, 2021 to 2036
- Table 26: South Asia and Pacific Market Value (USD Billion) Forecast by Product Type, 2021 to 2036
- Table 27: South Asia and Pacific Market Value (USD Billion) Forecast by Ingredients, 2021 to 2036
- Table 28: South Asia and Pacific Market Value (USD Billion) Forecast by Application, 2021 to 2036
- Table 29: Middle East and Africa Market Value (USD Billion) Forecast by Country, 2021 to 2036
- Table 30: Middle East and Africa Market Value (USD Billion) Forecast by Product Type, 2021 to 2036
- Table 31: Middle East and Africa Market Value (USD Billion) Forecast by Ingredients, 2021 to 2036
- Table 32: Middle East and Africa Market Value (USD Billion) Forecast by Application, 2021 to 2036
List of Figures
- Figure 1: Global Market Pricing Analysis
- Figure 2: Global Market Value (USD Billion) Forecast 2021-2036
- Figure 3: Global Market Value Share and BPS Analysis by Product Type, 2026 and 2036
- Figure 4: Global Market Y-o-Y Growth Comparison by Product Type, 2026-2036
- Figure 5: Global Market Attractiveness Analysis by Product Type
- Figure 6: Global Market Value Share and BPS Analysis by Ingredients, 2026 and 2036
- Figure 7: Global Market Y-o-Y Growth Comparison by Ingredients, 2026-2036
- Figure 8: Global Market Attractiveness Analysis by Ingredients
- Figure 9: Global Market Value Share and BPS Analysis by Application, 2026 and 2036
- Figure 10: Global Market Y-o-Y Growth Comparison by Application, 2026-2036
- Figure 11: Global Market Attractiveness Analysis by Application
- Figure 12: Global Market Value (USD Billion) Share and BPS Analysis by Region, 2026 and 2036
- Figure 13: Global Market Y-o-Y Growth Comparison by Region, 2026-2036
- Figure 14: Global Market Attractiveness Analysis by Region
- Figure 15: North America Market Incremental Dollar Opportunity, 2026-2036
- Figure 16: Latin America Market Incremental Dollar Opportunity, 2026-2036
- Figure 17: Western Europe Market Incremental Dollar Opportunity, 2026-2036
- Figure 18: Eastern Europe Market Incremental Dollar Opportunity, 2026-2036
- Figure 19: East Asia Market Incremental Dollar Opportunity, 2026-2036
- Figure 20: South Asia and Pacific Market Incremental Dollar Opportunity, 2026-2036
- Figure 21: Middle East and Africa Market Incremental Dollar Opportunity, 2026-2036
- Figure 22: North America Market Value Share and BPS Analysis by Country, 2026 and 2036
- Figure 23: North America Market Value Share and BPS Analysis by Product Type, 2026 and 2036
- Figure 24: North America Market Y-o-Y Growth Comparison by Product Type, 2026-2036
- Figure 25: North America Market Attractiveness Analysis by Product Type
- Figure 26: North America Market Value Share and BPS Analysis by Ingredients, 2026 and 2036
- Figure 27: North America Market Y-o-Y Growth Comparison by Ingredients, 2026-2036
- Figure 28: North America Market Attractiveness Analysis by Ingredients
- Figure 29: North America Market Value Share and BPS Analysis by Application, 2026 and 2036
- Figure 30: North America Market Y-o-Y Growth Comparison by Application, 2026-2036
- Figure 31: North America Market Attractiveness Analysis by Application
- Figure 32: Latin America Market Value Share and BPS Analysis by Country, 2026 and 2036
- Figure 33: Latin America Market Value Share and BPS Analysis by Product Type, 2026 and 2036
- Figure 34: Latin America Market Y-o-Y Growth Comparison by Product Type, 2026-2036
- Figure 35: Latin America Market Attractiveness Analysis by Product Type
- Figure 36: Latin America Market Value Share and BPS Analysis by Ingredients, 2026 and 2036
- Figure 37: Latin America Market Y-o-Y Growth Comparison by Ingredients, 2026-2036
- Figure 38: Latin America Market Attractiveness Analysis by Ingredients
- Figure 39: Latin America Market Value Share and BPS Analysis by Application, 2026 and 2036
- Figure 40: Latin America Market Y-o-Y Growth Comparison by Application, 2026-2036
- Figure 41: Latin America Market Attractiveness Analysis by Application
- Figure 42: Western Europe Market Value Share and BPS Analysis by Country, 2026 and 2036
- Figure 43: Western Europe Market Value Share and BPS Analysis by Product Type, 2026 and 2036
- Figure 44: Western Europe Market Y-o-Y Growth Comparison by Product Type, 2026-2036
- Figure 45: Western Europe Market Attractiveness Analysis by Product Type
- Figure 46: Western Europe Market Value Share and BPS Analysis by Ingredients, 2026 and 2036
- Figure 47: Western Europe Market Y-o-Y Growth Comparison by Ingredients, 2026-2036
- Figure 48: Western Europe Market Attractiveness Analysis by Ingredients
- Figure 49: Western Europe Market Value Share and BPS Analysis by Application, 2026 and 2036
- Figure 50: Western Europe Market Y-o-Y Growth Comparison by Application, 2026-2036
- Figure 51: Western Europe Market Attractiveness Analysis by Application
- Figure 52: Eastern Europe Market Value Share and BPS Analysis by Country, 2026 and 2036
- Figure 53: Eastern Europe Market Value Share and BPS Analysis by Product Type, 2026 and 2036
- Figure 54: Eastern Europe Market Y-o-Y Growth Comparison by Product Type, 2026-2036
- Figure 55: Eastern Europe Market Attractiveness Analysis by Product Type
- Figure 56: Eastern Europe Market Value Share and BPS Analysis by Ingredients, 2026 and 2036
- Figure 57: Eastern Europe Market Y-o-Y Growth Comparison by Ingredients, 2026-2036
- Figure 58: Eastern Europe Market Attractiveness Analysis by Ingredients
- Figure 59: Eastern Europe Market Value Share and BPS Analysis by Application, 2026 and 2036
- Figure 60: Eastern Europe Market Y-o-Y Growth Comparison by Application, 2026-2036
- Figure 61: Eastern Europe Market Attractiveness Analysis by Application
- Figure 62: East Asia Market Value Share and BPS Analysis by Country, 2026 and 2036
- Figure 63: East Asia Market Value Share and BPS Analysis by Product Type, 2026 and 2036
- Figure 64: East Asia Market Y-o-Y Growth Comparison by Product Type, 2026-2036
- Figure 65: East Asia Market Attractiveness Analysis by Product Type
- Figure 66: East Asia Market Value Share and BPS Analysis by Ingredients, 2026 and 2036
- Figure 67: East Asia Market Y-o-Y Growth Comparison by Ingredients, 2026-2036
- Figure 68: East Asia Market Attractiveness Analysis by Ingredients
- Figure 69: East Asia Market Value Share and BPS Analysis by Application, 2026 and 2036
- Figure 70: East Asia Market Y-o-Y Growth Comparison by Application, 2026-2036
- Figure 71: East Asia Market Attractiveness Analysis by Application
- Figure 72: South Asia and Pacific Market Value Share and BPS Analysis by Country, 2026 and 2036
- Figure 73: South Asia and Pacific Market Value Share and BPS Analysis by Product Type, 2026 and 2036
- Figure 74: South Asia and Pacific Market Y-o-Y Growth Comparison by Product Type, 2026-2036
- Figure 75: South Asia and Pacific Market Attractiveness Analysis by Product Type
- Figure 76: South Asia and Pacific Market Value Share and BPS Analysis by Ingredients, 2026 and 2036
- Figure 77: South Asia and Pacific Market Y-o-Y Growth Comparison by Ingredients, 2026-2036
- Figure 78: South Asia and Pacific Market Attractiveness Analysis by Ingredients
- Figure 79: South Asia and Pacific Market Value Share and BPS Analysis by Application, 2026 and 2036
- Figure 80: South Asia and Pacific Market Y-o-Y Growth Comparison by Application, 2026-2036
- Figure 81: South Asia and Pacific Market Attractiveness Analysis by Application
- Figure 82: Middle East and Africa Market Value Share and BPS Analysis by Country, 2026 and 2036
- Figure 83: Middle East and Africa Market Value Share and BPS Analysis by Product Type, 2026 and 2036
- Figure 84: Middle East and Africa Market Y-o-Y Growth Comparison by Product Type, 2026-2036
- Figure 85: Middle East and Africa Market Attractiveness Analysis by Product Type
- Figure 86: Middle East and Africa Market Value Share and BPS Analysis by Ingredients, 2026 and 2036
- Figure 87: Middle East and Africa Market Y-o-Y Growth Comparison by Ingredients, 2026-2036
- Figure 88: Middle East and Africa Market Attractiveness Analysis by Ingredients
- Figure 89: Middle East and Africa Market Value Share and BPS Analysis by Application, 2026 and 2036
- Figure 90: Middle East and Africa Market Y-o-Y Growth Comparison by Application, 2026-2036
- Figure 91: Middle East and Africa Market Attractiveness Analysis by Application
- Figure 92: Global Market - Tier Structure Analysis
- Figure 93: Global Market - Company Share Analysis
Frequently Asked Questions
How big is the personal care ingredient market in 2026?
FMI estimates the market at USD 14.3 billion in 2026, up from USD 13.6 billion in 2025. It is projected to reach USD 22.4 billion by 2036 at a 4.6% CAGR.
Which product type leads the personal care ingredient market in 2026?
Conditioning Polymers lead by product type with 28.3% in 2026. All other product types together hold 71.7%.
Which ingredient origin and application lead in 2026?
Natural ingredients hold 60.4% by ingredients and Skincare holds 31.8% by application in FMI's 2026 assessment.
Which country is forecast to grow fastest through 2036?
India has the highest forecast CAGR at 6.9% during 2026 to 2036, followed by China at 5.9%. These are FMI forecasts and are not rates reported by the cited public bodies.
How does the new US sunscreen filter affect ingredient demand?
The FDA added bemotrizinol to the permitted sunscreen actives in June 2026 at up to 6.0% [12]. US sun care brands can now reformulate with a broad-spectrum filter that was not previously permitted in the United States.
Preview the report firsthand - request a free sample
Get SampleGet the brochure for pricing and purchase details.
Get PDF
