

- Market Size (2026)
- USD 45.0 Mn
- Forecast (2036)
- USD 90.0 Mn
- CAGR (2026 to 2036)
- 7.2%
How big is Plant-Based Seafood Binding Ingredients Market in 2026?
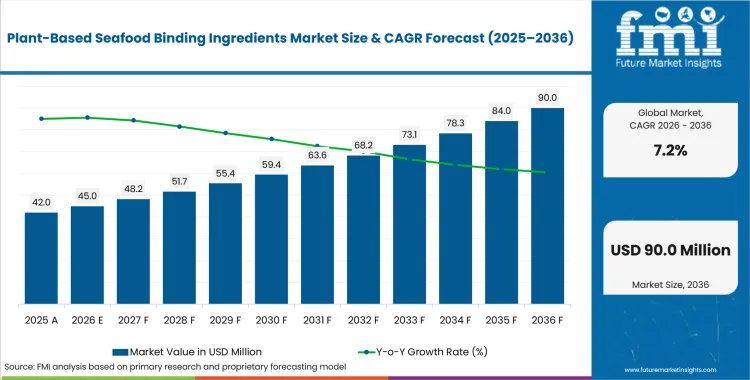
USD 45.0 million in 2026 and USD 90.0 million by 2036 at a 7.2% CAGR.
Sales of plant-based seafood binding ingredients are estimated to rise at 7.2% CAGR through 2036, increasing valuation from USD 45.0 million in 2026 to USD 90.0 million by 2036. Protein setting creates bite and flake structure across formed portions that must remain cohesive during freezing and cooking. Starches and hydrocolloids manage water release that otherwise produces cracked surfaces or dry interiors during reheating. The Good Food Institute reported in January 2026 that global plant-based meat and seafood retail sales reached USD 6.6 billion during 2025. Global plant-based meat and seafood sales provide a commercial testing base for binder performance across several plant-based fish formats. Repeat orders depend on formulas that improve cooking yield without adding difficult dispersion steps across full manufacturing lines.
United States developers validate frozen formats across national retail programs and contract manufacturing lines with different equipment. Japanese manufacturers also use public demonstration programs that connect food-technology projects with commercialization trials and domestic production. Japan’s agriculture ministry opened a food-technology business demonstration program in February 2025 for selected commercialization projects. Commercialization trials require binding systems that tolerate different mixers and cooking lines without altering the intended texture or declared ingredient list. Each route requires technical files that match local labels and production methods rather than one global formulation package. Application support for food hydrocolloids must connect ingredient behavior with regional equipment and consumer texture expectations.
Key Takeaways of Plant-Based Seafood Binding Ingredients Market
- Formulation demand centers on ingredients that preserve shape and moisture through freezing and final cooking across several plant-based seafood formats.
- Proteins are expected to lead product type demand with 28.0% share in 2026, supported by combined nutrition and structure across formed seafood alternatives.
- Bakery is anticipated to capture 22.0% share in 2026 across application demand, owing to breaded and baked formats that require reliable coating adhesion.
- North America is estimated to hold 34.0% of regional demand in 2026, underpinned by broad ingredient access and established formulation support.
- High ingredient dosage and inconsistent sensory performance can restrict repeat orders despite acceptable shape retention across commercial processing and final preparation.
- Cargill and Ingredion compete through broad starch portfolios; Roquette and Kerry emphasize plant proteins; Tate & Lyle, IFF, Ashland, and BENEO contribute hydrocolloids or pulse ingredients.
Analyst Perspective
“Plant-based seafood loses commercial value if a binder protects shape but leaves a dry or rubbery bite. Ingredient developers must balance protein setting with water retention under the exact freezing and cooking conditions used by each manufacturer. Strong portfolios shorten scale-up through clear dosage guidance and test results that remain stable across storage and reheating.”
- Nandini Roy Choudhury, Principal Analyst, Future Market Insights
How is the Plant-Based Seafood Binding Ingredients Market segmented?
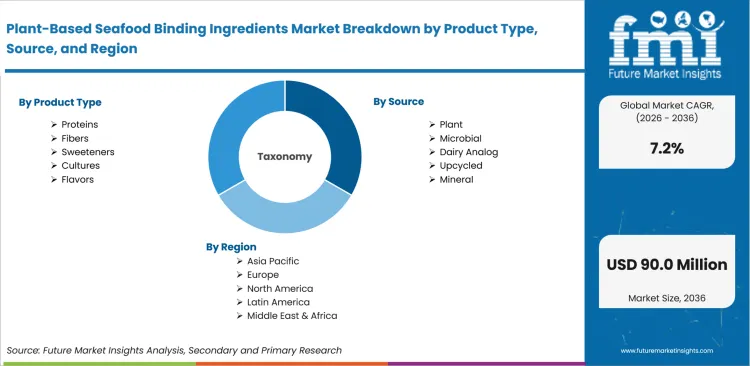
The plant-based seafood binding ingredients industry is segmented by product type, source, application, end user, and region.
Product type distinguishes proteins, fibers, sweeteners, cultures, and flavors according to the main function supplied within a formulation. Source separates plant, microbial, dairy analog, upcycled, and mineral inputs according to origin and ingredient declaration. Application covers bakery, beverages, snacks, infant nutrition, and ready meals according to the finished format receiving the binding system. End-user analysis identifies food manufacturers, beverage manufacturers, foodservice operators, contract manufacturers, and retail brands according to who specifies or purchases the ingredient. Regional analysis compares North America, Latin America, Western Europe, Eastern Europe, East Asia, South Asia and Pacific, and the Middle East and Africa. Country assessment reviews local ingredient access and labeling routes relevant to plant-based seafood binder qualification and commercial adoption.
Why do proteins hold the largest product type share?
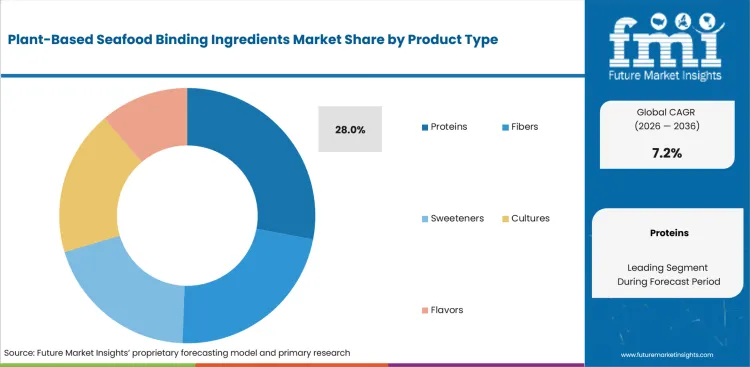
Protein systems supply structure and nutrition in flakes or formed portions that require a cohesive bite during cooking. Roquette launched NUTRALYS Pea 850F in February 2026 with high emulsion capacity and moderate gelling performance. The official release also describes a cleaner taste profile that addresses off-notes associated with concentrated pea protein. Plant-based seafood formulators combine pea protein ingredients with starches or hydrocolloids to balance hydration and thermal setting.
- Based on product type, proteins are projected to account for 28.0% in 2026 due to combined structure and nutrition. Protein concentration influences bite and flake definition across patties or formed seafood portions during commercial cooking. Broad use across several product formats supports the segment position without requiring one specialized binding mechanism.
- Manufacturers adopt protein systems that hydrate consistently across frozen storage and final cooking on commercial equipment. Application teams compare water absorption with thermal setting to limit edge fracture and concentrated pea flavor. Reliable batch performance reduces reformulation risk and supports repeat ingredient contracts across production sites with different mixing and cooking controls.
How does plant sourcing shape the source category?
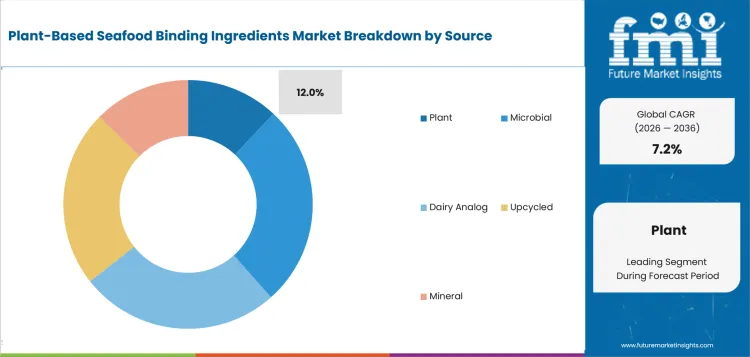
Plant-derived proteins and starches give formulators several routes to manage cohesion and moisture under familiar ingredient declarations. Roquette introduced AMYSTA L 123 in October 2025 as soluble pea starch made without enzymatic or chemical modification. The official release describes low viscosity and smooth dispersibility that support predictable dosing in powdered formulations. Food starch systems can then support coating adhesion or water control across selected plant-based seafood recipes.
- Plant-derived ingredients are projected to hold 12.0% share in 2026 owing to familiar labels and flexible formulation routes. Pea and wheat proteins can pair with potato or tapioca starches according to texture targets and regional availability. Multiple crop routes also reduce dependence on one functional ingredient during commercial scale-up across production sites.
- Commercial use depends on consistent crop quality and predictable hydration across ingredient lots supplied throughout the year. Plant inputs differ in flavor and water absorption according to crop type and processing method. Manufacturers require origin records and pilot trials that confirm equivalent performance on their mixing and cooking equipment through seasonal crop changes.
Why does bakery hold the largest application share?
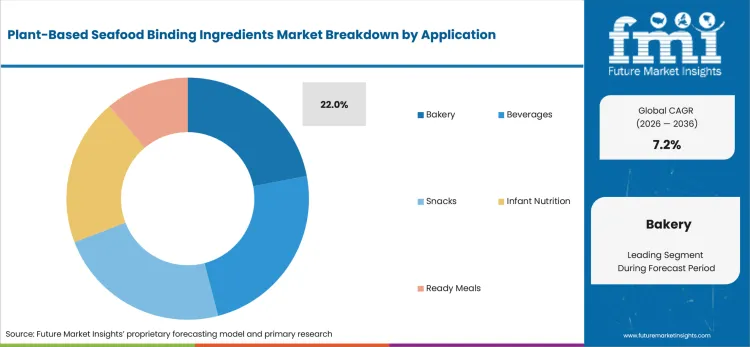
Baked and breaded seafood alternatives need cohesive centers plus reliable coating adhesion during handling and oven heating. IFF announced a bake-stable citrus pectin in September 2025 that can support coating adhesion and heat-stable texture in baked seafood alternatives. The ingredient links mouthfeel and label-friendly texture during sustained heat exposure across oven-cooked seafood formats.
- Bakery is set to lead the application category with 22.0% share in 2026 due to repeated binding needs across baked centers. Gradual structure development supports clean cutting and controlled expansion across retail or foodservice products during commercial baking. Stable reheating performance also protects product shape throughout distribution and final preparation across several serving formats.
- Baked formats expose dryness and edge fracture more clearly than fried products during storage or reheating. Formulators balance protein setting with starch or hydrocolloid moisture retention to avoid rubbery bite and heavy coating layers. Validated baking instructions support adoption by preserving cohesion across different ovens and commercial production speeds during varied batch sizes.
What makes food manufacturers central to the end-user category?
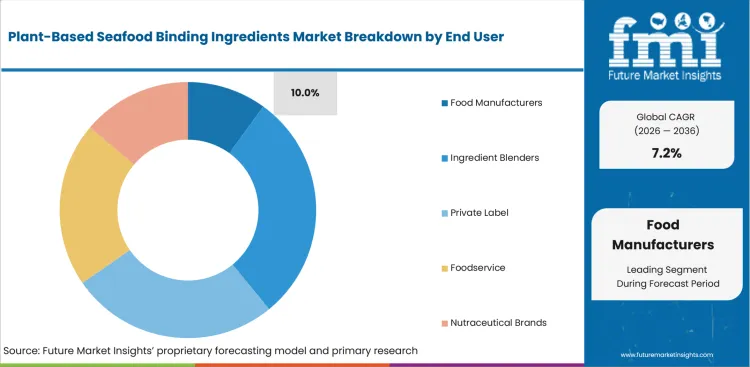
Food manufacturers control formula approval and equipment trials for seafood alternatives entering full commercial production. Ashland appointed Tilley Distribution as its exclusive United States food and beverage ingredient distributor in October 2025. The agreement covers methylcellulose and other cellulosic hydrocolloids used for texture management across food applications. Modified starch systems provide another route to control viscosity and yield during scale-up across several manufacturing sites. Direct distribution and technical service reduce delays in sample access and formulation troubleshooting during plant trials.
- The food manufacturers segment is likely to capture 10.0% share in 2026 attributable to direct control over formula approval. Plant teams compare ingredient cost with mixing time and finished-product breakage during formal trials on operating equipment. Their decisions shape formulation design and line economics across commercial production or transfers between manufacturing sites.
- Manufacturers adopt binding systems through staged trials that compare sensory quality with line performance under defined processing conditions. Difficult dispersion or narrow operating tolerance causes rejection despite acceptable laboratory performance in controlled formulations. Application support becomes decisive as plants transfer one recipe across sites using different equipment and control settings.
What are the drivers, restraints, and opportunities in the Plant-Based Seafood Binding Ingredients Market?
Wider seafood-format development raises binding demand, although ingredient dosage and sensory gaps restrict repeat purchases. Validated protein and hydrocolloid blends create an opening for shorter trial cycles and more consistent production across manufacturing sites.
- Driver: New seafood formats require binding systems that protect cohesion and moisture across freezing plus final cooking on commercial equipment.
- Restraint: Taste gaps and high ingredient dosage reduce repeat purchases despite acceptable shape retention during manufacturing and preparation.
- Opportunity: Validated protein and hydrocolloid blends can shorten trial cycles through clearer operating ranges and precise substitution guidance.
New seafood formats create different binding requirements across patties and flaked products with distinct water-retention targets. GFI Europe’s June 2026 analysis recorded a 13.7% increase in United Kingdom plant-based seafood volume during 2025. The category result shows that seafood alternatives can gain volume amid weaker performance across broader plant-based foods. Carrageenan gum and related binders support this route through moisture control during freezing and cooking. Ingredient companies gain repeat orders through format-specific validation that measures breakage and cooking yield on commercial equipment.
Finished products can retain shape yet lose repeat purchases through dry texture or unfamiliar taste during normal meals. The June 2026 GFI Europe analysis recorded a 29.4% decline in German plant-based seafood sales volume during 2025. The decline shows that ingredient access cannot offset weak taste and texture performance across retail seafood alternatives. Binding systems must improve bite and moisture retention without raising dosage costs or complicating ingredient declarations. Commercial adoption weakens if added ingredient cost exceeds measurable gains in yield or repeat purchasing.
Blended systems create a practical opening for ingredient companies that connect raw materials with line-level troubleshooting. Ingredion explained in February 2026 how plant science and application testing improve consistency across starch functionality. The approach supports binding development through predictable crop traits instead of repeated corrections for variable ingredient behavior. Manufacturers can also evaluate methyl cellulose for thermal setting within blends that reduce total dosage. Commercial value centers on validated combinations with clear dispersion guidance and documented substitution limits across several seafood formats.
Which country CAGRs are profiled in the Plant-Based Seafood Binding Ingredients Market?
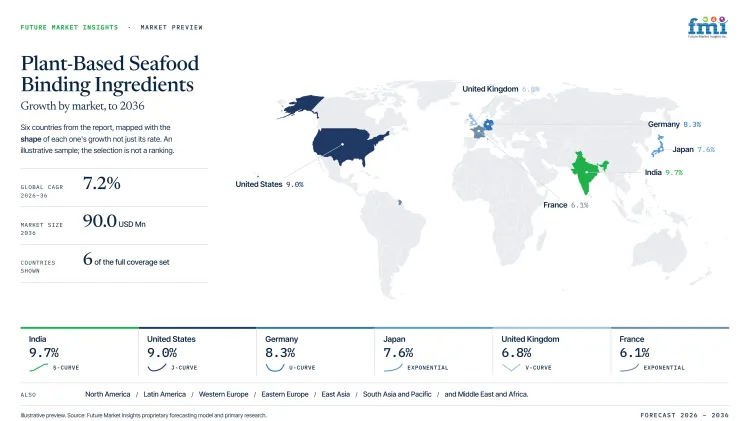
| Country | CAGR |
|---|---|
| India | 9.7% |
| United States | 9.0% |
| Germany | 8.3% |
| Japan | 7.6% |
| United Kingdom | 6.8% |
| France | 6.1% |
How do country-level CAGRs compare in the Plant-Based Seafood Binding Ingredients Market?
The country comparison spans 3.6 percentage points and separates expansion markets from more established retail environments. India and the United States form the upper group through different regulatory and product-development routes. Germany and Japan occupy the middle range with strong technical capacity but different validation systems. The United Kingdom and France record steadier rates as category recovery and price competitiveness shape commercial activity. Country forecasts therefore reflect local formulation capacity and market access rather than one global demand pattern.
- India defines the upper position through a formal vegan-label route that creates a scheduled packaging transition for approved products.
- The United States remains 0.7 percentage points below India and combines broad ingredient access with demanding retail performance requirements.
- Germany remains lower and pairs local pulse processing with extensive formulation support for commercial development.
- Japan follows Germany through coordinated commercialization programs and careful process validation for unfamiliar seafood formats.
- The United Kingdom remains 0.8 points below Japan and combines seafood-format growth with pressure across the wider plant-based category.
- France follows and combines stronger category volumes with a persistent price premium against animal-based alternatives.
Comparable growth rates create different entry requirements across labeling and manufacturing support within each national route. The full report provides country-level CAGR analysis across North America, Latin America, Europe, East Asia, South Asia, Oceania and the Middle East and Africa.
Country-wise Analysis
- India regulates vegan claims through a formal approval and package-logo route that affects finished products using plant-derived ingredients. Plant-based seafood binding ingredient demand in India is forecast to rise at 9.7% CAGR over the forecast period, supported by a defined vegan-label route. The Food Safety and Standards Authority of India notified amended vegan-food regulations in May 2026 that take effect on July 1, 2027. The amendment gives manufacturers a fixed date for new logo artwork and approval-file changes across relevant launches. Regulatory clarity supports local formula planning, but the transition can create packaging rework near the effective date. Ingredient companies need documentation support and small-batch trials that reflect local equipment and preferred fried seafood formats.
- United States manufacturers access specialized proteins and hydrocolloids through national distributors and established food-application laboratories. Frozen retail infrastructure supports commercial product trials across patties and breaded centers under several cooking conditions. Plant-based seafood binding ingredient sales in the United States are forecast to expand at 9.0% CAGR by 2036, aided by broad development capacity. The FDA issued draft guidance in January 2025 that explicitly included plant-based seafood alternatives within its labeling scope. The guidance gives developers a clearer naming framework but requires labels that identify the product’s plant source and distinguish it from conventional seafood. Taste gaps and ingredient premiums remain material frictions despite successful trials on commercial manufacturing equipment. Manufacturers need line-level yield evidence and product-specific sensory validation prior to expansion across national facilities.
- Germany combines specialized ingredient manufacturing with application laboratories that support alternative-protein formulation across established food-processing clusters. The German plant-based seafood binding ingredients sector is projected to record 8.3% CAGR during the assessment period, reinforced by localized pulse processing. BENEO inaugurated a pulse-processing plant in Obrigheim during April 2025 that converts local faba beans into protein concentrate and starch-rich flour. The facility strengthens domestic access to pulse fractions used for structure and water management in alternative-protein recipes. Retail price pressure and cautious repeat purchasing remain material frictions for unfamiliar seafood alternatives entering commercial launches. Ingredient companies need proof that improved texture protects finished-product economics across retail and foodservice channels.
- Japan uses coordinated food-technology programs and compact manufacturing lines to commercialize unfamiliar alternative-protein formats in domestic markets. Domestic production experience supports local application trials for binders across tuna-style and fried seafood alternatives. Adoption of plant-based seafood binding ingredients in Japan is estimated to expand at 7.6% CAGR through 2036, influenced by structured validation. Nippon Ham reported in February 2025 that its Miyazaki plant produced plant-based tuna alongside other seafood alternatives. The official account describes documented changes to mixing order and temperature control during commercial scale-up. Careful quality review and consumer testing can extend development schedules for unfamiliar products entering national retail. Ingredient companies need detailed processing specifications and Japanese-language technical support for each manufacturing route across domestic sites.
- United Kingdom retailers maintain plant-based ranges with separate routes for frozen and chilled seafood alternatives. The United Kingdom’s plant-based seafood binding ingredients outlook is anticipated to advance at 6.8% CAGR over the assessment period, shaped by product renewal. A June 2026 GFI Europe analysis recorded an 8.5% increase in United Kingdom plant-based seafood unit sales during 2025. The category gain gives developers a stronger basis for renewed seafood formats but does not remove taste and price pressure. Established ingredient distribution supports trials across brands and contract manufacturers serving several national retail formats. Shelf-space limits and household price sensitivity remain material frictions for unfamiliar seafood alternatives across national launches. Binding companies need measurable cooking yield and sensory gains that support retailer renewal decisions and wider distribution.
- France combines improving plant-based food volumes with strict consumer expectations for price and recognizable product quality. Active retail development supports product trials across chilled foods and other alternative-protein categories within major retail chains. France’s plant-based seafood binding ingredients market is estimated to post 6.1% CAGR over the forecast period, reflecting stronger retail activity. GFI Europe's June 2026 release recorded a 13.3% increase in French plant-based food volume during 2025. The same release found that plant-based options cost 25% more per kilogram than animal-based meat during 2025. Improving category volume supports wider formulation work, but the price gap restricts high-dosage binding systems. Local adoption favors efficient blends that perform across common equipment and familiar seafood formats at regional production sites.
Who are the notable companies in the Plant-Based Seafood Binding Ingredients Market?
Cargill, Ingredion, Roquette, Tate & Lyle, IFF, Kerry, Ashland, and BENEO are notable companies shaping this market.
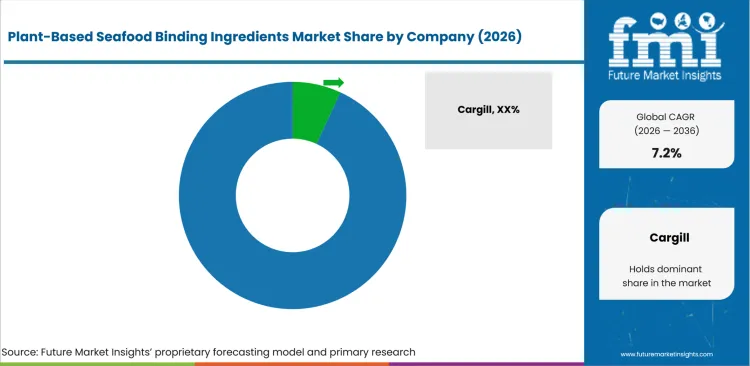
Competition brings together broad ingredient groups and specialists in plant proteins or hydrocolloids for structured seafood alternatives. Cargill and Ingredion combine starch systems with application networks across several food categories and manufacturing regions. Roquette and Kerry contribute plant-protein expertise alongside sensory or formulation support for alternative-protein products at commercial scale. Tate & Lyle and IFF provide hydrocolloid portfolios that address gelation and water control across structured foods. Ashland supplies cellulosic systems and BENEO contributes pulse-derived proteins and starch-rich flour across structured food formulations. Broader ingredient portfolios compete through formulation depth and service coverage rather than one isolated raw material. Commercial differentiation depends on regional distribution and reproducible texture across seafood formats with distinct processing requirements.
- Cargill and Ingredion combine starch systems with plant-protein capabilities across broad food portfolios and international application networks. Their commercial position rests on formulation breadth and technical programs that connect binding performance with production yield across several manufacturing conditions during multi-site scale-up.
- Roquette and Kerry emphasize plant proteins alongside application support for alternative-protein products across several finished-food formats. Their competitive role depends on balancing nutrition and hydration with flavor control across distinct seafood shapes and production methods during commercial validation across regional production sites.
- Tate & Lyle and IFF bring hydrocolloid systems; Ashland contributes cellulosic binders and BENEO supplies pulse-based ingredients. Tate & Lyle, IFF, Ashland, and BENEO compete through thermal gelation and water control across structured products facing freezing or reheating. Ingredient selection therefore depends on dosage efficiency and technical support that protects product performance during commercial scale-up.
Competitive Benchmarking: Plant-Based Seafood Binding Ingredients Market
| Company | Plant Protein Capability | Starch and Hydrocolloid Binding | Application and Scale-Up Support | Geographic Reach |
|---|---|---|---|---|
| Cargill | High | High | High | Global |
| Ingredion | High | High | High | Global |
| Roquette | High | High | High | Global |
| Tate & Lyle | Medium | High | High | Global |
| IFF | High | High | High | Global |
| Kerry | High | Medium | High | Global |
| Ashland | Low | High | Medium | Global |
| BENEO | High | Medium | High | Global |
Key Developments in the Plant-Based Seafood Binding Ingredients Market
- In July 2025, Ingredion presented texture and nutrition systems through its Texture Equation framework at IFT FIRST. The framework combines consumer insight with technical expertise and tailored ingredient systems for defined eating experiences. Plant-based seafood teams can apply that testing route to cohesion and moisture management during commercial scale-up. The development expands integrated texture work rather than promoting one ingredient across every formulation challenge.
- In July 2025, Tate & Lyle introduced its expanded portfolio and a Mouthfeel Lab during IFT FIRST. The combined portfolio included pectin and carrageenan alongside gums and modified starches for targeted texture development. The development expands multi-ingredient testing for gel strength and water binding across structured foods during pilot formulation. Plant-based seafood teams can compare binding combinations under defined production conditions during commercial scale-up across regional facilities.
- In March 2026, Roquette inaugurated a starch and polyol pilot center at its Lianyungang plant. The facility combines physicochemical analysis with laboratory research and pilot-scale industrial transformation across more than 1,000 square meters. The center links customer requirements with prototype work and scale-up validation for starch systems during customer programs. Plant-based seafood manufacturers gain a clearer testing route for processing stability and production conditions prior to commercialization.
- In September 2025, Kerry launched Smart Taste to combine flavor expertise with food science across cost and regulatory challenges. The platform includes masking and mouthfeel capabilities that address off-notes associated with plant-protein formulations during commercial development. Plant-based seafood developers can pair those functions with binding systems that require stronger sensory acceptance. The launch links texture performance with finished-product taste across alternative-protein programs entering commercial production at scale.
Key Players in the Plant-Based Seafood Binding Ingredients Market
Broad Ingredient and Starch Providers
- Cargill
- Ingredion
- Tate & Lyle
Plant Protein and Formulation Providers
- Roquette
- Kerry
- BENEO
Hydrocolloid and Cellulosic Specialists
- IFF
- Ashland
Plant-Based Seafood Binding Ingredients Market - Report Scope
| Coverage field | Report scope |
|---|---|
| Market breakdown | Product type, source, application, end user, and region. |
| Quantitative Units | Revenue in USD Million, CAGR in %. |
| Market Definition | Commercial demand for ingredients used to bind and stabilize plant-based seafood formulations across defined product types, sources, applications, and end users. |
| Regions Covered | North America, Latin America, Western Europe, Eastern Europe, East Asia, South Asia and Pacific, and Middle East and Africa. |
| Countries Covered | India, United States, Germany, Japan, United Kingdom, France, and 30+ countries. |
| Key Companies Profiled | Cargill, Ingredion, Roquette, Tate & Lyle, IFF, Kerry, Ashland, and BENEO. |
| Forecast Period | 2026 to 2036. |
| Approach | Hybrid bottom-up and top-down market sizing supported by primary interviews and official desk research. |
Plant-Based Seafood Binding Ingredients Market - Research Methodology
| Method | Approach |
|---|---|
| Primary Research | FMI analysts gathered input from manufacturers, service providers, technology developers, distributors, end users, procurement teams, and subject-matter experts. Interviews examined purchasing decisions, product or service evaluation, adoption barriers, approval requirements, pricing considerations, and expectations for technical or commercial support. Respondents were also asked what evidence is required before a trial, pilot, or initial order develops into regular purchasing. |
| Desk Research | Desk research covered government statistics, regulatory publications, trade data, industry associations, technical literature, standards, company filings, product information, and official corporate announcements. Sources were reviewed for relevance, publication date, geographic coverage, and consistency with the defined market scope. Claims relating to performance, applications, approvals, capacity, investment, and commercial activity were retained only when supported by credible public evidence. |
| Market Sizing and Forecasting | The market model combined the baseline value with historical performance, segment structure, pricing and volume indicators, adoption levels, company participation, and country-level demand conditions. Forecast assumptions considered economic activity, investment trends, regulatory developments, technology adoption, purchasing cycles, supply availability, and barriers to wider market use. Segment and regional estimates were reconciled before the final market total was calculated. |
| Data Validation | Estimates were checked against multiple independent indicators, including public data, company activity, trade patterns, industry developments, and findings from primary interviews. Validation also tested whether products, services, applications, and company revenues fell within the defined market boundaries. Adjacent categories, unsupported claims, overlapping revenues, and activities without direct market relevance were excluded to reduce double counting and maintain consistency across segments and countries. |
Plant-Based Seafood Binding Ingredients Market by Segments
Plant-Based Seafood Binding Ingredients Market segmented by Product Type:
- Proteins
- Fibers
- Sweeteners
- Cultures
- Flavors
Plant-Based Seafood Binding Ingredients Market segmented by Source:
- Plant
- Microbial
- Dairy Analog
- Upcycled
- Mineral
Plant-Based Seafood Binding Ingredients Market segmented by Application:
- Bakery
- Beverages
- Snacks
- Infant Nutrition
- Ready Meals
Plant-Based Seafood Binding Ingredients Market segmented by End User:
- Food Manufacturers
- Beverage Manufacturers
- Foodservice Operators
- Contract Manufacturers
- Retail Brands
Plant-Based Seafood Binding Ingredients Market by Region:
- North America
- United States
- Canada
- Latin America
- Brazil
- Mexico
- Argentina
- Chile
- Western Europe
- Germany
- France
- United Kingdom
- Italy
- Spain
- Benelux
- Nordics
- Eastern Europe
- Poland
- Czech Republic
- Romania
- Hungary
- East Asia
- China
- Japan
- South Korea
- South Asia and Pacific
- India
- ASEAN
- Australia and New Zealand
- Middle East and Africa
- GCC Countries
- South Africa
- Türkiye
- Israel
Research Sources and Bibliography
- The Good Food Institute. (2026, January 28). State of the Industry: Plant-based meat, seafood, eggs, dairy, and ingredients.
- USA Food and Drug Administration. (2025, January 6). Draft Guidance for Industry: Labeling of Plant-Based Alternatives to Animal-Derived Foods.
- Ministry of Agriculture, Forestry and Fisheries. (2025, February 21).
- Roquette. (2026, February 23). Launch of Breakthrough Clean-Tasting Pea Protein Isolate.
- Roquette. (2025, October 31). AMYSTA™ L 123, the New Label-Friendly Soluble Pea Starch.
- IFF. (2025, September 2). IFF tackles top challenges in baking at IBIE 2025.
- Ashland. (2025, October 6). Ashland announces new USA food and beverage ingredient distributor.
- Ingredion. (2026, July 6). Ingredion to Spotlight Next-Generation Solutions for Texture, Clean Labels and Positive Nutrition at IFT FIRST 2026.
- The Good Food Institute Europe. (2026, June 9). European plant-based sales data.
- Ingredion. (2026, February 10). Grown for texture: How plant science is reshaping ingredient innovation.
- Food Safety and Standards Authority of India. (2026, May 21). Food Safety and Standards (Vegan Foods) Amendment Regulations, 2026.
- Cargill. (2025, December 4). Protein boom: Why consumers want more protein - and how innovation is rising to meet the demand.
- BENEO. (2025, April 11). BENEO inaugurates new pulse-processing plant.
- Nippon Ham Co., Ltd. (2025, February 26).
- Ingredion. (2025, July 22). Ingredion at IFT FIRST 2025 - Connecting texture, health and innovation.
- Tate & Lyle. (2025, July 7). Tate & Lyle debuts expanded portfolio and mouthfeel leadership at IFT FIRST 2025.
- Roquette. (2026, April 6). Roquette Inaugurates its New Pilot Center at Lianyungang.
- Kerry. (2025, September 30). Kerry Launches Smart TasteTM to Help Customers Navigate Market Complexities Without Compromising on Taste.
This bibliography is provided for reader reference and is not exhaustive. The full report contains the complete reference list and detailed citations
This Report Answers
- How large is the plant-based seafood binding ingredients market in 2026 and 2036?
- Which formulation pressures support spending on plant-based seafood binding systems?
- Why do proteins account for the largest product type share in 2026?
- How does plant sourcing influence labeling and formulation choices?
- Why does bakery represent the largest application share in 2026?
- How do country growth rates differ across India, the United States, Germany, Japan, the United Kingdom, and France?
- Which companies provide proteins, starches, fibers, hydrocolloids, or formulation support?
- What limits repeat adoption across plant-based seafood products?
- How do blended binding systems improve commercial scale-up and product economics?
Frequently Asked Questions
How big is the Plant-Based Seafood Binding Ingredients Market in 2026?
The plant-based seafood binding ingredients market is valued at USD 45.0 million in 2026 and is forecast to reach USD 90.0 million by 2036.
What is the CAGR of the Plant-Based Seafood Binding Ingredients Market from 2026 to 2036?
The plant-based seafood binding ingredients market is projected to grow at a CAGR of 7.2% between 2026 and 2036, supported by new seafood formats requiring binding systems that protect cohesion and moisture across freezing and final cooking on commercial equipment.
Which product type leads the Plant-Based Seafood Binding Ingredients Market?
Proteins account for 28.0% of the plant-based seafood binding ingredients market by product type in 2026, driven by combined structure and nutrition functions across formed seafood portions where protein concentration influences bite and flake definition during commercial cooking.
Which country is growing fastest in the Plant-Based Seafood Binding Ingredients Market?
India is the fastest-growing country in the plant-based seafood binding ingredients market, expanding at a 9.7% CAGR through 2036, ahead of the market average of 7.2%, supported by a defined vegan-label route under amended regulations and expanding local formulation capacity across preferred fried seafood formats.
Who are the leading companies in the Plant-Based Seafood Binding Ingredients Market?
Leading companies in the plant-based seafood binding ingredients market include Cargill, Ingredion, Roquette, Tate & Lyle, IFF, Kerry, Ashland, and BENEO, competing across broad starch and ingredient platforms, plant protein and formulation support, and hydrocolloid and cellulosic binding systems.
Preview the report firsthand - request a free sample
Get SampleGet the brochure for pricing and purchase details.
Get PDFTable of Content
- Key Takeaways
- Market Size and CAGR
- Top Growth Driver
- Fastest Growing Segment
- Leading Region
- Key Companies
- Emerging Opportunities
- Executive Summary
- Global Market Outlook
- Demand-side Trends
- Supply-side Trends
- Technology Roadmap Analysis
- Analysis and Recommendations
- Analyst Perspective (What is happening? Why now? What should investors know?)
- Key Questions Answered
- How large is the market?
- What is the CAGR?
- What are key trends?
- Which region dominates?
- Who are the leaders?
- Market Overview
- Market Coverage / Taxonomy
- Market Definition / Scope / Limitations
- Research Methodology
- Chapter Orientation
- Analytical Lens and Working Hypotheses
- Market Structure, Signals, and Trend Drivers
- Benchmarking and Cross-market Comparability
- Market Sizing, Forecasting, and Opportunity Mapping
- Research Design and Evidence Framework
- Desk Research Programme (Secondary Evidence)
- Expert Input and Fieldwork (Primary Evidence)
- Tooling, Models, and Reference Databases
- Data Engineering and Model Build
- Quality Assurance and Audit Trail
- Market Background
- Market Dynamics (Drivers, Restraints, Opportunity, Trends)
- Scenario Forecast (Optimistic, Likely, Conservative)
- Impact Analysis
- AI Impact
- Sustainability Impact
- Regulatory Impact
- Technology Impact
- Consumer / Buyer Analysis
- Purchase Drivers
- Adoption Barriers
- Buyer Journey
- Opportunity Map Analysis
- Product Life Cycle Analysis
- Supply Chain Analysis
- Investment Feasibility Matrix
- Value Chain Analysis
- PESTLE and Porter's Analysis
- Regulatory Landscape
- Regional Parent Market Outlook
- Production and Consumption Statistics
- Import and Export Statistics
- Global Market Analysis and Forecast, 2021 to 2036
- Historical Market Size Value (USD Million) Analysis, 2021 to 2025
- Current and Future Market Size Value (USD Million) Projections, 2026 to 2036
- Y-o-Y Growth Trend Analysis
- Absolute $ Opportunity Analysis
- Global Market Pricing Analysis, 2021 to 2036
- Global Market Analysis and Forecast, By Product Type, 2021 to 2036
- Introduction / Key Findings
- Historical Market Size Value (USD Million) Analysis By Product Type, 2021 to 2025
- Current and Future Market Size Value (USD Million) Analysis and Forecast By Product Type, 2026 to 2036
- Proteins
- Fibers
- Sweeteners
- Cultures
- Flavors
- Proteins
- Y-o-Y Growth Trend Analysis By Product Type, 2021 to 2025
- Absolute $ Opportunity Analysis By Product Type, 2026 to 2036
- Global Market Analysis and Forecast, By Source, 2021 to 2036
- Introduction / Key Findings
- Historical Market Size Value (USD Million) Analysis By Source, 2021 to 2025
- Current and Future Market Size Value (USD Million) Analysis and Forecast By Source, 2026 to 2036
- Plant
- Microbial
- Dairy Analog
- Upcycled
- Mineral
- Plant
- Y-o-Y Growth Trend Analysis By Source, 2021 to 2025
- Absolute $ Opportunity Analysis By Source, 2026 to 2036
- Global Market Analysis and Forecast, By Application, 2021 to 2036
- Introduction / Key Findings
- Historical Market Size Value (USD Million) Analysis By Application, 2021 to 2025
- Current and Future Market Size Value (USD Million) Analysis and Forecast By Application, 2026 to 2036
- Bakery
- Beverages
- Snacks
- Infant Nutrition
- Ready Meals
- Bakery
- Y-o-Y Growth Trend Analysis By Application, 2021 to 2025
- Absolute $ Opportunity Analysis By Application, 2026 to 2036
- Global Market Analysis and Forecast, By End User, 2021 to 2036
- Introduction / Key Findings
- Historical Market Size Value (USD Million) Analysis By End User, 2021 to 2025
- Current and Future Market Size Value (USD Million) Analysis and Forecast By End User, 2026 to 2036
- Food Manufacturers
- Ingredient Blenders
- Private Label
- Foodservice
- Nutraceutical Brands
- Food Manufacturers
- Y-o-Y Growth Trend Analysis By End User, 2021 to 2025
- Absolute $ Opportunity Analysis By End User, 2026 to 2036
- Global Market Analysis and Forecast, By Region, 2021 to 2036
- Introduction
- Historical Market Size Value (USD Million) Analysis By Region, 2021 to 2025
- Current Market Size Value (USD Million) Analysis and Forecast By Region, 2026 to 2036
- North America
- Latin America
- Western Europe
- Eastern Europe
- East Asia
- South Asia and Pacific
- Middle East & Africa
- Market Attractiveness Analysis By Region
- North America Market Analysis and Forecast, By Country, 2021 to 2036
- Historical Market Size Value (USD Million) Trend Analysis By Market Taxonomy, 2021 to 2025
- Market Size Value (USD Million) Forecast By Market Taxonomy, 2026 to 2036
- By Country
- USA
- Canada
- By Product Type
- By Source
- By Application
- By End User
- By Country
- Market Attractiveness Analysis
- By Country
- By Product Type
- By Source
- By Application
- By End User
- Key Takeaways
- Latin America Market Analysis and Forecast, By Country
- Historical Market Size Value (USD Million) Trend Analysis By Market Taxonomy, 2021 to 2025
- Market Size Value (USD Million) Forecast By Market Taxonomy, 2026 to 2036
- By Country
- Brazil
- Mexico
- Chile
- Rest of Latin America
- By Product Type
- By Source
- By Application
- By End User
- By Country
- Market Attractiveness Analysis
- By Country
- By Product Type
- By Source
- By Application
- By End User
- Key Takeaways
- Western Europe Market Analysis and Forecast, By Country
- Historical Market Size Value (USD Million) Trend Analysis By Market Taxonomy, 2021 to 2025
- Market Size Value (USD Million) Forecast By Market Taxonomy, 2026 to 2036
- By Country
- Germany
- UK
- Italy
- Spain
- France
- Nordic
- BENELUX
- Rest of Western Europe
- By Product Type
- By Source
- By Application
- By End User
- By Country
- Market Attractiveness Analysis
- By Country
- By Product Type
- By Source
- By Application
- By End User
- Key Takeaways
- Eastern Europe Market Analysis and Forecast, By Country
- Historical Market Size Value (USD Million) Trend Analysis By Market Taxonomy, 2021 to 2025
- Market Size Value (USD Million) Forecast By Market Taxonomy, 2026 to 2036
- By Country
- Russia
- Poland
- Hungary
- Balkan & Baltic
- Rest of Eastern Europe
- By Product Type
- By Source
- By Application
- By End User
- By Country
- Market Attractiveness Analysis
- By Country
- By Product Type
- By Source
- By Application
- By End User
- Key Takeaways
- East Asia Market Analysis and Forecast, By Country
- Historical Market Size Value (USD Million) Trend Analysis By Market Taxonomy, 2021 to 2025
- Market Size Value (USD Million) Forecast By Market Taxonomy, 2026 to 2036
- By Country
- China
- Japan
- South Korea
- By Product Type
- By Source
- By Application
- By End User
- By Country
- Market Attractiveness Analysis
- By Country
- By Product Type
- By Source
- By Application
- By End User
- Key Takeaways
- South Asia and Pacific Market Analysis and Forecast, By Country
- Historical Market Size Value (USD Million) Trend Analysis By Market Taxonomy, 2021 to 2025
- Market Size Value (USD Million) Forecast By Market Taxonomy, 2026 to 2036
- By Country
- India
- ASEAN
- Australia & New Zealand
- Rest of South Asia and Pacific
- By Product Type
- By Source
- By Application
- By End User
- By Country
- Market Attractiveness Analysis
- By Country
- By Product Type
- By Source
- By Application
- By End User
- Key Takeaways
- Middle East & Africa Market Analysis and Forecast, By Country
- Historical Market Size Value (USD Million) Trend Analysis By Market Taxonomy, 2021 to 2025
- Market Size Value (USD Million) Forecast By Market Taxonomy, 2026 to 2036
- By Country
- Kingdom of Saudi Arabia
- Other GCC Countries
- Türkiye
- South Africa
- Other African Union
- Rest of Middle East & Africa
- By Product Type
- By Source
- By Application
- By End User
- By Country
- Market Attractiveness Analysis
- By Country
- By Product Type
- By Source
- By Application
- By End User
- Key Takeaways
- Key Countries Market Analysis
- USA
- Pricing Analysis
- Market Share Analysis, 2025
- By Product Type
- By Source
- By Application
- By End User
- Canada
- Pricing Analysis
- Market Share Analysis, 2025
- By Product Type
- By Source
- By Application
- By End User
- Mexico
- Pricing Analysis
- Market Share Analysis, 2025
- By Product Type
- By Source
- By Application
- By End User
- Brazil
- Pricing Analysis
- Market Share Analysis, 2025
- By Product Type
- By Source
- By Application
- By End User
- Chile
- Pricing Analysis
- Market Share Analysis, 2025
- By Product Type
- By Source
- By Application
- By End User
- Germany
- Pricing Analysis
- Market Share Analysis, 2025
- By Product Type
- By Source
- By Application
- By End User
- UK
- Pricing Analysis
- Market Share Analysis, 2025
- By Product Type
- By Source
- By Application
- By End User
- Italy
- Pricing Analysis
- Market Share Analysis, 2025
- By Product Type
- By Source
- By Application
- By End User
- Spain
- Pricing Analysis
- Market Share Analysis, 2025
- By Product Type
- By Source
- By Application
- By End User
- France
- Pricing Analysis
- Market Share Analysis, 2025
- By Product Type
- By Source
- By Application
- By End User
- India
- Pricing Analysis
- Market Share Analysis, 2025
- By Product Type
- By Source
- By Application
- By End User
- ASEAN
- Pricing Analysis
- Market Share Analysis, 2025
- By Product Type
- By Source
- By Application
- By End User
- Australia & New Zealand
- Pricing Analysis
- Market Share Analysis, 2025
- By Product Type
- By Source
- By Application
- By End User
- China
- Pricing Analysis
- Market Share Analysis, 2025
- By Product Type
- By Source
- By Application
- By End User
- Japan
- Pricing Analysis
- Market Share Analysis, 2025
- By Product Type
- By Source
- By Application
- By End User
- South Korea
- Pricing Analysis
- Market Share Analysis, 2025
- By Product Type
- By Source
- By Application
- By End User
- Russia
- Pricing Analysis
- Market Share Analysis, 2025
- By Product Type
- By Source
- By Application
- By End User
- Poland
- Pricing Analysis
- Market Share Analysis, 2025
- By Product Type
- By Source
- By Application
- By End User
- Hungary
- Pricing Analysis
- Market Share Analysis, 2025
- By Product Type
- By Source
- By Application
- By End User
- Kingdom of Saudi Arabia
- Pricing Analysis
- Market Share Analysis, 2025
- By Product Type
- By Source
- By Application
- By End User
- Türkiye
- Pricing Analysis
- Market Share Analysis, 2025
- By Product Type
- By Source
- By Application
- By End User
- South Africa
- Pricing Analysis
- Market Share Analysis, 2025
- By Product Type
- By Source
- By Application
- By End User
- USA
- Market Structure Analysis
- Competition Dashboard
- Competition Benchmarking
- Market Share Analysis of Top Players
- By Regional
- By Product Type
- By Source
- By Application
- By End User
- Emerging Startups
- Innovation Benchmarking
- Competition Analysis
- Competition Deep Dive
- Cargill
- Overview
- Product Portfolio
- Profitability by Market Segments
- Sales Footprint
- Strategy Overview
- Marketing Strategy
- Product Strategy
- Channel Strategy
- Ingredion
- Kerry
- IFF
- Roquette
- Tate & Lyle
- Givaudan
- Lallemand
- Cargill
- Case Studies
- Success Stories
- Recent Developments
- Competition Deep Dive
- Assumptions & Acronyms Used


