

- Market Size (2026)
- USD 920.6 Mn
- Forecast (2036)
- USD 3237.4 Mn
- CAGR (2026 to 2036)
- 13.4%
How big is the plastic depolymerization catalysts market in 2026?
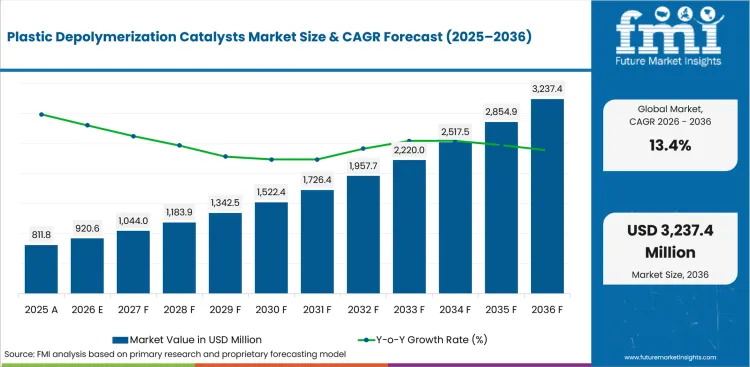
USD 920.6 million in 2026 and USD 3,237.4 million by 2036 at a 13.4% CAGR.
The plastic depolymerization catalysts market is expected to grow from USD 811.8 million in 2025 to USD 3,237.4 million by 2036 at 13.4% CAGR due to commercial PET recycling projects and tighter recycled-content requirements. Enzymatic Catalysts are forecast to hold 34.5% share in 2026 due to selective PET chain cleavage. PET is expected to account for 48.0% share in 2026, led by bottle, textile, and plastic packaging waste streams that offer clearer monomer recovery routes.
Scale-up evidence is moving catalyst selection from laboratory performance toward plant risk control. EPA data updated in October 2025 placed the USA PET bottle and jar recycling rate at 29.1%, which leaves a large packaging stream outside high-value material recovery. The European Commission stated that PPWR entered into force in February 2025 and will generally apply from August 2026, reinforcing recycled-content planning for packaging buyers. Eastman reported in March 2024 that its Kingsport molecular recycling facility achieved on-spec initial production, giving buyers a commercial reference for methanolysis-linked polyester renewal.
| Metric | Value |
|---|---|
| 2026 Market Size | USD 920.6 million |
| 2036 Market Size | USD 3,237.4 million |
| Forecast CAGR (2026-2036) | 13.4% |
| Leading Catalyst Type | Enzymatic Catalysts |
| Enzymatic Catalysts Share (2026) | 34.5% |
| Leading Polymer Feedstock | PET |
| PET Share (2026) | 48.0% |
| Fastest-growing Country | China |
| China CAGR by 2036 | 15.1% |
Summary of the Plastic Depolymerization Catalysts Market
| Market Signal | Commercial Impact |
|---|---|
| Demand and Growth Drivers | Demand for plastic depolymerization catalysts is increasing as polymer producers commercialize chemical recycling technologies and prioritize catalyst systems that improve yield, process reliability, and commercial-scale performance.
|
| Product and Segment View | Enzymatic catalysts, PET feedstocks, glycolysis processes, chemical recycling plants, and integrated catalyst-plus-process-package offerings lead their respective market segments.
|
| Geography and Growth Outlook | Asia and Europe are strengthening their commercial position through expanding PET recycling capacity, regulatory support, and deployment of licensed depolymerization technologies.
|
| Competitive Landscape | Competition increasingly focuses on catalyst performance, process licensing, commercial deployment support, and integration with polymer manufacturing value chains.
|
| Analyst Perspective | Plastic depolymerization catalysts are becoming strategic process technologies where catalyst selectivity, feedstock flexibility, and commercialization support increasingly determine supplier selection.
- Nikhil Kaitwade, Principal Consultant at Future Market Insights |
Which factors support expansion in the plastic depolymerization catalysts market?
Plant-linked catalyst packages and recycled-content compliance support market value across PET recycling routes.
- Market value is supported by chemical recycling services that need catalyst packages and process guarantees before commercial units reach steady operation.
- Supplier pricing reflects monomer purity requirements before operators compare catalyst cost against sorting, solvent recovery, and purification load.
- Revenue improves as polymer producers use chemical depolymerization to rebuild PET and polyester inputs for packaging and textile applications.
- Buyer trust rises when packaging waste recycling projects can document feedstock origin and recovered monomer quality across regulated supply chains.
Why is the plastic depolymerization catalysts market growing?
- Commercial chemical recycling needs catalysts that can turn contaminated PET and polyester waste into reusable monomer streams.
Growth is being shaped by the quality gap between mechanical recycling and polymer-grade recycled inputs. The OECD April 2026 report on chemical content validation described recycled plastic safety as dependent on standards, traceability, and analytical testing. This matters for catalyst buyers because recycled PET packaging applications require recovered monomers to meet packaging and textile specifications. Suppliers benefit when catalyst design is paired with purification evidence and documented material quality.
How is the plastic depolymerization catalysts market segmented?
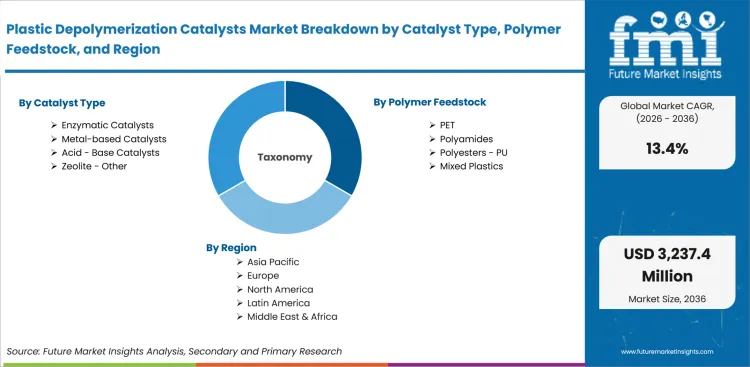
The plastic depolymerization catalysts industry is segmented by catalyst type, polymer feedstock, process, end use, and sales model.
- Enzymatic catalysts are projected to secure a 34.5% share in 2026, supported by selective PET depolymerization capabilities and reduced thermal stress during processing.
- PET feedstocks are anticipated to hold a 48.0% share in 2026, as bottle and textile waste streams provide clearer and more predictable monomer recovery routes.
- Glycolysis processes are expected to capture a 36.0% share in 2026, driven by BHET recovery efficiency and compatibility with existing polyester production infrastructure.
- Chemical recycling plants are forecast to represent a 46.0% share in 2026, reflecting demand from licensed operators and commercial‑scale plant developers.
- Catalyst‑plus‑process package offerings are projected to account for a 58.0% share in 2026, as buyers favor bundled solutions that include start‑up assurance and operational support.
Which catalyst type category holds a notable share in the plastic depolymerization catalysts market?
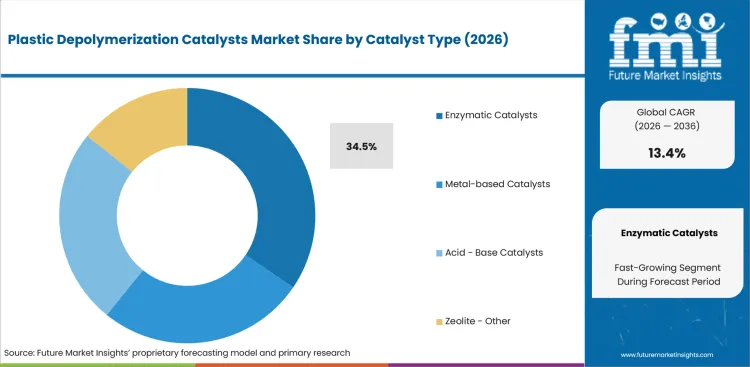
- Enzymatic Catalysts are projected to account for 34.5% share in 2026 because PET biorecycling buyers need selective chain cleavage and impurity control.
- Metal-based and Acid / Base Catalysts remain relevant for operators that prioritize throughput, reactor familiarity, and lower catalyst procurement risk.
How are buyers selecting across polymer feedstock options in the plastic depolymerization catalysts market?
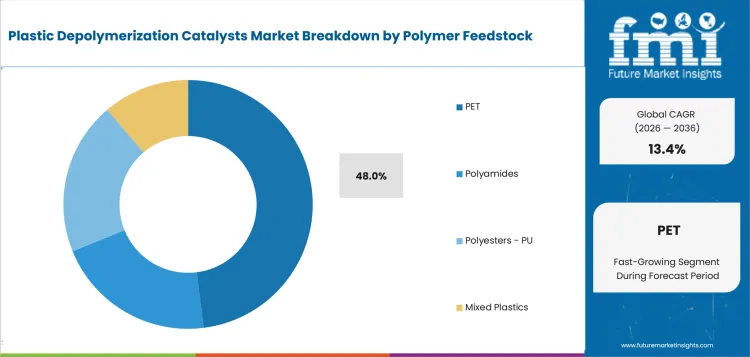
- PET is expected to hold 48.0% share in 2026 due to established demand for recovered PTA and MEG in packaging and fibers.
- Polyamides and Polyesters / PU create more technical work because blends and additives can increase catalyst stress and purification cost.
What drives demand across the process segment in the plastic depolymerization catalysts market?
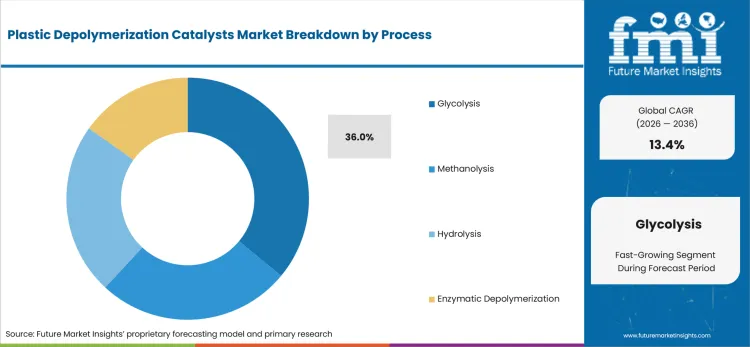
- Glycolysis is anticipated to represent 36.0% share in 2026 owing to BHET recovery and proven relevance in polyester renewal routes.
- Enzymatic Depolymerization gains relevance from lower-temperature processing and selective PET cleavage in routes targeting high-purity recycled monomers.
Which end-use segment shows a prominent position in the plastic depolymerization catalysts market?
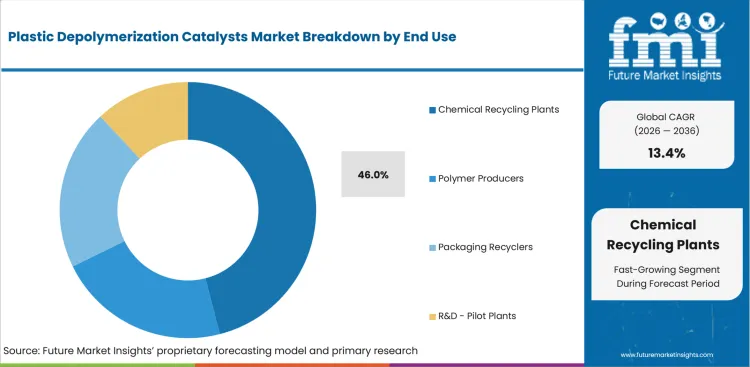
- Chemical Recycling Plants are projected to account for 46.0% share in 2026 due to early catalyst purchasing before plant commissioning.
- Polymer Producers remain important because recovered monomers need downstream acceptance before catalysts can secure repeat commercial demand.
How does the sales model segment perform in the plastic depolymerization catalysts market?
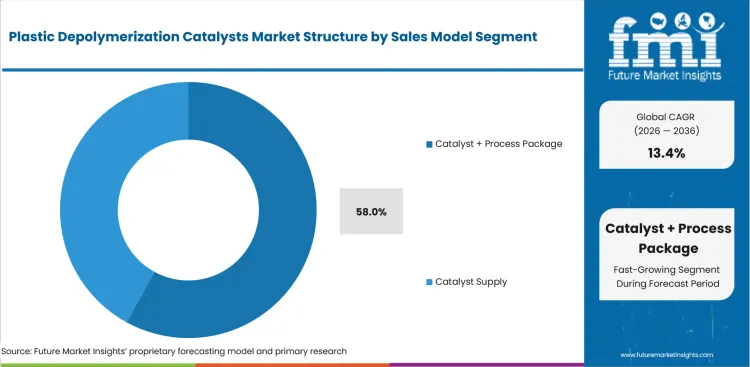
- Catalyst + Process Package is expected to hold 58.0% share in 2026 due to buyer preference for performance guarantees and start-up support.
- Catalyst Supply retains demand in R&D and pilot settings where operators still test formulas before selecting a complete process route.
What are the drivers, restraints, and opportunities in the plastic depolymerization catalysts market?
Recycled-content rules support demand while feedstock variability limits wider commercial adoption.
- Driver: Polymer producers are moving toward catalysts that can recover monomer-grade outputs from PET and polyester waste streams.
- Restraint: Feedstock variability can raise catalyst consumption and purification costs before recovered monomers meet buyer specifications.
- Opportunity: Licensing-linked catalyst packages can improve buyer confidence by combining chemistry, reactor design, and start-up support.
Monomer Purity Demand Outlook
Recycled-content requirements are expected to lift demand for catalyst routes that produce reusable monomers from difficult packaging waste. USA Plastics Pact reported a 13.3% national plastic packaging recycling rate in 2024, which shows the recovery gap facing packaging buyers. Catalyst suppliers can gain value when recycled polyethylene terephthalate routes help convert low-recovery streams into polymer-grade outputs with documented purity.
Feedstock Variability and Cost Pressure
Feedstock variability is projected to remain the main restraint because real PET waste contains colorants, adhesives, fibers and additives. The OECD April 2026 recycled plastics report highlighted chemical content validation as a quality and safety challenge. This reinforces the need for catalysts that work alongside sorting, pretreatment and food contact recycled plastics decontamination before commercial output is accepted.
Licensing-Linked Catalyst Sales
The opportunity is concentrated in integrated process packages that reduce first-plant risk for recyclers and polymer producers. Carbios stated in April 2024 that Longlaville will process 50,000 tons of prepared PET waste each year. This capacity signal supports demand for catalyst systems tied to engineering, purification, and operating guarantees over formula-only supply.
Which countries are growing fastest in the plastic depolymerization catalysts market?
China 15.1% CAGR, India 14.6% CAGR, France 13.9% CAGR, Germany 13.6% CAGR, South Korea 13.2% CAGR, United States 12.8% CAGR, Japan 12.7% CAGR, and United Kingdom 11.9% CAGR through 2036.
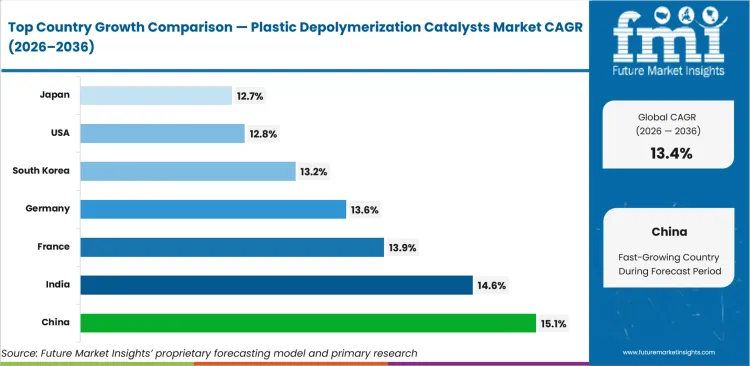
| Country | CAGR |
|---|---|
| China | 15.1% |
| India | 14.6% |
| France | 13.9% |
| Germany | 13.6% |
| South Korea | 13.2% |
| United States | 12.8% |
| Japan | 12.7% |
| United Kingdom | 11.9% |
Source: Future Market Insights, 2026.
How do country-level CAGRs compare in the plastic depolymerization catalysts market?
- China is expected to lead with a 15.1% CAGR by 2036, supported by deep PET production capacity and verified enzymatic biorecycling joint‑venture pathways.
- India is projected to expand at a 14.6% CAGR through 2036, as expanded EPR registration increases participation from formal recycling buyers.
- France is anticipated to grow at a 13.9% CAGR by 2036, driven by active PET biorecycling plant deployment and local ownership of core technologies.
- Germany is forecast to advance at a 13.6% CAGR through 2036, with chemical park infrastructure and broader European licensing activity supporting scale‑up.
- South Korea is expected to post a 13.2% CAGR by 2036, as petrochemical producers increasingly assess higher‑value chemical recycling routes.
- The United States is projected to record a 12.8% CAGR by 2036, supported by commercial molecular recycling initiatives and gaps in national packaging recovery.
- Japan is forecast to reach a 12.7% CAGR through 2036, as Rewind PET process validation progresses alongside cautious buyer qualification cycles.
- The United Kingdom is expected to grow at an 11.9% CAGR by 2036, with tax compliance requirements and limited domestic capacity influencing adoption speed.
How is China performing in the plastic depolymerization catalysts market?
A 15.1% CAGR through 2036 reflects PET production scale and local enzymatic biorecycling licensing activity.
Country Market Snapshot Table
| Parameter | Value |
|---|---|
| Market Size in 2025 (Value) | USD 156.4 million |
| Market Size in 2026 (Value) | USD 180.0 million |
| Market Forecast in 2036 (Value) | USD 734.6 million |
| CAGR (2026 to 2036) | 15.1% |
| Years Considered | 2021 to 2036 |
| Base Year | 2025 |
| Forecast Period | 2026 to 2036 |
| Units Considered | Value (USD million) |
| Leading Sub-Region | Yangtze River Delta and Zhejiang PET corridors |
China Plastic Depolymerization Catalysts Market Outlook
China demand is shaped by PET production scale and local polymer groups seeking recycled monomer options. Wankai and Carbios give the country a direct route into enzymatic PET biorecycling.
Buying decisions are expected to favor joint ventures because local partners can manage feedstock access and plant permitting. Suppliers still need clear controls for provincial collection variation and monomer purity.
Key Growth Drivers
- Large PET production capacity creates a direct market for recycled monomer routes. Carbios stated in December 2025 that Wankai belongs to a PET producer ranked third in China, reinforcing the available industrial buyer base.
- Local joint ventures reduce entry barriers for foreign technology owners. Carbios reported in December 2025 that the planned China plant will process 50,000 tons of PET waste, linking catalyst demand to local scale.
- Circular economy policy gives recycled material use a stronger industrial basis across packaging and consumer goods. This policy direction supports catalyst suppliers that can document output quality.
- Producer partnerships can shorten qualification because polymer companies already understand monomer specifications and downstream resin requirements.
Key Restraints
- Feedstock quality varies across regions and can weaken catalyst productivity during scale-up. The China partnership targets Haining in Zhejiang province, which shows why location-specific feedstock control remains important.
- Technology owners may face licensing control concerns because local partners often require operational access and detailed process support.
- Provincial collection systems can create uneven waste preparation quality before catalysts are evaluated in commercial reactors.
What makes China unique
China is distinct because local PET capacity can absorb recycled monomers faster than smaller national markets.
Key Companies
- Wankai New Materials
- Zhink Group
- Carbios
- Sinopec
Sales & Marketing Channels
- Joint ventures with PET producers
- Direct licensing to polymer companies
- Provincial industrial park channels
- Waste aggregator partnerships
- Packaging brand offtake routes
- Engineering contractor networks
Country Segment Breakdown Table
| Segment | Sub-Segments |
|---|---|
| By Catalyst Type | Enzymatic Catalysts · Metal-based Catalysts · Acid / Base Catalysts · Zeolite / Other |
| By Polymer Feedstock | PET · Polyamides · Polyesters / PU · Mixed Plastics |
| By Process | Glycolysis · Methanolysis · Hydrolysis · Enzymatic Depolymerization |
| By End Use | Chemical Recycling Plants · Polymer Producers · Packaging Recyclers · R&D / Pilot Plants |
| By Sales Model | Catalyst Supply · Catalyst + Process Package |
| Key Sub-Regions Covered, Manufacturing and recycling corridors | Haining · Zhejiang · Jiangsu · Guangdong · Shanghai · Shandong |
China Plastic Depolymerization Catalysts Market FAQs
How fast is China plastic depolymerization catalysts market growing?
Sales in China are forecast to expand at 15.1% CAGR from 2026 to 2036 due to country-specific recycling and polymer demand conditions.
Who leads China plastic depolymerization catalysts market?
Wankai New Materials, Zhink Group, Carbios, Sinopec compete based on local technology access, process relevance, and recycling project participation.
What is driving adoption in China plastic depolymerization catalysts market?
Adoption is supported by PET recycling needs, polymer buyer qualification, and stronger documentation requirements for recycled-content supply chains.
What supports plastic depolymerization catalysts growth in India?
A 14.6% CAGR through 2036 is supported by EPR registrations and domestic polymer production partnerships.
Country Market Snapshot Table
| Parameter | Value |
|---|---|
| Market Size in 2025 (Value) | USD 43.6 million |
| Market Size in 2026 (Value) | USD 50.0 million |
| Market Forecast in 2036 (Value) | USD 195.4 million |
| CAGR (2026 to 2036) | 14.6% |
| Years Considered | 2021 to 2036 |
| Base Year | 2025 |
| Forecast Period | 2026 to 2036 |
| Units Considered | Value (USD million) |
| Leading Sub-Region | Gujarat, Maharashtra, and North India packaging corridors |
India Plastic Depolymerization Catalysts Market Outlook
India demand is shaped by packaging EPR and a wider formal recycling ecosystem. Local polymer and polyester producers give depolymerization technologies a practical route into commercial buyer discussions.
The market remains price-sensitive because feedstock sorting quality varies across collection channels. Process packages that include pretreatment guidance should perform better than standalone catalyst supply.
Key Growth Drivers
- Packaging EPR expands formal demand for higher-value recycling routes. India’s environment ministry reported in March 2026 that the EPR portal had 60,128 registered producers, importers, and brand owners.
- Processor registration creates a wider pool of potential project partners. The ministry reported in March 2026 that 3,012 plastic waste processors were registered on the portal.
- Local PET and polyester use supports future monomer recovery demand across packaging and textile supply chains.
- Joint ventures can lower market-entry risk because local polymer producers provide feedstock access, land knowledge, and buyer relationships.
Key Restraints
- Feedstock contamination can raise catalyst and purification cost before commercial output meets buyer specifications. The environment ministry reported that 207 lakh tonnes of plastic packaging waste had been recycled since EPR guidelines began, showing the scale of variable material handled.
- Smaller processors may lack capital for depolymerization units because reactor systems and purification equipment require larger project financing.
- Imported catalyst packages can face pricing pressure when buyers compare them against mechanical recycling and lower-cost sorting upgrades.
What makes India unique
India is distinctive because compliance depth and local polymer partnerships can convert policy pressure into scale-up demand.
Key Companies
- Ester Industries
- Loop Industries
- Reliance Industries
- Ganesha Ecosphere
Sales & Marketing Channels
- Joint ventures with local polymer firms
- EPR compliance networks
- Direct sales to PET recyclers
- Packaging converter partnerships
- Waste processor alliances
- State industrial development channels
Country Segment Breakdown Table
| Segment | Sub-Segments |
|---|---|
| By Catalyst Type | Enzymatic Catalysts · Metal-based Catalysts · Acid / Base Catalysts · Zeolite / Other |
| By Polymer Feedstock | PET · Polyamides · Polyesters / PU · Mixed Plastics |
| By Process | Glycolysis · Methanolysis · Hydrolysis · Enzymatic Depolymerization |
| By End Use | Chemical Recycling Plants · Polymer Producers · Packaging Recyclers · R&D / Pilot Plants |
| By Sales Model | Catalyst Supply · Catalyst + Process Package |
| Key Sub-Regions Covered, Manufacturing and recycling corridors | Gujarat · Maharashtra · Haryana · Uttar Pradesh · Tamil Nadu · Karnataka |
India Plastic Depolymerization Catalysts Market FAQs
How fast is India plastic depolymerization catalysts market growing?
Sales in India are forecast to expand at 14.6% CAGR from 2026 to 2036 due to country-specific recycling and polymer demand conditions.
Who leads India plastic depolymerization catalysts market?
Ester Industries, Loop Industries, Reliance Industries, Ganesha Ecosphere compete based on local technology access, process relevance, and recycling project participation.
What is driving adoption in India plastic depolymerization catalysts market?
Adoption is supported by PET recycling needs, polymer buyer qualification, and stronger documentation requirements for recycled-content supply chains.
What is the plastic depolymerization catalysts outlook in France?
A 13.9% CAGR through 2036 reflects local enzymatic PET biorecycling and brand-linked validation activity.
Country Market Snapshot Table
| Parameter | Value |
|---|---|
| Market Size in 2025 (Value) | USD 59.7 million |
| Market Size in 2026 (Value) | USD 68.0 million |
| Market Forecast in 2036 (Value) | USD 249.9 million |
| CAGR (2026 to 2036) | 13.9% |
| Years Considered | 2021 to 2036 |
| Base Year | 2025 |
| Forecast Period | 2026 to 2036 |
| Units Considered | Value (USD million) |
| Leading Sub-Region | Grand Est and northern polymer recycling corridors |
France Plastic Depolymerization Catalysts Market Outlook
France demand is centered on enzymatic PET depolymerization and industrial validation around Longlaville. Carbios gives the country a direct link between catalyst technology, waste preparation, and monomer recovery.
French buyers are expected to judge suppliers by first-of-kind execution and output quality. Brand partnerships and public bodies are likely to influence adoption before wider licensing expands.
Key Growth Drivers
- Enzymatic PET biorecycling creates direct demand for specialty catalyst and enzyme packages. Carbios reported in April 2024 that the Longlaville plant will process 50,000 tons of prepared PET waste per year.
- Local industrial construction makes France a proof point for plant-linked catalyst buying. Carbios stated in April 2024 that the project would create 150 direct and indirect jobs in the region.
- Packaging and cosmetics brands need traceable recycled PET inputs that can pass quality and documentation requirements.
- EU policy pressure supports investment in domestic circular plastics capacity across packaging and textile applications.
Key Restraints
- First-of-kind enzyme plant scale-up can face timing pressure before lenders and offtakers accept wider replication. Carbios noted in April 2024 that the facility was still under construction after permitting and land acquisition steps.
- Feedstock preparation must deliver consistent PET quality because enzyme performance can decline when waste streams contain unsuitable blends.
- Public project scrutiny can increase documentation requirements for suppliers that claim high-quality recycled outputs.
What makes France unique
France is unique because it anchors industrial enzymatic PET depolymerization within a local commercial plant project.
Key Companies
- Carbios
- Axens
- IFPEN
- Technip Energies
Sales & Marketing Channels
- Direct licensing to recycling plants
- Brand-owner partnership programs
- Waste management company alliances
- Public-body procurement channels
- Chemical engineering partnerships
- Polymer producer qualification routes
Country Segment Breakdown Table
| Segment | Sub-Segments |
|---|---|
| By Catalyst Type | Enzymatic Catalysts · Metal-based Catalysts · Acid / Base Catalysts · Zeolite / Other |
| By Polymer Feedstock | PET · Polyamides · Polyesters / PU · Mixed Plastics |
| By Process | Glycolysis · Methanolysis · Hydrolysis · Enzymatic Depolymerization |
| By End Use | Chemical Recycling Plants · Polymer Producers · Packaging Recyclers · R&D / Pilot Plants |
| By Sales Model | Catalyst Supply · Catalyst + Process Package |
| Key Sub-Regions Covered, Manufacturing and recycling corridors | Longlaville · Grand Est · Hauts-de-France · Paris Basin · Lyon · Marseille |
France Plastic Depolymerization Catalysts Market FAQs
How fast is France plastic depolymerization catalysts market growing?
Sales in France are forecast to expand at 13.9% CAGR from 2026 to 2036 due to country-specific recycling and polymer demand conditions.
Who leads France plastic depolymerization catalysts market?
Carbios, Axens, IFPEN, Technip Energies compete based on local technology access, process relevance, and recycling project participation.
What is driving adoption in France plastic depolymerization catalysts market?
Adoption is supported by PET recycling needs, polymer buyer qualification, and stronger documentation requirements for recycled-content supply chains.
How does Germany compare in the plastic depolymerization catalysts market?
A 13.6% CAGR through 2036 is supported by chemical park infrastructure and European licensing activity.
Country Market Snapshot Table
| Parameter | Value |
|---|---|
| Market Size in 2025 (Value) | USD 65.1 million |
| Market Size in 2026 (Value) | USD 74.0 million |
| Market Forecast in 2036 (Value) | USD 264.9 million |
| CAGR (2026 to 2036) | 13.6% |
| Years Considered | 2021 to 2036 |
| Base Year | 2025 |
| Forecast Period | 2026 to 2036 |
| Units Considered | Value (USD million) |
| Leading Sub-Region | Schwarzheide, Ruhr, and central chemical park clusters |
Germany Plastic Depolymerization Catalysts Market Outlook
Germany demand is shaped by chemical park infrastructure and engineering-led project review. Buyers value utilities, permitting support, and process integration before choosing a catalyst package.
European recycled-content rules support the market while energy cost exposure keeps economics under pressure. Suppliers need to prove yield, heat use, and impurity control under operating conditions.
Key Growth Drivers
- Chemical park infrastructure lowers scale-up friction for PET depolymerization projects. Loop stated in February 2026 that its European joint venture selected BASF Industriepark Lausitz for its first European facility.
- European project capacity supports local catalyst and process-package demand. Loop reported in February 2026 that the site is planned for 70,000 metric tons per year of recycled PET and polyester fiber.
- German engineering firms influence catalyst package decisions because reactor design and purification layouts determine project economics.
- EU recycled-content rules increase demand for high-quality recycled polymer inputs across packaging and industrial supply chains.
Key Restraints
- Energy cost sensitivity can weaken heat-intensive recycling routes during project evaluation. Loop noted in February 2026 that the project was moving into engineering and permitting, which keeps execution risk visible.
- Permitting and stakeholder review can extend plant development timelines before catalysts are purchased at commercial scale.
- Buyers may demand stronger proof of mass balance and material certification before accepting chemically recycled polymers.
What makes Germany unique
Germany combines chemical park infrastructure with detailed buyer scrutiny of recycling claims and process economics.
Key Companies
- BASF
- Loop Industries
- RITTEC Umwelttechnik
- APK AG
Sales & Marketing Channels
- Chemical park partnerships
- EPC and engineering alliances
- Direct sales to PET recyclers
- Polymer producer qualification routes
- EU compliance advisory channels
- Industrial cluster events
Country Segment Breakdown Table
| Segment | Sub-Segments |
|---|---|
| By Catalyst Type | Enzymatic Catalysts · Metal-based Catalysts · Acid / Base Catalysts · Zeolite / Other |
| By Polymer Feedstock | PET · Polyamides · Polyesters / PU · Mixed Plastics |
| By Process | Glycolysis · Methanolysis · Hydrolysis · Enzymatic Depolymerization |
| By End Use | Chemical Recycling Plants · Polymer Producers · Packaging Recyclers · R&D / Pilot Plants |
| By Sales Model | Catalyst Supply · Catalyst + Process Package |
| Key Sub-Regions Covered, Manufacturing and recycling corridors | Schwarzheide · Ruhr · Ludwigshafen · Hamburg · Bavaria · Saxony |
Germany Plastic Depolymerization Catalysts Market FAQs
How fast is Germany plastic depolymerization catalysts market growing?
Sales in Germany are forecast to expand at 13.6% CAGR from 2026 to 2036 due to country-specific recycling and polymer demand conditions.
Who leads Germany plastic depolymerization catalysts market?
BASF, Loop Industries, RITTEC Umwelttechnik, APK AG compete based on local technology access, process relevance, and recycling project participation.
What is driving adoption in Germany plastic depolymerization catalysts market?
Adoption is supported by PET recycling needs, polymer buyer qualification, and stronger documentation requirements for recycled-content supply chains.
What is shaping plastic depolymerization catalysts demand in South Korea?
A 13.2% CAGR through 2036 reflects petrochemical depth and public attention around plastics circularity.
Country Market Snapshot Table
| Parameter | Value |
|---|---|
| Market Size in 2025 (Value) | USD 38.9 million |
| Market Size in 2026 (Value) | USD 44.0 million |
| Market Forecast in 2036 (Value) | USD 152.0 million |
| CAGR (2026 to 2036) | 13.2% |
| Years Considered | 2021 to 2036 |
| Base Year | 2025 |
| Forecast Period | 2026 to 2036 |
| Units Considered | Value (USD million) |
| Leading Sub-Region | Ulsan, Yeosu, and national petrochemical corridors |
South Korea Plastic Depolymerization Catalysts Market Outlook
South Korea demand is influenced by petrochemical capability and public attention around plastics circularity. Local producers have process knowledge that can support depolymerization route evaluation.
Catalyst suppliers need strong evidence because recycling claims face scrutiny in a visible policy environment. PET and polyester streams offer the most practical route into resin and textile chains.
Key Growth Drivers
- Petrochemical depth supports technical evaluation of depolymerization routes. LOTTE Chemical stated in October 2025 that it would present chemical recycling solutions using depolymerization and solvent purification technologies.
- Public and policy attention gives higher-quality recycling stronger visibility. UNEP reported in June 2025 that the Republic of Korea hosted World Environment Day under a plastic pollution theme.
- Packaging and textile value chains create demand for PET and polyester recovery routes that can return monomers to local resin systems.
- Industrial park channels can support catalyst package sales because chemical producers already use integrated utility and process support networks.
Key Restraints
- Public skepticism can slow acceptance of chemical recycling claims when output quality is not clear. UNEP stated in June 2025 that circularity requires redesign, reuse, alternatives, and recycling, which raises scrutiny on narrow waste-diversion claims.
- Energy intensity can challenge route selection because depolymerization facilities must compete with other petrochemical investments.
- Buyer qualification can be slower when recovered monomers need approval from resin producers and textile customers.
What makes South Korea unique
South Korea combines petrochemical process capability with unusually high public visibility around plastics circularity.
Key Companies
- SK Geo Centric
- LOTTE Chemical
- Kolon Industries
- LG Chem
Sales & Marketing Channels
- Petrochemical producer partnerships
- Government-backed recycling pilots
- Packaging converter qualification
- Textile recycler collaboration
- Industrial park channels
- Direct technical sales to chemical groups
Country Segment Breakdown Table
| Segment | Sub-Segments |
|---|---|
| By Catalyst Type | Enzymatic Catalysts · Metal-based Catalysts · Acid / Base Catalysts · Zeolite / Other |
| By Polymer Feedstock | PET · Polyamides · Polyesters / PU · Mixed Plastics |
| By Process | Glycolysis · Methanolysis · Hydrolysis · Enzymatic Depolymerization |
| By End Use | Chemical Recycling Plants · Polymer Producers · Packaging Recyclers · R&D / Pilot Plants |
| By Sales Model | Catalyst Supply · Catalyst + Process Package |
| Key Sub-Regions Covered, Manufacturing and recycling corridors | Ulsan · Yeosu · Seoul Capital Area · Busan · Daesan · Incheon |
South Korea Plastic Depolymerization Catalysts Market FAQs
How fast is South Korea plastic depolymerization catalysts market growing?
Sales in South Korea are forecast to expand at 13.2% CAGR from 2026 to 2036 due to country-specific recycling and polymer demand conditions.
Who leads South Korea plastic depolymerization catalysts market?
SK Geo Centric, LOTTE Chemical, Kolon Industries, LG Chem compete based on local technology access, process relevance, and recycling project participation.
What is driving adoption in South Korea plastic depolymerization catalysts market?
Adoption is supported by PET recycling needs, polymer buyer qualification, and stronger documentation requirements for recycled-content supply chains.
How fast is the plastic depolymerization catalysts market growing in the United States?
A 12.8% CAGR through 2036 is supported by commercial molecular recycling and national packaging recovery gaps.
Country Market Snapshot Table
| Parameter | Value |
|---|---|
| Market Size in 2025 (Value) | USD 137.4 million |
| Market Size in 2026 (Value) | USD 155.0 million |
| Market Forecast in 2036 (Value) | USD 516.9 million |
| CAGR (2026 to 2036) | 12.8% |
| Years Considered | 2021 to 2036 |
| Base Year | 2025 |
| Forecast Period | 2026 to 2036 |
| Units Considered | Value (USD million) |
| Leading Sub-Region | Tennessee, Texas, and Gulf Coast chemical corridors |
United States Plastic Depolymerization Catalysts Market Outlook
United States demand is centered on molecular recycling proof and national packaging recovery gaps. Commercial polyester renewal gives catalyst suppliers a visible reference point for plant-linked chemistry.
Buyers are expected to demand strong yield evidence because recycling claims face regulatory and customer scrutiny. Suppliers with operating references should gain earlier access to polymer and packaging customers.
Key Growth Drivers
- PET packaging and polyester waste create a practical monomer recovery base for catalyst sellers. EPA stated in October 2025 that PET bottles and jars had a 29.1% recycling rate, showing room for higher-value recovery routes.
- Commercial polyester renewal gives catalyst suppliers a visible proof point. Eastman reported in March 2024 that Kingsport output could support approximately USD 75.0 million in incremental EBITDA during 2024.
- USA brand owners need recycled-content supply that can meet packaging performance requirements and traceable purchasing standards.
- Process packages gain relevance because lenders want proven mass balance and commercial output before financing new recycling assets.
Key Restraints
- Packaging recycling remains low enough to keep feedstock aggregation under pressure. USA Plastics Pact reported a 13.3% national plastic packaging recycling rate in its 2023-24 impact work.
- Project finance decisions can delay large depolymerization plants because commercial references still need lender confidence.
- Feedstock collection varies by state and city system, which can increase sorting costs before catalysts are tested.
What makes United States unique
The United States is distinct because commercial methanolysis proof exists alongside large packaging recovery gaps.
Key Companies
- Eastman
- Honeywell UOP
- Agilyx
- Cyclyx International
Sales & Marketing Channels
- Direct sales to chemical recycling plants
- Process licensing contracts
- Polymer producer partnerships
- Brand-owner offtake programs
- Engineering and EPC alliances
- State-level grant channels
Country Segment Breakdown Table
| Segment | Sub-Segments |
|---|---|
| By Catalyst Type | Enzymatic Catalysts · Metal-based Catalysts · Acid / Base Catalysts · Zeolite / Other |
| By Polymer Feedstock | PET · Polyamides · Polyesters / PU · Mixed Plastics |
| By Process | Glycolysis · Methanolysis · Hydrolysis · Enzymatic Depolymerization |
| By End Use | Chemical Recycling Plants · Polymer Producers · Packaging Recyclers · R&D / Pilot Plants |
| By Sales Model | Catalyst Supply · Catalyst + Process Package |
| Key Sub-Regions Covered, Manufacturing and recycling corridors | Kingsport · Longview · Houston · Gulf Coast · Midwest · California |
United States Plastic Depolymerization Catalysts Market FAQs
How fast is United States plastic depolymerization catalysts market growing?
Sales in United States are forecast to expand at 12.8% CAGR from 2026 to 2036 due to country-specific recycling and polymer demand conditions.
Who leads United States plastic depolymerization catalysts market?
Eastman, Honeywell UOP, Agilyx, Cyclyx International compete based on local technology access, process relevance, and recycling project participation.
What is driving adoption in United States plastic depolymerization catalysts market?
Adoption is supported by PET recycling needs, polymer buyer qualification, and stronger documentation requirements for recycled-content supply chains.
How is the plastic depolymerization catalysts forecast developing in Japan?
A 12.7% CAGR through 2036 reflects process validation, careful buyer qualification, and Rewind PET participation.
Country Market Snapshot Table
| Parameter | Value |
|---|---|
| Market Size in 2025 (Value) | USD 49.7 million |
| Market Size in 2026 (Value) | USD 56.0 million |
| Market Forecast in 2036 (Value) | USD 185.1 million |
| CAGR (2026 to 2036) | 12.7% |
| Years Considered | 2021 to 2036 |
| Base Year | 2025 |
| Forecast Period | 2026 to 2036 |
| Units Considered | Value (USD million) |
| Leading Sub-Region | Kitakyushu, Kansai, and Tokyo industrial networks |
Japan Plastic Depolymerization Catalysts Market Outlook
Japan demand is shaped by process validation and careful buyer qualification. JEPLAN participation in Rewind PET gives the country a direct link to glycolysis and purification know-how.
Polymer producers and packaging buyers are likely to require detailed output evidence before broad adoption. This favors pilots, licensing partnerships, and process improvement work before larger local rollout.
Key Growth Drivers
- Kitakyushu process validation supports confidence in glycolysis-based PET recycling. Axens reported in October 2024 that Rewind PET commercialization followed work at a semi-industrial unit in Japan.
- Resource circulation policy keeps pressure on product design and waste recovery. Japan’s environment ministry stated in April 2024 that approved municipal plans can allow recyclers to recycle plastics without sorting and baling by municipalities.
- Japanese polymer buyers value high-purity monomers because quality-sensitive packaging and fiber applications require stable inputs.
- Licensor-led sales can grow because local buyers often prefer partnership models that reduce technology and operating uncertainty.
Key Restraints
- Feedstock logistics can raise unit cost for chemical recycling plants. Japan’s resource circulation framework relies on municipal planning, which can make feedstock access dependent on local coordination.
- Conservative buyer qualification can slow first commercial contracts before recovered monomers enter high-value applications.
- Domestic project scale is more constrained than China because feedstock volumes and plant economics require careful siting.
What makes Japan unique
Japan is unique because its role is centered on process validation and disciplined PET glycolysis qualification.
Key Companies
- JEPLAN
- Mitsubishi Chemical Group
- Toyobo
- Axens
Sales & Marketing Channels
- Technology licensing partnerships
- Polymer producer qualification
- Pilot plant collaboration
- Packaging brand trials
- Engineering company channels
- Municipal recycling program links
Country Segment Breakdown Table
| Segment | Sub-Segments |
|---|---|
| By Catalyst Type | Enzymatic Catalysts · Metal-based Catalysts · Acid / Base Catalysts · Zeolite / Other |
| By Polymer Feedstock | PET · Polyamides · Polyesters / PU · Mixed Plastics |
| By Process | Glycolysis · Methanolysis · Hydrolysis · Enzymatic Depolymerization |
| By End Use | Chemical Recycling Plants · Polymer Producers · Packaging Recyclers · R&D / Pilot Plants |
| By Sales Model | Catalyst Supply · Catalyst + Process Package |
| Key Sub-Regions Covered, Manufacturing and recycling corridors | Kitakyushu · Tokyo · Osaka · Nagoya · Yokohama · Kobe |
Japan Plastic Depolymerization Catalysts Market FAQs
How fast is Japan plastic depolymerization catalysts market growing?
Sales in Japan are forecast to expand at 12.7% CAGR from 2026 to 2036 due to country-specific recycling and polymer demand conditions.
Who leads Japan plastic depolymerization catalysts market?
JEPLAN, Mitsubishi Chemical Group, Toyobo, Axens compete based on local technology access, process relevance, and recycling project participation.
What is driving adoption in Japan plastic depolymerization catalysts market?
Adoption is supported by PET recycling needs, polymer buyer qualification, and stronger documentation requirements for recycled-content supply chains.
What is the plastic depolymerization catalysts market outlook in the United Kingdom?
An 11.9% CAGR through 2036 is shaped by recycled-content tax evidence and capacity limits.
Country Market Snapshot Table
| Parameter | Value |
|---|---|
| Market Size in 2025 (Value) | USD 37.5 million |
| Market Size in 2026 (Value) | USD 42.0 million |
| Market Forecast in 2036 (Value) | USD 129.3 million |
| CAGR (2026 to 2036) | 11.9% |
| Years Considered | 2021 to 2036 |
| Base Year | 2025 |
| Forecast Period | 2026 to 2036 |
| Units Considered | Value (USD million) |
| Leading Sub-Region | Teesside, Midlands, and national packaging clusters |
United Kingdom Plastic Depolymerization Catalysts Market Outlook
United Kingdom demand is shaped by recycled-content tax evidence and packaging documentation. Catalyst sales are tied to whether recycled inputs can be proven under compliance-heavy supply chains.
Local capacity is more limited than in larger chemical markets, so buyer interest is likely to focus on import evidence and offtake qualification. Suppliers need clear documentation around recycled content and traceability.
Key Growth Drivers
- Plastic Packaging Tax creates a direct cost signal for packaging with low recycled content. HM Revenue & Customs reported in August 2025 that the 2024 to 2025 rate was £217.85 per tonne.
- Tax design reinforces recycled-content documentation for packaging buyers. GOV.UK guidance stated in February 2026 that the tax applies to plastic packaging with less than 30% recycled plastic.
- Retail and food packaging buyers need reliable proof of recycled polymer inputs before accepting chemically recycled material.
- Importer compliance needs can support demand for catalysts used in certified material-to-material recycling supply chains.
Key Restraints
- Limited domestic plant capacity narrows near-term catalyst pull compared with the United States and Germany. Mura Wilton stated that its UK facility has 20kta production capacity, which keeps local scale focused.
- Compliance evidence can be difficult across complex imported packaging chains because suppliers must document composition across several tiers.
- Packaging buyers may delay commitments until chemical recycling outputs have clearer qualification under tax and retailer rules.
What makes United Kingdom unique
The United Kingdom is unique because tax evidence can influence recycled-content sourcing before local depolymerization capacity scales.
Key Companies
- Mura Technology
- Itero Technologies
- Plastic Energy
- ReVentas
Sales & Marketing Channels
- Packaging converter sales
- Importer compliance advisory channels
- Retail supplier qualification routes
- Polymer distributor partnerships
- Chemical recycling offtake agreements
- Industry association education channels
Country Segment Breakdown Table
| Segment | Sub-Segments |
|---|---|
| By Catalyst Type | Enzymatic Catalysts · Metal-based Catalysts · Acid / Base Catalysts · Zeolite / Other |
| By Polymer Feedstock | PET · Polyamides · Polyesters / PU · Mixed Plastics |
| By Process | Glycolysis · Methanolysis · Hydrolysis · Enzymatic Depolymerization |
| By End Use | Chemical Recycling Plants · Polymer Producers · Packaging Recyclers · R&D / Pilot Plants |
| By Sales Model | Catalyst Supply · Catalyst + Process Package |
| Key Sub-Regions Covered, Manufacturing and recycling corridors | Teesside · Midlands · North West · Scotland · South East · Wales |
United Kingdom Plastic Depolymerization Catalysts Market FAQs
How fast is United Kingdom plastic depolymerization catalysts market growing?
Sales in United Kingdom are forecast to expand at 11.9% CAGR from 2026 to 2036 due to country-specific recycling and polymer demand conditions.
Who leads United Kingdom plastic depolymerization catalysts market?
Mura Technology, Itero Technologies, Plastic Energy, ReVentas compete based on local technology access, process relevance, and recycling project participation.
What is driving adoption in United Kingdom plastic depolymerization catalysts market?
Adoption is supported by PET recycling needs, polymer buyer qualification, and stronger documentation requirements for recycled-content supply chains.
Who are the leading companies in the plastic depolymerization catalysts market?
Carbios, Axens, Eastman, Loop Industries, JEPLAN, IFPEN, BASF, Honeywell UOP, gr3n, and Wankai New Materials are profiled in the market.
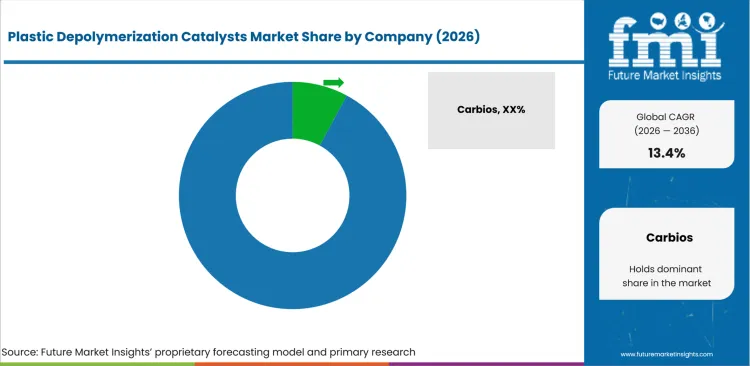
- Competition is shaped by route ownership, monomer purity evidence, and access to commercial plant references.
- Enzyme owners compete on PET selectivity and lower-temperature processing that supports high-value recycled outputs.
- Process licensors gain advantage when catalyst chemistry is packaged with design, performance guarantees, and start-up support.
- Integrated recyclers build stronger buyer confidence when they link depolymerization chemistry with offtake and polymerization economics.
The competitive structure is role-based because suppliers compete as enzyme owners, process licensors, integrated recyclers, and catalyst technology providers. Carbios is positioned around enzymatic PET depolymerization and licensing control. Axens and IFPEN compete through process design and purification know-how tied to Rewind PET.
Manufacturing and channel access depend on proof under real waste conditions. Eastman validates methanolysis at commercial scale in the United States. Loop Industries links depolymerization technology to rDMT and rMEG output through India and Europe projects. BASF adds chemical park access and wider chemical customer relationships.
Companies are better positioned when they can connect catalyst performance with plant economics and product qualification. Carbios is well placed in enzymatic PET routes. Axens and JEPLAN are better positioned in molecular recycling feedstock packages. Eastman and Loop are well placed when buyers need commercial evidence before signing offtake agreements.
How do top plastic depolymerization catalysts companies compare?
Companies compare by PET route depth, catalyst-process integration, monomer purity support, account access, and regional plant presence.
| Company | Portfolio/Focus | Account Access | Footprint/Service Reach |
|---|---|---|---|
| Carbios | Enzymatic PET depolymerization | Brand owners and PET producers | France and Asia licensing route |
| Axens | Glycolysis and purification process package | Refiners, chemical recyclers, and EPC partners | Global licensor network |
| Eastman | Methanolysis-based polyester renewal | Packaging and specialty materials customers | United States and Europe project base |
| Loop Industries | rDMT and rMEG depolymerization technology | Polymer partners and licensees | North America, Europe, and India |
| JEPLAN | Rewind PET partnership and process validation | Japanese recyclers and partners | Japan-centered process access |
| BASF | Chemical park and catalyst ecosystem | Chemical producers and industrial tenants | Global chemical footprint |
| Honeywell UOP | Process technology and catalyst ecosystem | Refiners and chemical processors | Global licensing and service network |
Source: Future Market Insights competitive analysis, 2026.
Who are the key players in the plastic depolymerization catalysts market?
The market includes technology owners, process licensors, chemical recyclers, catalyst suppliers, and regional polymer producers.
Key global companies leading the plastic depolymerization catalysts market include:
- Carbios
- Axens
- Eastman
- Loop Industries
- JEPLAN
- IFPEN
- BASF
- Honeywell UOP
- gr3n
- Wankai New Materials
Key Developments in Plastic Depolymerization Catalysts Market
- In March 2024, Eastman achieved on-spec initial production at its Kingsport molecular recycling facility and generated revenue from polyester renewal technology.
- In February 2026, Loop Industries selected BASF Industriepark Lausitz in Schwarzheide for a European facility planned at 70,000 metric tons per year.
Key Players in the Plastic Depolymerization Catalysts Market
Enzyme and biorecycling specialists
- Carbios
Process licensors and engineering-linked providers
- Axens
- IFPEN
- JEPLAN
- Honeywell UOP
Integrated recyclers and commercial plant developers
- Eastman
- Loop Industries
- gr3n
- BASF
- Wankai New Materials
- Ester Industries
Report Scope
| Attribute | Detail |
|---|---|
| Forecast period | 2026 to 2036 |
| Historical period | 2021 to 2025 |
| Quantitative unit | USD million |
| Segmentation | Catalyst Type, Polymer Feedstock, Process, End Use, Sales Model, and Region |
| Regions covered | North America, Latin America, Western Europe, Eastern Europe, East Asia, South Asia and Pacific, and Middle East and Africa |
| Countries covered | United States, United Kingdom, Germany, France, Japan, China, South Korea, and India |
| Key companies profiled | Carbios, Axens, Eastman, Loop Industries, JEPLAN, IFPEN, BASF, Honeywell UOP, gr3n, Wankai New Materials, and Ester Industries |
| Approach | Hybrid bottom-up and top-down methodology using plant activity, feedstock availability, catalyst route mapping, and segment adoption rates |
Source: Future Market Insights, 2026.
Plastic Depolymerization Catalysts Market - Scope & Definition
| Attribute | Detail |
|---|---|
| Market Definition | Catalysts, enzymes, and catalyst-process packages used to break plastic polymers into monomers or useful chemical intermediates for chemical recycling applications |
| Functions Covered | Polymer chain cleavage, monomer recovery, impurity control support, catalyst-process integration, and route selection for chemical recycling |
| Applications Covered | PET depolymerization, polyester renewal, polyamide recovery, PU-related recovery, and selected mixed-plastic chemical recycling routes |
| End-Use Industries | Chemical recycling plants, polymer producers, packaging recyclers, R&D centers, pilot plants, and process licensors |
| Grades Covered | Enzymatic Catalysts, Metal-based Catalysts, Acid / Base Catalysts, Zeolite / Other catalyst systems, and process-linked catalyst packages |
| Inclusions | Commercial and pilot catalyst systems used in PET, polyamides, polyesters / PU, mixed plastics, glycolysis, methanolysis, hydrolysis, and enzymatic depolymerization |
| Exclusions | Mechanical recycling additives, washing lines, sorting equipment, incineration catalysts, fuel-only pyrolysis units, virgin polymerization catalysts, commodity solvents, and recycling services not tied to depolymerization chemistry |
Plastic Depolymerization Catalysts Market - Research Methodology
| Method | Description |
|---|---|
| Primary Research | FMI analyst interviews with chemical recyclers, polymer producers, catalyst suppliers, process licensors, packaging converters, and recycling plant integrators across major markets |
| Desk Research | Review of government data, official plastic recycling programs, company technology disclosures, polymer chemistry literature, and recycling association publications |
| Market Sizing & Forecasting | Hybrid bottom-up and top-down model using catalyst consumption per plant, licensing-linked packages, feedstock availability, commissioning timelines, and process adoption by country |
| Data Validation | Cross-verification using commercial plant activity, PET depolymerization technology updates, company portfolios, country policy signals, and expert validation of route adoption |
Plastic Depolymerization Catalysts Market Breakdown by Catalyst Type, Polymer Feedstock, Process, End Use, Sales Model, and Region
Plastic Depolymerization Catalysts Market Segmented by Catalyst Type
- Enzymatic Catalysts
- Metal-based Catalysts
- Acid / Base Catalysts
- Zeolite / Other
Plastic Depolymerization Catalysts Market Segmented by Polymer Feedstock
- PET
- Polyamides
- Polyesters / PU
- Mixed Plastics
Plastic Depolymerization Catalysts Market Segmented by Process
- Glycolysis
- Methanolysis
- Hydrolysis
- Enzymatic Depolymerization
Plastic Depolymerization Catalysts Market Segmented by End Use
- Chemical Recycling Plants
- Polymer Producers
- Packaging Recyclers
- R&D / Pilot Plants
Plastic Depolymerization Catalysts Market Segmented by Sales Model
- Catalyst Supply
- Catalyst + Process Package
Plastic Depolymerization Catalysts Market by Region
- North America
- United States
- Canada
- Europe
- Germany
- United Kingdom
- France
- Italy
- Spain
- Asia Pacific
- China
- Japan
- South Korea
- Taiwan
- Singapore
- Latin America
- Brazil
- Mexico
- Argentina
- Middle East & Africa
- GCC Countries
- South Africa
- Israel
Research Sources and Bibliography
- USA Environmental Protection Agency. (2026, March 13). Plastics: Material-specific data. USA Environmental Protection Agency.
- USA Environmental Protection Agency. (2025, October 23). Frequent questions regarding EPA Facts and Figures. USA Environmental Protection Agency.
- European Commission. (2025). Packaging waste. European Commission.
- USA Plastics Pact. (2024). 2023-24 impact report. USA Plastics Pact.
- HM Revenue & Customs. (2025, August 28). Plastic Packaging Tax statistics commentary. GOV.UK.
- WRAP. (2024, November 19). UK Plastics Pact annual report 2023-24. WRAP.
- Japan Ministry of the Environment. (2024, April). Japan’s policy related to plastic resource circulation. Ministry of the Environment.
- Ministry of Environment, Forest and Climate Change. (2026, March 23). Parliament question: Plastic waste management. Press Information Bureau.
- United Nations Environment Programme. (2025, June 4). In pictures: How the Republic of Korea is taking on plastic pollution. United Nations Environment Programme.
- OECD. (2026, April). Chemical content validation of recycled plastics. OECD Publishing.
- Cao, J., and colleagues. (2024). Depolymerization mechanisms and closed-loop recycling of polyethylene terephthalate. Nature Communications.
- Carbios. (2024, April 25). CARBIOS celebrates the groundbreaking of its PET biorecycling plant. Carbios.
- Carbios. (2025, December 2). CARBIOS and Wankai New Materials sign the definitive agreement establishing a strategic partnership. Carbios.
- Eastman. (2024, March 21). Eastman molecular recycling facility achieves on-spec initial production and is generating revenue. Eastman.
- Axens. (2024, October 22). Axens, IFPEN and JEPLAN announce commercialization of Rewind PET chemical recycling process. Axens.
- Loop Industries. (2024, May 1). Loop Industries and Ester Industries announce joint venture agreement. Loop Industries.
- Loop Industries. (2026, February 17). Loop Industries European joint venture selects BASF-powered industrial park in Germany. Loop Industries.
- Agilyx. (2025). Turning plastic waste into value. Agilyx.
- Mura Technology. (2025). The next generation of advanced plastic recycling. Mura Technology.
- LOTTE Chemical. (2025, October 1). LOTTE Chemical participates in K 2025. LOTTE Chemical.
The bibliography is provided for reader reference and all retained entries support text inside this report.
This Report Answers
- Market size estimates for 2026 and forecasts through 2036 for the plastic depolymerization catalysts market.
- Analysis of demand across catalyst type, polymer feedstock, process, end use, and sales model categories.
- Evaluation of PET, polyamide, polyester / PU, and mixed-plastic feedstocks that shape catalyst demand.
- Assessment of recycled-content rules, material quality needs, and certification pressure affecting catalyst selection.
- Country-level growth analysis covering China, India, France, Germany, South Korea, the United States, Japan, and the United Kingdom.
- Comparison of companies active in enzymatic, glycolysis, methanolysis, and process-package depolymerization routes.
- Review of company developments from 2024 onward that shape plant-linked catalyst demand and licensing strategies.
- Explanation of Scope and Definition boundaries for included and excluded catalyst-related activities.
- Evaluation of competitive positioning by route depth, catalyst-process integration, account access, and footprint.
- Delivery of market data, country snapshots, segment breakdowns, and supporting analysis in Word report format.
Frequently Asked Questions
What is the growth prospect for plastic depolymerization catalysts?
Demand for plastic depolymerization catalysts is expected to rise as commercial recycling plants need higher-purity monomer recovery.
Which companies are expected to shape the plastic depolymerization catalysts market?
Carbios, Axens, Eastman, Loop Industries, JEPLAN, IFPEN, BASF, Honeywell UOP, gr3n, and Wankai are expected to shape market competition.
Why are polymer producers investing in plastic depolymerization catalysts?
Polymer producers are investing in depolymerization catalysts to recover reusable monomers from PET and polyester waste streams.
Why are process packages important in this market?
Process packages reduce first-plant risk by combining catalyst chemistry with design support, purification guidance, and start-up assistance.
Which catalyst formats are gaining attention?
Enzymatic catalysts and glycolysis-linked catalyst packages are gaining attention due to selectivity and commercial PET recycling relevance.
How do regulations influence catalyst selection?
Regulations influence catalyst selection by raising recycled-content requirements and increasing scrutiny of material quality evidence.
Why is PET important for this market?
PET is important because bottles, trays, and polyester textiles offer clearer monomer recovery routes than many mixed-plastic streams.
What role do country partnerships play in deployment?
Country partnerships help technology owners manage feedstock access, permitting, local buyer qualification, and project execution risk.
How do buyers compare catalyst suppliers?
Buyers compare catalyst suppliers by yield evidence, feedstock tolerance, impurity control, process support, and commercial operating references.
Preview the report firsthand - request a free sample
Get SampleGet the brochure for pricing and purchase details.
Get PDFTable of Content
- Key Takeaways
- Market Size and CAGR
- Top Growth Driver
- Fastest Growing Segment
- Leading Region
- Key Companies
- Emerging Opportunities
- Executive Summary
- Global Market Outlook
- Demand-side Trends
- Supply-side Trends
- Technology Roadmap Analysis
- Analysis and Recommendations
- Analyst Perspective (What is happening? Why now? What should investors know?)
- Key Questions Answered
- How large is the market?
- What is the CAGR?
- What are key trends?
- Which region dominates?
- Who are the leaders?
- Market Overview
- Market Coverage / Taxonomy
- Market Definition / Scope / Limitations
- Research Methodology
- Chapter Orientation
- Analytical Lens and Working Hypotheses
- Market Structure, Signals, and Trend Drivers
- Benchmarking and Cross-market Comparability
- Market Sizing, Forecasting, and Opportunity Mapping
- Research Design and Evidence Framework
- Desk Research Programme (Secondary Evidence)
- Expert Input and Fieldwork (Primary Evidence)
- Tooling, Models, and Reference Databases
- Data Engineering and Model Build
- Quality Assurance and Audit Trail
- Market Background
- Market Dynamics (Drivers, Restraints, Opportunity, Trends)
- Scenario Forecast (Optimistic, Likely, Conservative)
- Impact Analysis
- AI Impact
- Sustainability Impact
- Regulatory Impact
- Technology Impact
- Consumer / Buyer Analysis
- Purchase Drivers
- Adoption Barriers
- Buyer Journey
- Opportunity Map Analysis
- Product Life Cycle Analysis
- Supply Chain Analysis
- Investment Feasibility Matrix
- Value Chain Analysis
- PESTLE and Porter's Analysis
- Regulatory Landscape
- Regional Parent Market Outlook
- Production and Consumption Statistics
- Import and Export Statistics
- Global Market Analysis and Forecast, 2021 to 2036
- Historical Market Size Value (USD Million) & Volume (Unit) Analysis, 2021 to 2025
- Current and Future Market Size Value (USD Million) & Volume (Unit) Projections, 2026 to 2036
- Y-o-Y Growth Trend Analysis
- Absolute $ Opportunity Analysis
- Global Market Pricing Analysis, 2021 to 2036
- Global Market Analysis and Forecast, By Catalyst Type, 2021 to 2036
- Introduction / Key Findings
- Historical Market Size Value (USD Million) & Volume (Unit) Analysis By Catalyst Type, 2021 to 2025
- Current and Future Market Size Value (USD Million) & Volume (Unit) Analysis and Forecast By Catalyst Type, 2026 to 2036
- Enzymatic Catalysts
- Metal-based Catalysts
- Acid - Base Catalysts
- Zeolite - Other
- Enzymatic Catalysts
- Y-o-Y Growth Trend Analysis By Catalyst Type, 2021 to 2025
- Absolute $ Opportunity Analysis By Catalyst Type, 2026 to 2036
- Global Market Analysis and Forecast, By Polymer Feedstock, 2021 to 2036
- Introduction / Key Findings
- Historical Market Size Value (USD Million) & Volume (Unit) Analysis By Polymer Feedstock, 2021 to 2025
- Current and Future Market Size Value (USD Million) & Volume (Unit) Analysis and Forecast By Polymer Feedstock, 2026 to 2036
- PET
- Polyamides
- Polyesters - PU
- Mixed Plastics
- PET
- Y-o-Y Growth Trend Analysis By Polymer Feedstock, 2021 to 2025
- Absolute $ Opportunity Analysis By Polymer Feedstock, 2026 to 2036
- Global Market Analysis and Forecast, By Process, 2021 to 2036
- Introduction / Key Findings
- Historical Market Size Value (USD Million) & Volume (Unit) Analysis By Process, 2021 to 2025
- Current and Future Market Size Value (USD Million) & Volume (Unit) Analysis and Forecast By Process, 2026 to 2036
- Glycolysis
- Methanolysis
- Hydrolysis
- Enzymatic Depolymerization
- Glycolysis
- Y-o-Y Growth Trend Analysis By Process, 2021 to 2025
- Absolute $ Opportunity Analysis By Process, 2026 to 2036
- Global Market Analysis and Forecast, By End Use, 2021 to 2036
- Introduction / Key Findings
- Historical Market Size Value (USD Million) & Volume (Unit) Analysis By End Use, 2021 to 2025
- Current and Future Market Size Value (USD Million) & Volume (Unit) Analysis and Forecast By End Use, 2026 to 2036
- Chemical Recycling Plants
- Polymer Producers
- Packaging Recyclers
- R&D - Pilot Plants
- Chemical Recycling Plants
- Y-o-Y Growth Trend Analysis By End Use, 2021 to 2025
- Absolute $ Opportunity Analysis By End Use, 2026 to 2036
- Global Market Analysis and Forecast, By Sales Model, 2021 to 2036
- Introduction / Key Findings
- Historical Market Size Value (USD Million) & Volume (Unit) Analysis By Sales Model, 2021 to 2025
- Current and Future Market Size Value (USD Million) & Volume (Unit) Analysis and Forecast By Sales Model, 2026 to 2036
- Catalyst + Process Package
- Catalyst Supply
- Catalyst + Process Package
- Y-o-Y Growth Trend Analysis By Sales Model, 2021 to 2025
- Absolute $ Opportunity Analysis By Sales Model, 2026 to 2036
- Global Market Analysis and Forecast, By Region, 2021 to 2036
- Introduction
- Historical Market Size Value (USD Million) & Volume (Unit) Analysis By Region, 2021 to 2025
- Current Market Size Value (USD Million) & Volume (Unit) Analysis and Forecast By Region, 2026 to 2036
- North America
- Latin America
- Western Europe
- Eastern Europe
- East Asia
- South Asia and Pacific
- Middle East & Africa
- Market Attractiveness Analysis By Region
- North America Market Analysis and Forecast, By Country, 2021 to 2036
- Historical Market Size Value (USD Million) & Volume (Unit) Trend Analysis By Market Taxonomy, 2021 to 2025
- Market Size Value (USD Million) & Volume (Unit) Forecast By Market Taxonomy, 2026 to 2036
- By Country
- USA
- Canada
- Mexico
- By Catalyst Type
- By Polymer Feedstock
- By Process
- By End Use
- By Sales Model
- By Country
- Market Attractiveness Analysis
- By Country
- By Catalyst Type
- By Polymer Feedstock
- By Process
- By End Use
- By Sales Model
- Key Takeaways
- Latin America Market Analysis and Forecast, By Country
- Historical Market Size Value (USD Million) & Volume (Unit) Trend Analysis By Market Taxonomy, 2021 to 2025
- Market Size Value (USD Million) & Volume (Unit) Forecast By Market Taxonomy, 2026 to 2036
- By Country
- Brazil
- Chile
- Rest of Latin America
- By Catalyst Type
- By Polymer Feedstock
- By Process
- By End Use
- By Sales Model
- By Country
- Market Attractiveness Analysis
- By Country
- By Catalyst Type
- By Polymer Feedstock
- By Process
- By End Use
- By Sales Model
- Key Takeaways
- Western Europe Market Analysis and Forecast, By Country
- Historical Market Size Value (USD Million) & Volume (Unit) Trend Analysis By Market Taxonomy, 2021 to 2025
- Market Size Value (USD Million) & Volume (Unit) Forecast By Market Taxonomy, 2026 to 2036
- By Country
- Germany
- UK
- Italy
- Spain
- France
- Nordic
- BENELUX
- Rest of Western Europe
- By Catalyst Type
- By Polymer Feedstock
- By Process
- By End Use
- By Sales Model
- By Country
- Market Attractiveness Analysis
- By Country
- By Catalyst Type
- By Polymer Feedstock
- By Process
- By End Use
- By Sales Model
- Key Takeaways
- Eastern Europe Market Analysis and Forecast, By Country
- Historical Market Size Value (USD Million) & Volume (Unit) Trend Analysis By Market Taxonomy, 2021 to 2025
- Market Size Value (USD Million) & Volume (Unit) Forecast By Market Taxonomy, 2026 to 2036
- By Country
- Russia
- Poland
- Hungary
- Balkan & Baltic
- Rest of Eastern Europe
- By Catalyst Type
- By Polymer Feedstock
- By Process
- By End Use
- By Sales Model
- By Country
- Market Attractiveness Analysis
- By Country
- By Catalyst Type
- By Polymer Feedstock
- By Process
- By End Use
- By Sales Model
- Key Takeaways
- East Asia Market Analysis and Forecast, By Country
- Historical Market Size Value (USD Million) & Volume (Unit) Trend Analysis By Market Taxonomy, 2021 to 2025
- Market Size Value (USD Million) & Volume (Unit) Forecast By Market Taxonomy, 2026 to 2036
- By Country
- China
- Japan
- South Korea
- By Catalyst Type
- By Polymer Feedstock
- By Process
- By End Use
- By Sales Model
- By Country
- Market Attractiveness Analysis
- By Country
- By Catalyst Type
- By Polymer Feedstock
- By Process
- By End Use
- By Sales Model
- Key Takeaways
- South Asia and Pacific Market Analysis and Forecast, By Country
- Historical Market Size Value (USD Million) & Volume (Unit) Trend Analysis By Market Taxonomy, 2021 to 2025
- Market Size Value (USD Million) & Volume (Unit) Forecast By Market Taxonomy, 2026 to 2036
- By Country
- India
- ASEAN
- Australia & New Zealand
- Rest of South Asia and Pacific
- By Catalyst Type
- By Polymer Feedstock
- By Process
- By End Use
- By Sales Model
- By Country
- Market Attractiveness Analysis
- By Country
- By Catalyst Type
- By Polymer Feedstock
- By Process
- By End Use
- By Sales Model
- Key Takeaways
- Middle East & Africa Market Analysis and Forecast, By Country
- Historical Market Size Value (USD Million) & Volume (Unit) Trend Analysis By Market Taxonomy, 2021 to 2025
- Market Size Value (USD Million) & Volume (Unit) Forecast By Market Taxonomy, 2026 to 2036
- By Country
- Kingdom of Saudi Arabia
- Other GCC Countries
- Türkiye
- South Africa
- Other African Union
- Rest of Middle East & Africa
- By Catalyst Type
- By Polymer Feedstock
- By Process
- By End Use
- By Sales Model
- By Country
- Market Attractiveness Analysis
- By Country
- By Catalyst Type
- By Polymer Feedstock
- By Process
- By End Use
- By Sales Model
- Key Takeaways
- Key Countries Market Analysis
- USA
- Pricing Analysis
- Market Share Analysis, 2025
- By Catalyst Type
- By Polymer Feedstock
- By Process
- By End Use
- By Sales Model
- Canada
- Pricing Analysis
- Market Share Analysis, 2025
- By Catalyst Type
- By Polymer Feedstock
- By Process
- By End Use
- By Sales Model
- Mexico
- Pricing Analysis
- Market Share Analysis, 2025
- By Catalyst Type
- By Polymer Feedstock
- By Process
- By End Use
- By Sales Model
- Brazil
- Pricing Analysis
- Market Share Analysis, 2025
- By Catalyst Type
- By Polymer Feedstock
- By Process
- By End Use
- By Sales Model
- Chile
- Pricing Analysis
- Market Share Analysis, 2025
- By Catalyst Type
- By Polymer Feedstock
- By Process
- By End Use
- By Sales Model
- Germany
- Pricing Analysis
- Market Share Analysis, 2025
- By Catalyst Type
- By Polymer Feedstock
- By Process
- By End Use
- By Sales Model
- UK
- Pricing Analysis
- Market Share Analysis, 2025
- By Catalyst Type
- By Polymer Feedstock
- By Process
- By End Use
- By Sales Model
- Italy
- Pricing Analysis
- Market Share Analysis, 2025
- By Catalyst Type
- By Polymer Feedstock
- By Process
- By End Use
- By Sales Model
- Spain
- Pricing Analysis
- Market Share Analysis, 2025
- By Catalyst Type
- By Polymer Feedstock
- By Process
- By End Use
- By Sales Model
- France
- Pricing Analysis
- Market Share Analysis, 2025
- By Catalyst Type
- By Polymer Feedstock
- By Process
- By End Use
- By Sales Model
- India
- Pricing Analysis
- Market Share Analysis, 2025
- By Catalyst Type
- By Polymer Feedstock
- By Process
- By End Use
- By Sales Model
- ASEAN
- Pricing Analysis
- Market Share Analysis, 2025
- By Catalyst Type
- By Polymer Feedstock
- By Process
- By End Use
- By Sales Model
- Australia & New Zealand
- Pricing Analysis
- Market Share Analysis, 2025
- By Catalyst Type
- By Polymer Feedstock
- By Process
- By End Use
- By Sales Model
- China
- Pricing Analysis
- Market Share Analysis, 2025
- By Catalyst Type
- By Polymer Feedstock
- By Process
- By End Use
- By Sales Model
- Japan
- Pricing Analysis
- Market Share Analysis, 2025
- By Catalyst Type
- By Polymer Feedstock
- By Process
- By End Use
- By Sales Model
- South Korea
- Pricing Analysis
- Market Share Analysis, 2025
- By Catalyst Type
- By Polymer Feedstock
- By Process
- By End Use
- By Sales Model
- Russia
- Pricing Analysis
- Market Share Analysis, 2025
- By Catalyst Type
- By Polymer Feedstock
- By Process
- By End Use
- By Sales Model
- Poland
- Pricing Analysis
- Market Share Analysis, 2025
- By Catalyst Type
- By Polymer Feedstock
- By Process
- By End Use
- By Sales Model
- Hungary
- Pricing Analysis
- Market Share Analysis, 2025
- By Catalyst Type
- By Polymer Feedstock
- By Process
- By End Use
- By Sales Model
- Kingdom of Saudi Arabia
- Pricing Analysis
- Market Share Analysis, 2025
- By Catalyst Type
- By Polymer Feedstock
- By Process
- By End Use
- By Sales Model
- Türkiye
- Pricing Analysis
- Market Share Analysis, 2025
- By Catalyst Type
- By Polymer Feedstock
- By Process
- By End Use
- By Sales Model
- South Africa
- Pricing Analysis
- Market Share Analysis, 2025
- By Catalyst Type
- By Polymer Feedstock
- By Process
- By End Use
- By Sales Model
- USA
- Market Structure Analysis
- Competition Dashboard
- Competition Benchmarking
- Market Share Analysis of Top Players
- By Regional
- By Catalyst Type
- By Polymer Feedstock
- By Process
- By End Use
- By Sales Model
- Emerging Startups
- Innovation Benchmarking
- Competition Analysis
- Competition Deep Dive
- Carbios
- Overview
- Product Portfolio
- Profitability by Market Segments (Product/Region/Sales Channel)
- Sales Footprint
- Strategy Overview
- Marketing Strategy
- Product Strategy
- Channel Strategy
- Axens
- Eastman
- Loop Industries
- JEPLAN
- IFPEN
- BASF
- Honeywell UOP
- gr3n
- Wankai New Materials
- Ester Industries
- Carbios
- Case Studies
- Success Stories
- Recent Developments
- Competition Deep Dive
- Assumptions & Acronyms Used


