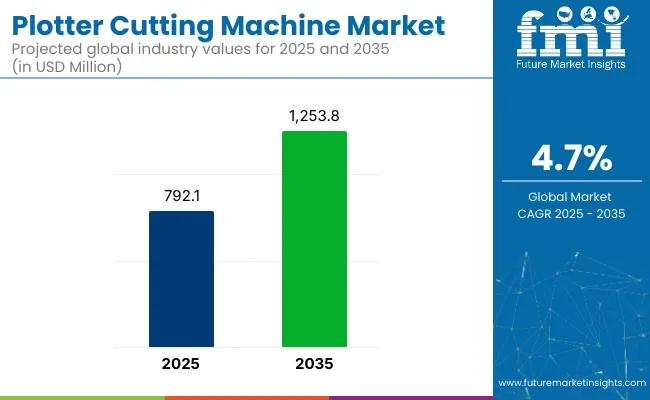
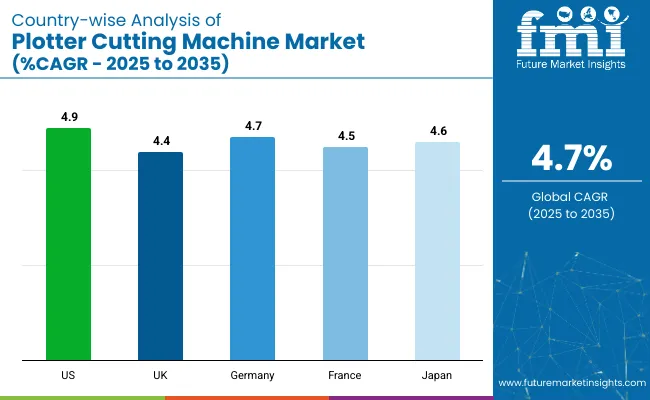
The plotter cutting machine market is anticipated to be valued at USD 792.09 million in 2025. It is expected to grow at a CAGR of 4.7% during the forecast period and reach a value of USD 1,253.84 million in 2035.
In 2024, the plotter cutting machine market saw steady growth, driven by automation adoption in the packaging, textiles, and automotive industries. The companies are in the process of developing AI-based controls that enhance machine precision and speed. Affordable user-friendly models were increasingly adopted by small and medium-sized enterprises (SMEs). However, high entry costs continued to plague all industries, especially SMEs, even if the all-too-anticipated growth started to emerge.
Contrarily, the states of a shortage of skilled personnel have certainly impeded the effective operation of machines in developing regions. Manufacturers thus initiated training programs and provided simplified machine interface systems to lure further customers. This hybridization of laser-waterjet cutting machines has shown favorable commercial acceptance, diversifying the application portfolio.
Sustainability will be an important driver in 2025 and beyond. The demand for sustainable manufacturing is driving the move to automated, software-enhanced systems to minimize waste, eliminate bad practices and improve performance. The growing focus on sustainable production will increase uptake, with the packaging and textile sectors at the forefront of this trend.
The synergic application of AI and machine learning will meaningfully enhance precision, speed, and automation. These changes will simultaneously reduce production costs and improve quality. Application growth in fashion design and custom packaging will fuel expansion. Continuous innovation and cost reduction will help companies stay competitive through 2035.
Survey conducted in Q4 2024, n=500 stakeholder participants evenly distributed across manufacturers, distributors, and end-users in North America, Europe, and Asia-Pacific
Regional Variance:
High Variance:
Convergent and Divergent Perspectives on ROI:
69% of North American stakeholders deemed automation "worth the investment," while only 36% of SMEs in Asia-Pacific agreed, preferring cost-effective manual models.
Consensus:
Steel-Based Construction: Preferred by 63% globally due to durability in high-volume operations.
Variance:
Shared Challenges:
84% of respondents cited rising material costs as a primary concern, with steel and electronic component prices up 25% year-over-year.
Regional Differences:
Manufacturers:
Distributors:
End-Users:
Alignment:
72% of global manufacturers plan to increase R&D spending on automation and AI integration.
Divergence:
High Consensus:
Automation, cost efficiency, and sustainability are critical drivers across all regions.
Key Variances:
Strategic Insight:
A standardized approach will not work. Companies must tailor their offerings based on regional needs-advanced automation in North America, sustainable designs in Europe, and affordable, space-saving models in Asia-Pacific.
Countries/Regions | Regulations & Certifications Impacting the Industry |
---|---|
United States |
|
European Union |
|
United Kingdom |
|
China |
|
Japan |
|
India |
|
South Korea |
|
2020 to 2024 | 2025 to 2035 (Forecasted) |
---|---|
Moderate growth in the face of COVID-19 disruptions, supply chain limitations, and volatile raw material prices. | Driven by automation, AI integration, and the need for precision cutting across industries. |
Limited use of automation and AI-based solutions; manual and semi-automatic machines were the norm. | Widespread use of AI-driven cutting, IoT-based monitoring, and fully automated systems for greater efficiency. |
Textile, automotive, and signage sectors were major consumers. | Growing applications in sports, electronics, and packaging, and ongoing demand in legacy sectors. |
Low focus on green production; dependence on conventional materials. | Sustainability focus high, with producers embracing recyclable materials and energy-efficient manufacturing processes. |
Regional players dominated the industry with little global expansion. | Greater competition from increased investment by global manufacturers and strategic partnerships. |
Limited regulatory intervention on machine emissions and waste disposal in the early years, with growing scrutiny anticipated up to 2035. | Tighter regulations on industrial emissions, sustainability, and workplace health and safety fueling innovation and product development. |
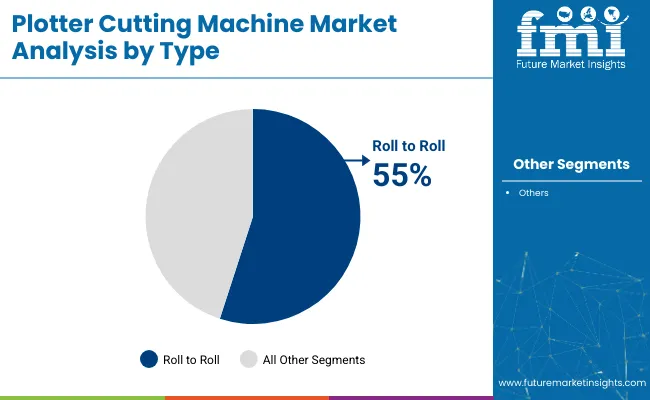
The roll to roll segment is set to dominate the plotter cutting machine market, maintaining a CAGR of 4.1% from 2025 to 2035. This segment’s growth is driven by its capability to handle bulk materials efficiently, making it an essential choice for industries such as textiles, automotive, and packaging.
These machines enhance production speed by cutting multiple rolls simultaneously while minimizing material waste. Increasing demand for precision cutting and rising automation adoption in manufacturing processes further fuel growth. Government regulations promoting sustainable production and reduced industrial waste also contribute to the expanding adoption of roll to roll cutting systems.
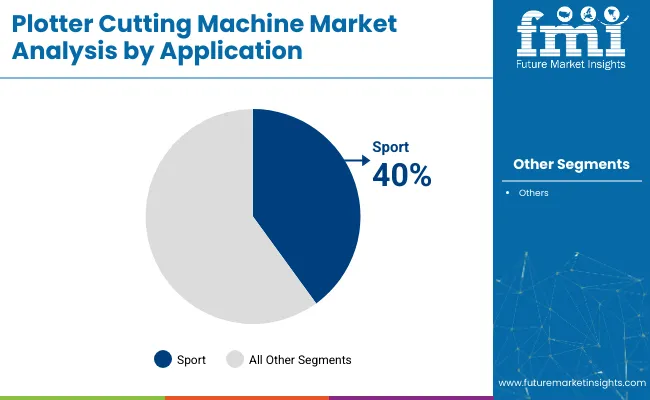
The sports segment is set to grow steadily from 2025 to 2035, driven by increasing demand for customized sportswear, footwear, and equipment. Advanced cutting technology enables the precise shaping of lightweight, durable materials, improving product performance and quality.
Manufacturers are integrating automation and AI-powered solutions to enhance production efficiency and mass customization. Rising investments in advanced manufacturing technologies further support the segment’s expansion. Additionally, sustainability initiatives in the sports industry are encouraging the adoption of eco-friendly materials, strengthening demand for automated cutting solutions in this sector.
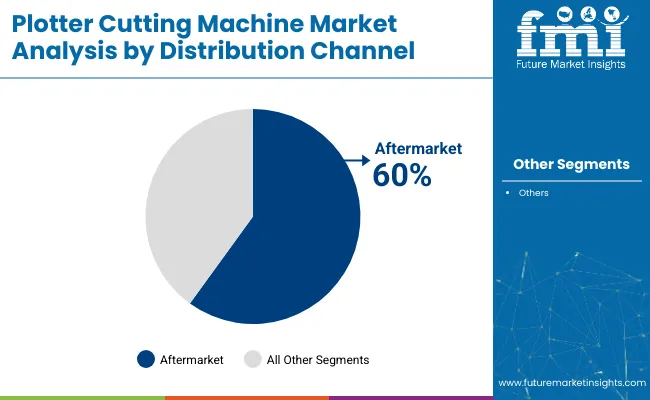
The aftermarket segment is expanding as businesses seek cost-effective maintenance and component replacement solutions. Increasing demand for refurbished machines and the availability of third-party spare parts support the segment’s growth.
Companies are prioritizing cost-efficient strategies to extend equipment lifespan while ensuring optimal performance.
The integration of AI-driven cutting precision and software upgrades enhances machine capabilities, boosting aftermarket sales. Additionally, the rising preference for modular machine designs allows easy component replacements, further driving industry expansion through aftermarket distribution channels.
The USA plotter cutting machine market is expected to expand at a CAGR of 4.9% during the period 2025 to 2035, led by increasing demand for automation in the printing, textile, and signage sectors. The use of AI-driven cutting machines is improving accuracy and operational efficiency in different industries.
Government incentives for digital manufacturing and Industry 4.0 implementation are driving demand for smart cutting solutions. The packaging sector is a major driver, with growing dependence on automated cutting systems for mass customization and quick prototyping.
The growth of the e-commerce industry is driving demand for customized packaging and marketing materials, thus increasing adoption of digital cutting solutions. The increased trend of customization in the fashion and crafting sectors is also boosting demand for cutting-edge cutting technologies.
Leading producers are making significant investments in cloud-based software offerings that allow effortless integration with design programs. Industry expansion is predicted to continue through 2035 through the transformation toward smart factories and automated manufacturing lines.
The UK is anticipated to register a CAGR of 4.4% from 2025 to 2035 due to growing investment in digital printing and textile personalization. Companies are being spurred on to implement more energy-efficient cutting machines due to the growing emphasis on sustainability.
The strategy of the UK government toward Net Zero has also forced industries to introduce eco-friendly production methods and consequently increased the demand for machines to cut so much material wasted. Digital cutting technology has increasingly penetrated the sign-making and advertising industries as they become more efficient and reduce production discrepancies.
Moreover, the rapid growth of e-commerce and small-scale personalization businesses will lead to increased demand. Automated cutting solutions will potentially dominate personal home decoration, packaging, and fashion accessories.
Manufacturers are integrating artificial intelligence and IoT capabilities for improved precision and workflow automation. User-friendliness, compactness, and affordability further fuel demand among entrepreneurs and creative practitioners for small, portable cutting machines.
France is anticipated to expand at a CAGR of 4.5% from 2025 to 2035, supported by the growing adoption of digital manufacturing technologies. The fashion and textile industries are key contributors to industry expansion, with rising demand for automated cutting solutions.
The French government’s support for digital transformation in industrial production is driving investment in high-precision cutting systems. The signage and advertising industry is also seeing increased adoption of digital cutting tools for rapid and precise output.
The increasing use of eco-friendly materials in fashion and packaging is pushing demand for machines that optimize material usage and reduce waste. This trend is encouraging manufacturers to introduce sustainable cutting technologies.
Companies are focusing on real-time monitoring and cloud-based design integration to enhance operational efficiency. The rise of digital customization businesses is expected to sustain long-term industry growth.
Germany is projected to grow at a CAGR of 4.7% from 2025 to 2035, backed by strong industrial automation trends and technological advancements in textile production. The demand for precise and high-speed cutting solutions is increasing across various sectors.
The German manufacturing sector is rapidly adopting AI-driven cutting technologies to improve accuracy and reduce production time. The automotive industry is also a key adopter, utilizing advanced cutting systems for customized interior materials and upholstery.
The growing demand for high-quality signage, packaging, and promotional materials is further driving industry growth. Companies are shifting toward laser and digital cutting technologies to achieve intricate designs with minimal material wastage.
Manufacturers are investing in robotics and AI to enhance machine capabilities. The increasing adoption of cloud-based design and workflow automation solutions is expected to drive long-term industry expansion.
Italy is forecasted to expand at a CAGR of 4.3% from 2025 to 2035, driven by strong demand from the fashion, leather, and packaging industries. The rise of customization in apparel and luxury goods is fueling investment in high-precision cutting machines.
Italy’s National Industry 4.0 Plan is promoting digital transformation, encouraging manufacturers to integrate smart cutting solutions into their production processes. The sign-making industry is also embracing advanced digital cutters for large-scale and intricate designs.
The growing preference for sustainable materials in the fashion industry is pushing demand for automated cutting solutions that optimize resource usage. Additionally, the packaging sector is leveraging these machines for personalized and high-quality branding solutions.
Leading manufacturers are focusing on enhancing speed, precision, and automation in cutting technology. The increasing demand for compact and multifunctional cutting systems is expected to sustain industry growth in Italy.
South Korea is expected to register a CAGR of 4.8% from 2025 to 2035, fueled by advancements in smart manufacturing and precision engineering. The need for highly accurate cutting solutions is increasing in the electronics, textile, and packaging sectors.
The South Korean government’s Smart Factory Initiative is driving the adoption of AI-powered cutting machines in industrial applications. The demand for compact, high-speed digital cutting systems is rising in the country’s booming customization and e-commerce sectors.
The integration of IoT and cloud-based design platforms is enhancing production efficiency in the apparel and signage industries. Companies are investing in automation and digital transformation to improve production speed and accuracy.
Manufacturers are developing energy-efficient and multifunctional cutting machines to cater to diverse industry needs. The trend toward mass customization in consumer goods and personalized branding is expected to sustain long-term industry growth.
Japan is projected to grow at a CAGR of 4.6% from 2025 to 2035, driven by the country’s leadership in precision engineering and digital automation. The textile, electronics, and packaging industries are key contributors to industry expansion.
The Japanese government’s focus on smart manufacturing is encouraging industries to integrate AI-driven cutting solutions. The demand for compact, high-speed cutting machines is increasing in the customized fashion, signage, and home décor sectors.
The rising use of eco-friendly materials in production is driving the adoption of digital cutting solutions that reduce waste and improve efficiency. Companies are increasingly integrating cloud-based design software for seamless production workflows.
Manufacturers are focusing on AI and IoT-enabled cutting machines to enhance precision and automation. The growing emphasis on sustainability and energy-efficient manufacturing solutions is expected to support long-term industry growth.
China is forecasted to expand at a CAGR of 5.6% from 2025 to 2035, fueled by rapid industrialization and increasing demand for digital manufacturing solutions. The packaging, textile, and advertising industries are key drivers of growth.
China’s Five-Year Plan emphasizes the adoption of smart automation in manufacturing, pushing demand for high-speed, AI-integrated cutting machines. The booming e-commerce industry is also driving investment in customized packaging and branding solutions.
The expansion of the country’s fashion industry is further increasing demand for precision cutting technologies. Additionally, the rise of digital signage and promotional material production is accelerating industry growth.
Manufacturers are leveraging automation and AI-driven analytics to enhance machine efficiency. The increasing adoption of cloud-based design tools and workflow automation is expected to sustain long-term industry expansion.
Australia and New Zealand are expected to grow at a CAGR of 4.2% from 2025 to 2035, driven by rising demand from e-commerce, retail, and advertising industries. The need for high-speed and precision cutting solutions is increasing.
Australia’s digital transformation initiatives are encouraging businesses to adopt automated cutting machines for signage, promotional materials, and packaging. The country’s fashion and interior design industries are also driving demand for digital cutting solutions.
New Zealand’s growing custom apparel and home décor sectors are fueling investments in high-precision cutting machines. The trend toward personalized branding in small businesses is further supporting industry expansion.
Manufacturers are developing versatile and compact cutting machines to cater to a diverse range of applications. The increasing adoption of automation and cloud-based design software is expected to drive sustained industry growth in both countries.
The plotter cutting machine market in 2024 has seen key players like Cricut, Graphtec, and Roland DG focus on innovation. Cricut introduces the AI-involved smart cutting machine, which guarantees precision. Graphtec also launched the high-speed plotters, but for industrial applications. It worked with Roland DG to expand its reach and improve efficiency and user options with applications that run in the cloud, integrated with the hardware.
Cricut, Graphtec, and Roland DG emerge as industry leaders; Cricut is for the consumer, whereas Graphtec and Roland DG partition for industrial and professional applications. On the other hand, Silhouette America and Brother International Corporation carve out niche segments with relevant budget offerings and maintain competitive positions in this very fragmented industry.
According to the report by TechCrunch in March of 2024, Cricut acquired a European startup that deals with AI-driven software for design. This move was undertaken to improve its product offerings and that's building up its presence in the industry. These acquisitions underscore the increasing focus of the sector on integrating software and upgrades in technology to make competition possible.
In 2024, automating and AI features were the ones that gained momentum. High-speed cutting systems with cloud design storage were developed along with other smart calibration systems by Graphtec and Roland DG. They will go a long way toward accuracy and productivity. The Asia-Pacific is also witnessing growth on account of demand for mass customization in clothing and sign making.
Customization and personalization pushed demand in 2024. Silhouette America introduced a flexible machine with easy-to-use functionalities that are attractive to small businesses and makers. Customization efforts have enabled companies to meet changing consumer tastes and improve their industry standing.
Sustainability was the main concern in 2024. Roland DG launched environmentally friendly materials and energy-saving machines in line with international environmental trends. These efforts not only boost the company's image but also respond to the increasing demand for eco-friendly manufacturing solutions.
Overall, 2024 has been revolutionary for the plotter cutting machine market, with innovation in automation, customization, and sustainability driving expansion. Strategic collaborations and mergers and acquisitions have also further streamlined the industry, setting top players up for long-term success.
By type, the market is segmented into roll to roll, flat bed, and others.
In terms of application, the market is segmented into sports, decoration, and construction.
By distribution channel, the market is segmented into OEM and aftermarket.
The market is segmented by region into North America, Latin America, Western Europe, South Asia & Pacific, East Asia, Middle East, and Africa.
Table 1: Global Value (US$ Million) Forecast by Region, 2018 & 2033
Table 2: Global Volume (Tons) Forecast by Region, 2018 & 2033
Table 3: Global Value (US$ Million) Forecast by Type, 2018 & 2033
Table 4: Global Volume (Tons) Forecast by Type, 2018 & 2033
Table 5: Global Value (US$ Million) Forecast by Application, 2018 & 2033
Table 6: Global Volume (Tons) Forecast by Application, 2018 & 2033
Table 7: Global Value (US$ Million) Forecast by Distribution Channel, 2018 & 2033
Table 8: Global Volume (Tons) Forecast by Distribution Channel, 2018 & 2033
Table 9: North America Value (US$ Million) Forecast by Country, 2018 & 2033
Table 10: North America Volume (Tons) Forecast by Country, 2018 & 2033
Table 11: North America Value (US$ Million) Forecast by Type, 2018 & 2033
Table 12: North America Volume (Tons) Forecast by Type, 2018 & 2033
Table 13: North America Value (US$ Million) Forecast by Application, 2018 & 2033
Table 14: North America Volume (Tons) Forecast by Application, 2018 & 2033
Table 15: North America Value (US$ Million) Forecast by Distribution Channel, 2018 & 2033
Table 16: North America Volume (Tons) Forecast by Distribution Channel, 2018 & 2033
Table 17: Latin America Value (US$ Million) Forecast by Country, 2018 & 2033
Table 18: Latin America Volume (Tons) Forecast by Country, 2018 & 2033
Table 19: Latin America Value (US$ Million) Forecast by Type, 2018 & 2033
Table 20: Latin America Volume (Tons) Forecast by Type, 2018 & 2033
Table 21: Latin America Value (US$ Million) Forecast by Application, 2018 & 2033
Table 22: Latin America Volume (Tons) Forecast by Application, 2018 & 2033
Table 23: Latin America Value (US$ Million) Forecast by Distribution Channel, 2018 & 2033
Table 24: Latin America Volume (Tons) Forecast by Distribution Channel, 2018 & 2033
Table 25: Western Europe Value (US$ Million) Forecast by Country, 2018 & 2033
Table 26: Western Europe Volume (Tons) Forecast by Country, 2018 & 2033
Table 27: Western Europe Value (US$ Million) Forecast by Type, 2018 & 2033
Table 28: Western Europe Volume (Tons) Forecast by Type, 2018 & 2033
Table 29: Western Europe Value (US$ Million) Forecast by Application, 2018 & 2033
Table 30: Western Europe Volume (Tons) Forecast by Application, 2018 & 2033
Table 31: Western Europe Value (US$ Million) Forecast by Distribution Channel, 2018 & 2033
Table 32: Western Europe Volume (Tons) Forecast by Distribution Channel, 2018 & 2033
Table 33: Eastern Europe Value (US$ Million) Forecast by Country, 2018 & 2033
Table 34: Eastern Europe Volume (Tons) Forecast by Country, 2018 & 2033
Table 35: Eastern Europe Value (US$ Million) Forecast by Type, 2018 & 2033
Table 36: Eastern Europe Volume (Tons) Forecast by Type, 2018 & 2033
Table 37: Eastern Europe Value (US$ Million) Forecast by Application, 2018 & 2033
Table 38: Eastern Europe Volume (Tons) Forecast by Application, 2018 & 2033
Table 39: Eastern Europe Value (US$ Million) Forecast by Distribution Channel, 2018 & 2033
Table 40: Eastern Europe Volume (Tons) Forecast by Distribution Channel, 2018 & 2033
Table 41: East Asia Value (US$ Million) Forecast by Country, 2018 & 2033
Table 42: East Asia Volume (Tons) Forecast by Country, 2018 & 2033
Table 43: East Asia Value (US$ Million) Forecast by Type, 2018 & 2033
Table 44: East Asia Volume (Tons) Forecast by Type, 2018 & 2033
Table 45: East Asia Value (US$ Million) Forecast by Application, 2018 & 2033
Table 46: East Asia Volume (Tons) Forecast by Application, 2018 & 2033
Table 47: East Asia Value (US$ Million) Forecast by Distribution Channel, 2018 & 2033
Table 48: East Asia Volume (Tons) Forecast by Distribution Channel, 2018 & 2033
Table 49: South Asia Value (US$ Million) Forecast by Country, 2018 & 2033
Table 50: South Asia Volume (Tons) Forecast by Country, 2018 & 2033
Table 51: South Asia Value (US$ Million) Forecast by Type, 2018 & 2033
Table 52: South Asia Volume (Tons) Forecast by Type, 2018 & 2033
Table 53: South Asia Value (US$ Million) Forecast by Application, 2018 & 2033
Table 54: South Asia Volume (Tons) Forecast by Application, 2018 & 2033
Table 55: South Asia Value (US$ Million) Forecast by Distribution Channel, 2018 & 2033
Table 56: South Asia Volume (Tons) Forecast by Distribution Channel, 2018 & 2033
Table 57: MEA Value (US$ Million) Forecast by Country, 2018 & 2033
Table 58: MEA Volume (Tons) Forecast by Country, 2018 & 2033
Table 59: MEA Value (US$ Million) Forecast by Type, 2018 & 2033
Table 60: MEA Volume (Tons) Forecast by Type, 2018 & 2033
Table 61: MEA Value (US$ Million) Forecast by Application, 2018 & 2033
Table 62: MEA Volume (Tons) Forecast by Application, 2018 & 2033
Table 63: MEA Value (US$ Million) Forecast by Distribution Channel, 2018 & 2033
Table 64: MEA Volume (Tons) Forecast by Distribution Channel, 2018 & 2033
Figure 1: Global Value (US$ Million) by Type, 2022 & 2032
Figure 2: Global Value (US$ Million) by Application, 2022 & 2032
Figure 3: Global Value (US$ Million) by Distribution Channel, 2022 & 2032
Figure 4: Global Value (US$ Million) by Region, 2022 & 2032
Figure 5: Global Value (US$ Million) Analysis by Region, 2018 & 2033
Figure 6: Global Volume (Tons) Analysis by Region, 2018 & 2033
Figure 7: Global Value Share (%) and BPS Analysis by Region, 2022 & 2032
Figure 8: Global Y-o-Y Growth (%) Projections by Region, 2023 to 2033
Figure 9: Global Value (US$ Million) Analysis by Type, 2018 & 2033
Figure 10: Global Volume (Tons) Analysis by Type, 2018 & 2033
Figure 11: Global Value Share (%) and BPS Analysis by Type, 2022 & 2032
Figure 12: Global Y-o-Y Growth (%) Projections by Type, 2023 to 2033
Figure 13: Global Value (US$ Million) Analysis by Application, 2018 & 2033
Figure 14: Global Volume (Tons) Analysis by Application, 2018 & 2033
Figure 15: Global Value Share (%) and BPS Analysis by Application, 2022 & 2032
Figure 16: Global Y-o-Y Growth (%) Projections by Application, 2023 to 2033
Figure 17: Global Value (US$ Million) Analysis by Distribution Channel, 2018 & 2033
Figure 18: Global Volume (Tons) Analysis by Distribution Channel, 2018 & 2033
Figure 19: Global Value Share (%) and BPS Analysis by Distribution Channel, 2022 & 2032
Figure 20: Global Y-o-Y Growth (%) Projections by Distribution Channel, 2023 to 2033
Figure 21: Global Attractiveness by Type, 2023 to 2033
Figure 22: Global Attractiveness by Application, 2023 to 2033
Figure 23: Global Attractiveness by Distribution Channel, 2023 to 2033
Figure 24: Global Attractiveness by Region, 2023 to 2033
Figure 25: North America Value (US$ Million) by Type, 2022 & 2032
Figure 26: North America Value (US$ Million) by Application, 2022 & 2032
Figure 27: North America Value (US$ Million) by Distribution Channel, 2022 & 2032
Figure 28: North America Value (US$ Million) by Country, 2022 & 2032
Figure 29: North America Value (US$ Million) Analysis by Country, 2018 & 2033
Figure 30: North America Volume (Tons) Analysis by Country, 2018 & 2033
Figure 31: North America Value Share (%) and BPS Analysis by Country, 2022 & 2032
Figure 32: North America Y-o-Y Growth (%) Projections by Country, 2023 to 2033
Figure 33: North America Value (US$ Million) Analysis by Type, 2018 & 2033
Figure 34: North America Volume (Tons) Analysis by Type, 2018 & 2033
Figure 35: North America Value Share (%) and BPS Analysis by Type, 2022 & 2032
Figure 36: North America Y-o-Y Growth (%) Projections by Type, 2023 to 2033
Figure 37: North America Value (US$ Million) Analysis by Application, 2018 & 2033
Figure 38: North America Volume (Tons) Analysis by Application, 2018 & 2033
Figure 39: North America Value Share (%) and BPS Analysis by Application, 2022 & 2032
Figure 40: North America Y-o-Y Growth (%) Projections by Application, 2023 to 2033
Figure 41: North America Value (US$ Million) Analysis by Distribution Channel, 2018 & 2033
Figure 42: North America Volume (Tons) Analysis by Distribution Channel, 2018 & 2033
Figure 43: North America Value Share (%) and BPS Analysis by Distribution Channel, 2022 & 2032
Figure 44: North America Y-o-Y Growth (%) Projections by Distribution Channel, 2023 to 2033
Figure 45: North America Attractiveness by Type, 2023 to 2033
Figure 46: North America Attractiveness by Application, 2023 to 2033
Figure 47: North America Attractiveness by Distribution Channel, 2023 to 2033
Figure 48: North America Attractiveness by Country, 2023 to 2033
Figure 49: Latin America Value (US$ Million) by Type, 2022 & 2032
Figure 50: Latin America Value (US$ Million) by Application, 2022 & 2032
Figure 51: Latin America Value (US$ Million) by Distribution Channel, 2022 & 2032
Figure 52: Latin America Value (US$ Million) by Country, 2022 & 2032
Figure 53: Latin America Value (US$ Million) Analysis by Country, 2018 & 2033
Figure 54: Latin America Volume (Tons) Analysis by Country, 2018 & 2033
Figure 55: Latin America Value Share (%) and BPS Analysis by Country, 2022 & 2032
Figure 56: Latin America Y-o-Y Growth (%) Projections by Country, 2023 to 2033
Figure 57: Latin America Value (US$ Million) Analysis by Type, 2018 & 2033
Figure 58: Latin America Volume (Tons) Analysis by Type, 2018 & 2033
Figure 59: Latin America Value Share (%) and BPS Analysis by Type, 2022 & 2032
Figure 60: Latin America Y-o-Y Growth (%) Projections by Type, 2023 to 2033
Figure 61: Latin America Value (US$ Million) Analysis by Application, 2018 & 2033
Figure 62: Latin America Volume (Tons) Analysis by Application, 2018 & 2033
Figure 63: Latin America Value Share (%) and BPS Analysis by Application, 2022 & 2032
Figure 64: Latin America Y-o-Y Growth (%) Projections by Application, 2023 to 2033
Figure 65: Latin America Value (US$ Million) Analysis by Distribution Channel, 2018 & 2033
Figure 66: Latin America Volume (Tons) Analysis by Distribution Channel, 2018 & 2033
Figure 67: Latin America Value Share (%) and BPS Analysis by Distribution Channel, 2022 & 2032
Figure 68: Latin America Y-o-Y Growth (%) Projections by Distribution Channel, 2023 to 2033
Figure 69: Latin America Attractiveness by Type, 2023 to 2033
Figure 70: Latin America Attractiveness by Application, 2023 to 2033
Figure 71: Latin America Attractiveness by Distribution Channel, 2023 to 2033
Figure 72: Latin America Attractiveness by Country, 2023 to 2033
Figure 73: Western Europe Value (US$ Million) by Type, 2022 & 2032
Figure 74: Western Europe Value (US$ Million) by Application, 2022 & 2032
Figure 75: Western Europe Value (US$ Million) by Distribution Channel, 2022 & 2032
Figure 76: Western Europe Value (US$ Million) by Country, 2022 & 2032
Figure 77: Western Europe Value (US$ Million) Analysis by Country, 2018 & 2033
Figure 78: Western Europe Volume (Tons) Analysis by Country, 2018 & 2033
Figure 79: Western Europe Value Share (%) and BPS Analysis by Country, 2022 & 2032
Figure 80: Western Europe Y-o-Y Growth (%) Projections by Country, 2023 to 2033
Figure 81: Western Europe Value (US$ Million) Analysis by Type, 2018 & 2033
Figure 82: Western Europe Volume (Tons) Analysis by Type, 2018 & 2033
Figure 83: Western Europe Value Share (%) and BPS Analysis by Type, 2022 & 2032
Figure 84: Western Europe Y-o-Y Growth (%) Projections by Type, 2023 to 2033
Figure 85: Western Europe Value (US$ Million) Analysis by Application, 2018 & 2033
Figure 86: Western Europe Volume (Tons) Analysis by Application, 2018 & 2033
Figure 87: Western Europe Value Share (%) and BPS Analysis by Application, 2022 & 2032
Figure 88: Western Europe Y-o-Y Growth (%) Projections by Application, 2023 to 2033
Figure 89: Western Europe Value (US$ Million) Analysis by Distribution Channel, 2018 & 2033
Figure 90: Western Europe Volume (Tons) Analysis by Distribution Channel, 2018 & 2033
Figure 91: Western Europe Value Share (%) and BPS Analysis by Distribution Channel, 2022 & 2032
Figure 92: Western Europe Y-o-Y Growth (%) Projections by Distribution Channel, 2023 to 2033
Figure 93: Western Europe Attractiveness by Type, 2023 to 2033
Figure 94: Western Europe Attractiveness by Application, 2023 to 2033
Figure 95: Western Europe Attractiveness by Distribution Channel, 2023 to 2033
Figure 96: Western Europe Attractiveness by Country, 2023 to 2033
Figure 97: Eastern Europe Value (US$ Million) by Type, 2022 & 2032
Figure 98: Eastern Europe Value (US$ Million) by Application, 2022 & 2032
Figure 99: Eastern Europe Value (US$ Million) by Distribution Channel, 2022 & 2032
Figure 100: Eastern Europe Value (US$ Million) by Country, 2022 & 2032
Figure 101: Eastern Europe Value (US$ Million) Analysis by Country, 2018 & 2033
Figure 102: Eastern Europe Volume (Tons) Analysis by Country, 2018 & 2033
Figure 103: Eastern Europe Value Share (%) and BPS Analysis by Country, 2022 & 2032
Figure 104: Eastern Europe Y-o-Y Growth (%) Projections by Country, 2023 to 2033
Figure 105: Eastern Europe Value (US$ Million) Analysis by Type, 2018 & 2033
Figure 106: Eastern Europe Volume (Tons) Analysis by Type, 2018 & 2033
Figure 107: Eastern Europe Value Share (%) and BPS Analysis by Type, 2022 & 2032
Figure 108: Eastern Europe Y-o-Y Growth (%) Projections by Type, 2023 to 2033
Figure 109: Eastern Europe Value (US$ Million) Analysis by Application, 2018 & 2033
Figure 110: Eastern Europe Volume (Tons) Analysis by Application, 2018 & 2033
Figure 111: Eastern Europe Value Share (%) and BPS Analysis by Application, 2022 & 2032
Figure 112: Eastern Europe Y-o-Y Growth (%) Projections by Application, 2023 to 2033
Figure 113: Eastern Europe Value (US$ Million) Analysis by Distribution Channel, 2018 & 2033
Figure 114: Eastern Europe Volume (Tons) Analysis by Distribution Channel, 2018 & 2033
Figure 115: Eastern Europe Value Share (%) and BPS Analysis by Distribution Channel, 2022 & 2032
Figure 116: Eastern Europe Y-o-Y Growth (%) Projections by Distribution Channel, 2023 to 2033
Figure 117: Eastern Europe Attractiveness by Type, 2023 to 2033
Figure 118: Eastern Europe Attractiveness by Application, 2023 to 2033
Figure 119: Eastern Europe Attractiveness by Distribution Channel, 2023 to 2033
Figure 120: Eastern Europe Attractiveness by Country, 2023 to 2033
Figure 121: East Asia Value (US$ Million) by Type, 2022 & 2032
Figure 122: East Asia Value (US$ Million) by Application, 2022 & 2032
Figure 123: East Asia Value (US$ Million) by Distribution Channel, 2022 & 2032
Figure 124: East Asia Value (US$ Million) by Country, 2022 & 2032
Figure 125: East Asia Value (US$ Million) Analysis by Country, 2018 & 2033
Figure 126: East Asia Volume (Tons) Analysis by Country, 2018 & 2033
Figure 127: East Asia Value Share (%) and BPS Analysis by Country, 2022 & 2032
Figure 128: East Asia Y-o-Y Growth (%) Projections by Country, 2023 to 2033
Figure 129: East Asia Value (US$ Million) Analysis by Type, 2018 & 2033
Figure 130: East Asia Volume (Tons) Analysis by Type, 2018 & 2033
Figure 131: East Asia Value Share (%) and BPS Analysis by Type, 2022 & 2032
Figure 132: East Asia Y-o-Y Growth (%) Projections by Type, 2023 to 2033
Figure 133: East Asia Value (US$ Million) Analysis by Application, 2018 & 2033
Figure 134: East Asia Volume (Tons) Analysis by Application, 2018 & 2033
Figure 135: East Asia Value Share (%) and BPS Analysis by Application, 2022 & 2032
Figure 136: East Asia Y-o-Y Growth (%) Projections by Application, 2023 to 2033
Figure 137: East Asia Value (US$ Million) Analysis by Distribution Channel, 2018 & 2033
Figure 138: East Asia Volume (Tons) Analysis by Distribution Channel, 2018 & 2033
Figure 139: East Asia Value Share (%) and BPS Analysis by Distribution Channel, 2022 & 2032
Figure 140: East Asia Y-o-Y Growth (%) Projections by Distribution Channel, 2023 to 2033
Figure 141: East Asia Attractiveness by Type, 2023 to 2033
Figure 142: East Asia Attractiveness by Application, 2023 to 2033
Figure 143: East Asia Attractiveness by Distribution Channel, 2023 to 2033
Figure 144: East Asia Attractiveness by Country, 2023 to 2033
Figure 145: South Asia Value (US$ Million) by Type, 2022 & 2032
Figure 146: South Asia Value (US$ Million) by Application, 2022 & 2032
Figure 147: South Asia Value (US$ Million) by Distribution Channel, 2022 & 2032
Figure 148: South Asia Value (US$ Million) by Country, 2022 & 2032
Figure 149: South Asia Value (US$ Million) Analysis by Country, 2018 & 2033
Figure 150: South Asia Volume (Tons) Analysis by Country, 2018 & 2033
Figure 151: South Asia Value Share (%) and BPS Analysis by Country, 2022 & 2032
Figure 152: South Asia Y-o-Y Growth (%) Projections by Country, 2023 to 2033
Figure 153: South Asia Value (US$ Million) Analysis by Type, 2018 & 2033
Figure 154: South Asia Volume (Tons) Analysis by Type, 2018 & 2033
Figure 155: South Asia Value Share (%) and BPS Analysis by Type, 2022 & 2032
Figure 156: South Asia Y-o-Y Growth (%) Projections by Type, 2023 to 2033
Figure 157: South Asia Value (US$ Million) Analysis by Application, 2018 & 2033
Figure 158: South Asia Volume (Tons) Analysis by Application, 2018 & 2033
Figure 159: South Asia Value Share (%) and BPS Analysis by Application, 2022 & 2032
Figure 160: South Asia Y-o-Y Growth (%) Projections by Application, 2023 to 2033
Figure 161: South Asia Value (US$ Million) Analysis by Distribution Channel, 2018 & 2033
Figure 162: South Asia Volume (Tons) Analysis by Distribution Channel, 2018 & 2033
Figure 163: South Asia Value Share (%) and BPS Analysis by Distribution Channel, 2022 & 2032
Figure 164: South Asia Y-o-Y Growth (%) Projections by Distribution Channel, 2023 to 2033
Figure 165: South Asia Attractiveness by Type, 2023 to 2033
Figure 166: South Asia Attractiveness by Application, 2023 to 2033
Figure 167: South Asia Attractiveness by Distribution Channel, 2023 to 2033
Figure 168: South Asia Attractiveness by Country, 2023 to 2033
Figure 169: MEA Value (US$ Million) by Type, 2022 & 2032
Figure 170: MEA Value (US$ Million) by Application, 2022 & 2032
Figure 171: MEA Value (US$ Million) by Distribution Channel, 2022 & 2032
Figure 172: MEA Value (US$ Million) by Country, 2022 & 2032
Figure 173: MEA Value (US$ Million) Analysis by Country, 2018 & 2033
Figure 174: MEA Volume (Tons) Analysis by Country, 2018 & 2033
Figure 175: MEA Value Share (%) and BPS Analysis by Country, 2022 & 2032
Figure 176: MEA Y-o-Y Growth (%) Projections by Country, 2023 to 2033
Figure 177: MEA Value (US$ Million) Analysis by Type, 2018 & 2033
Figure 178: MEA Volume (Tons) Analysis by Type, 2018 & 2033
Figure 179: MEA Value Share (%) and BPS Analysis by Type, 2022 & 2032
Figure 180: MEA Y-o-Y Growth (%) Projections by Type, 2023 to 2033
Figure 181: MEA Value (US$ Million) Analysis by Application, 2018 & 2033
Figure 182: MEA Volume (Tons) Analysis by Application, 2018 & 2033
Figure 183: MEA Value Share (%) and BPS Analysis by Application, 2022 & 2032
Figure 184: MEA Y-o-Y Growth (%) Projections by Application, 2023 to 2033
Figure 185: MEA Value (US$ Million) Analysis by Distribution Channel, 2018 & 2033
Figure 186: MEA Volume (Tons) Analysis by Distribution Channel, 2018 & 2033
Figure 187: MEA Value Share (%) and BPS Analysis by Distribution Channel, 2022 & 2032
Figure 188: MEA Y-o-Y Growth (%) Projections by Distribution Channel, 2023 to 2033
Figure 189: MEA Attractiveness by Type, 2023 to 2033
Figure 190: MEA Attractiveness by Application, 2023 to 2033
Figure 191: MEA Attractiveness by Distribution Channel, 2023 to 2033
Figure 192: MEA Attractiveness by Country, 2023 to 2033
Cutting machines are widely used in industries such as signage, apparel, automotive, and packaging. They enable precise cutting of materials like vinyl, paper, fabric, and plastic films. Businesses utilize these systems to create decals, labels, prototypes, and intricate designs in large-scale production settings.
Unlike manual or die-cutting tools, modern cutting systems offer automated precision with computer-controlled movements. They can handle complex designs with high accuracy, reduce material waste, and enhance production efficiency. Additionally, these machines support multiple materials, making them more versatile than traditional methods.
Key factors include cutting speed, accuracy, supported material types, software compatibility, and ease of operation. Businesses should also assess durability, maintenance requirements, and integration with existing workflows to ensure optimal performance and long-term usability.
Technological advancements such as improved software integration, AI-powered cutting algorithms, and wireless connectivity are enhancing operational efficiency. Features like automatic material detection, cloud-based design storage, and faster cutting speeds contribute to increased productivity and reduced labor dependency.
Automation streamlines cutting processes by minimizing manual intervention, reducing errors, and optimizing material utilization. Features such as automatic alignment, real-time monitoring, and batch processing improve efficiency, enabling businesses to meet high-volume production demands with consistent quality.
Explore Similar Insights
Thank you!
You will receive an email from our Business Development Manager. Please be sure to check your SPAM/JUNK folder too.