Reports

- Global Locations -

Headquarters

Future Market Insights, Inc.

Christiana Corporate, 200
Continental Drive, Suite 401,
Newark, Delaware - 19713,
United States

T: +1-845-579-5705

Americas

Future Market Insights, Inc.

616 Corporate Way, Suite 2-9018,
Valley Cottage, NY 10989, United States

T: +1-347-918-3531

MEA

Future Market Insights

1602-6 Jumeirah Bay X2 Tower, Plot No: JLT-PH2-X2A,
Jumeirah Lakes Towers, Dubai,
United Arab Emirates

Europe

Future Market Insights

3rd Floor, 207 Regent Street,
W1B 3HH London
United Kingdom

T: + 44 (0) 20 8123 9659
D: +44 (0) 20 3287 4268

Asia Pacific

Future Market Insights

IndiaLand Global Tech Park, Unit UG-1, Behind Grand HighStreet, Phase 1, Hinjawadi, MH, Pune – 411057, India

Plucker Machine Market Outlook (2023 to 2033)

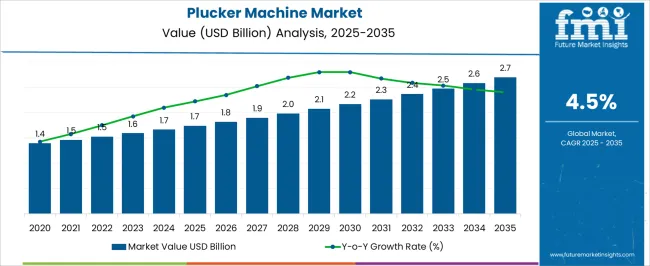
The plucker machine market has a worth of US$ 1,593 million in 2023 and is projected to reach US$ 2,474 million by 2033, with a CAGR of 4.5% during the forecast period.

The market for plucker machines is a modest but developing niche. It is largely employed in agriculture, including small-scale chicken farming and the harvesting of fruits and vegetables.

Due to its capacity to save labor costs and boost efficiency, the plucker machine is gaining popularity as an alternative to conventional harvesting methods. Pluckers are employed in animal leather and fur production, in addition to agricultural applications.

As a result, more manufacturers are joining the market with a wide range of models and features as the need for pluckers rises.

Attributes Details
Plucker Machine Market CAGR (2023 to 2033) 4.5%
Plucker Machine Market Size (2023) US$ 1,593 million
Plucker Machine Market Size (2033) US$ 2,474 million

Don't pay for what you don't need

Customize your report by selecting specific countries or regions and save 30%!

Fast Food Chains Extended Operations Raises the Demand for Plucker Machine

Plucker machines are being used by fast food restaurants quickly to meet client demand effectively and quickly. Popular fast food restaurants like KFC, Domino's, McDonald's Corporation, and Taco Bell are expanding into new countries. Over the projection period, this is likely to increase the adoption of plucker machine.

The top manufacturers of plucker machines concentrate on developing state-of-the-art processing equipment. Due to this newly created machinery, several products made of bird meat now have extended shelf lives.

Additionally, plucker machine industry advancements help items retain the majority of their nutrients while reducing quality loss and avoiding disease contamination. Therefore, it is anticipated that the industry's innovative concepts are likely to boost the demand for plucker machine.

Analysis of Plucker Machine Market Transformation: 2016 to 2022 v/s 2023 to 2033

When compared to the 4% CAGR recorded between 2016 and 2022, the sheep-handling equipment business is predicted to expand at a 4.5% CAGR between 2023 and 2033. The average growth of the market is expected to be approx 62.2% between 2022 and 2033.

Year Market Value
2016 US$ 1,203 million
2021 US$ 1,465.7 million
2022 US$ 1,524.7 million

Short-term Growth (2023 to 2026): in many countries, where many individuals are assumed to have shifted to a plant-based diet, the vegan trend is obvious. This created numerous opportunities for the plucker machine manufacturers.

Medium-term Growth (2027 to 2029): the numerous health benefits of goods made from meat are a contributing factor in the rising demand for plucker machines.

Long-term Growth (2030 to 2033): a number of extra nutrients are present in chicken meat products that support reproductive and cognitive function. Longer term, this is likely to be advantageous for the market.

As red meat consumption drops due to health concerns, there is likely to be an increase in demand for chicken products with high levels of protein. For processed poultry products, high-quality equipment is required, which is projected to drive the sales of plucker machines.

These reasons would likely lead to a 1.55X increase in the plucker machine sector between 2023 and 2033. FMI analysts predict that the market would be worth US$ 2,474 million by 2033's end.

Nikhil Kaitwade
Nikhil Kaitwade

Principal Consultant

Talk to Analyst

Find your sweet spots for generating winning opportunities in this market.

Automated Plucking Machine Influencing the Market Share

  • The market for plucker machine is anticipated to rise as processed poultry products become more popular. The demand for plucking machines is anticipated to rise due to the rising demand for convenience foods and the rising consumption of processed poultry.
  • The development of automated plucker machines and the growing emphasis on food safety and cleanliness are the key growth factors of the plucker machine.
  • While automated plucker machines are more compassionate and effective than hand plucking machines, the growing concern for animal welfare is predicted to increase demand.
  • The sales of plucker machine are anticipated to be constrained by the high cost. The market growth is expected to be constrained by a lack of technological know-how and skilled workforce.

Comparative View of Plucker Machine Market

Plucker Machine Market:

Attributes Plucker Machine Market
CAGR (2023 to 2033) 4.5%
Market Value (2033) US$ 2,474 million
Growth Factor Processed meat products
Opportunity Automated slaughtering technology
Key Trends Change in eating habits

Chicken Plucker Machine Market:

Attributes Chicken Plucker Machine Market
CAGR (2023 to 2033) 3.4%
Market Value (2033) US$ 757 million
Growth Factor Increased demand for convenient products
Opportunity Increased food chains globally
Key Trends

Plant-based diet shift

Poultry Plucker Machine Market:

Attributes Poultry Plucker Machine Market
CAGR (2023 to 2033) 6.2%
Market Value (2033) US$ 1,164.6 million
Growth Factor Growing demand for poultry products
Opportunity Rising disposable income
Key Trends Advanced automatic machines

Get the data you need at a Fraction of the cost

Personalize your report by choosing insights you need
and save 40%!

Category Analysis

How Less than 5 Capacity Categories Benefit the Restaurants?

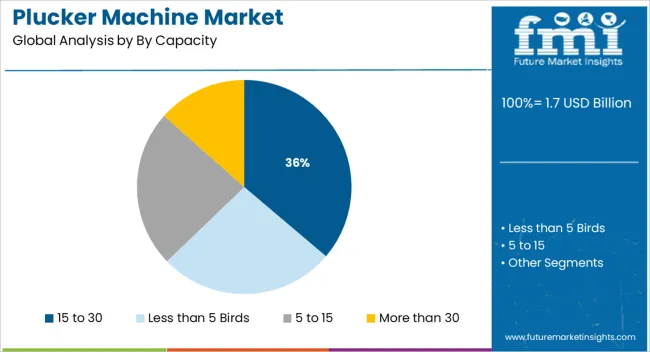
Aside from quality, the size of the plucking is likely to be valued most highly by poultry farms and other end customers. Restaurant and residential sectors are also seeing an increase in demand for less than 5 capacity.

Mobility and flexibility are adding more value to the plucking machine adoption trends. As it requires less space to adjust, less than 5 capacity machines are expected to lead the market during the forecast period.

Why Does the Stainless Steel Sector Direct the Market?

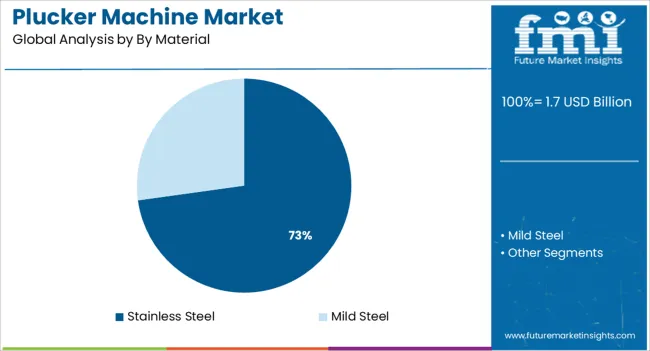
Due to its ease of cleaning, stainless steel continues to be in high demand by 2033. In addition, consumers' concern about contracting the avian flu highlights the need for hygiene, which makes stainless steel's ability to be disinfected a good choice.

Due to its top-notch components and durable construction, the stainless steel plucker machine has a long lifespan. Additionally, stainless steel pluckers are more durable than those made of mild steel, which makes them a dominant segment in the industry.
Region Analysis

US Act as a Support Wall for the Plucker Machine Market

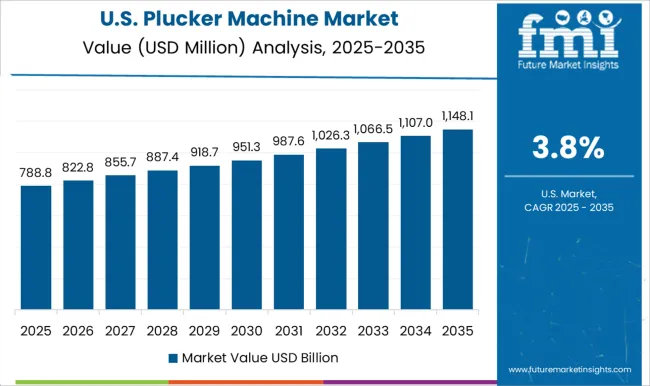
With a share of 30.3%, the plucker machine business in the United States is worth US$ 462 million in 2022.

Demand for plucker machines has increased as more poultry processing factories embrace this technology, contributing to the market's steady rise in the US. As the need for convenience and efficiency in the poultry processing sector continues to develop, the market share is expected to grow further.

According to the US Department of Agriculture (USDA), there are 4,500 plucking machines in use in the country's poultry processing business by 2020, up from roughly 1,500 in 2000.

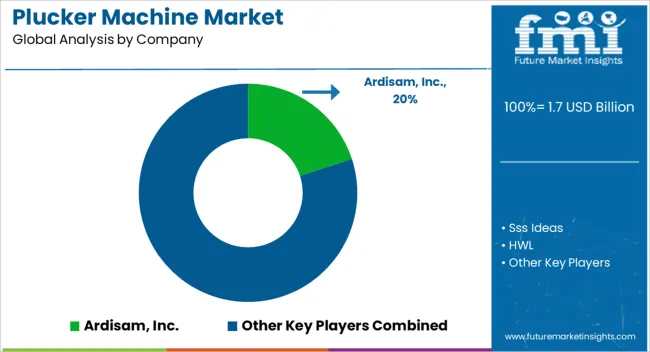
Key producers of the plucking machines, including Chore-Time, Viscon, and Stork, produce the vast majority of plucking machines in the United States. With around 60% of the market share, Chore-Time dominates as the top producer.

These businesses sell a range of machinery, from large-scale models to small-scale pluckers. Additionally, a number of businesses in the US provide aftermarket options for plucking machines, including replacement components, upkeep and repair services, and system upgrades.

Concern for Immunity Generating Greater Returns for UK Market

Attributes Statistics
UK Market Value 2022 US$ 138.5 million
UK Market Value 2033 US$ 221.9 million
UK Market Share (2023 to 2033) 9.1%
UK Market CAGR (2023 to 2033) 4.8%

Germany was leading the Europe market with US$ 281.3 million. The UK followed Germany in terms of producing meat and poultry, where a lot of equipment is required and a lot of profit is made.

Rising fast food and restaurant chain sales, as well as increased processed meat consumption, are driving demand for better-processed meat. Additionally, increased per capita income and consumer trends toward value-added food are essential factors in driving plucker machine sales.

Consumers in the country are starting to recognize the advantages of meat products, such as their high protein content and immunity-boosting qualities. The market's present share has also increased as a result of technological advancements in the equipment business, particularly in the poultry sector.

Technological developments in the food processing industry are correlated to the profit margins of the plucker machine companies. This includes the integration of all process equipment into a single piece to minimize labor needs and increase hygiene.

Growing food processing automation is projected to present the biggest opportunity for the UK plucker machine industry.

Imports & Exports Controls the Asia Pacific Market Share

Country China
Market Share (2022) 8.4%
CAGR (2023 to 2033) 3.6%
Market Value (2033) US$ 181.8 million
Country India
Market Share (2022) 3.4%
CAGR (2023 to 2033) 5.3%
Market Value (2033) US$ 85.9 million

Indian Market Outlook

It is also projected that government actions to support the poultry farming sector provide lucrative opportunities to the plucker machine manufacturers.

For instance, the Indian government declared a 100% increase in the import tax on frozen chicken and turkey beginning in 2020. The country's poultry farming business is probably going to gain from the legislation.

The market was growing at a value of US$ 51.3 million in 2022. Another element influencing the market expansion is technical development in plucker machines, which increases their productivity and lowers operational costs.

China Market Outlook

Over the forecast period, China is expected to experience Asia Pacific's most encouraging growth rate, with a value of US$ 127.57 million. In order to meet the high consumer demand in the nation, the main manufacturer focuses on creating processed meat and poultry items.

Automation, intelligence, and digitization are the three most evident advancements in the Chinese food industry today, particularly in the field of poultry plucking. As fewer young people are prepared to work in slaughterhouses, the labor pool is likewise shrinking. As a result, the plucker machine is becoming much more widely used.

Startups are Striking Out on their Own to Survive the Competitive Dominance

The need for tools used in plucking procedures is expected to rise as customers' propensity to consume meat and related products increases globally. Recent entrants in the plucker machine companies think that enhancing their competitive edge is essential to maintaining technical leadership.

They heavily engage in Research and Development, in addition to focusing on new launches in order to gain a foothold in the global poultry plucker market.

Startup moving forward: Kiinns (Israel)

In food production lines, Kiinns suggests a technique for keeping food apart from the machinery that prepares it. The startup's totally biodegradable separation technique enhances the cleanliness and food safety of the processing facilities. Every processing cycle uses clean equipment, removing any germs, allergies, or cleaning agents that might have been left behind.
Productivity Boost Motivates the Key Market Players of Plucker Machine to Invest Heavily

A developing market in the food service industry is the plucker machine sector. The adoption of plucker machines helps businesses boost output, cut expenses, and enhance product quality.

Many companies are now integrating plucker machines in their product lines due to the advantages they have over traditional methods of processing chicken. Plucker machines can swiftly and effectively process vast numbers of chickens, speeding up production and lowering costs.

Sales of plucker machines are expected to remain high, as more businesses profit from what this equipment has to offer. To increase the effectiveness and performance of their machines, key players in the plucker machine market are spending money on research and development. This makes the machines more affordable to a wider range of clients and encourages innovation in the industry.

As restaurants become knowledgeable about the advantages of these devices to prepare their chicken, the popularity of plucker machines is also rising in this industry.

Additionally, Plucker machines are more adaptable than conventional techniques because they can process a variety of foods, such as fruits and vegetables. The market share of plucker machines is expected to grow as more firms try to take advantage of what the machines have to offer.

Businesses invest money in R&D to raise the caliber of their products and the productivity of their machinery. As the market growth of plucker machines is expected to be high, food service businesses have more scope for innovations.

Recent Developments

  • New loan facilities of $63,200,000 were closed by Ardisam, Inc. and Huntington Business Credit in June 2022. The funds from the facility were used to refinance existing debt and continue financing working capital expansion.
  • The purchase of superior equipment group, Inc. by John Bean Technologies Corporation, was disclosed in June 2019. The acquisition of premier brings us one step closer to realizing our goal of dominating the chicken market and providing premium products and services.

Key players

  • Sss Ideas
  • Ardisam, Inc.
  • HWL
  • AI Abbas International
  • Global Kitchen Equipments Company
  • Universal machines
  • SriVeni Industries
  • Zhucheng Xinhaoyun Machinery Co. Ltd.
  • RUIANSHISUIKANGXIEYESHANGHANG
  • Cuilvu
  • Each bid
  • Buffalo Tools

Key Segments

By Capacity:

  • Less than 5 Birds
  • 5 to 15
  • 15 to 30
  • More than 30

By Material:

  • Stainless Steel
  • Mild Steel

By Motor Power:

  • 0.5 Hp
  • 1 Hp
  • 2 Hp
  • More than 2 Hp

By Region:

  • North America
  • Latin America
  • Europe
  • East Asia
  • South Asia Pacific
  • Middle East & Africa (MEA)

Frequently Asked Questions

How Much is the Plucker Machine Market Worth?

The plucker machine market is estimated to be worth US$ 1,593 million in 2023.

What is the Demand Outlook for the Plucker Machine Market?

The plucker machine market is expected to have a CAGR of 4.5% by 2033.

What is the Historical Plucker Machine Market Share?

The plucker machine market expanded to a share of US$ 1,524.7 million in 2022.

What is the North America Plucker Machine Market Outlook?

North America accounted for a 30.3% share of the plucker machine market in 2022.

Which is the UK Plucker Machine Market Outlook?

The UK accounts for 4.8% CAGR in the plucker machine market by 2033.

Table of Content

1. Executive Summary | Plucker Machine Market

    1.1. Global Market Outlook

    1.2. Demand-side Trends

    1.3. Supply-side Trends

    1.4. Technology Roadmap Analysis

    1.5. Analysis and Recommendations

2. Market Overview

    2.1. Market Coverage / Taxonomy

    2.2. Market Definition / Scope / Limitations

3. Market Background

    3.1. Market Dynamics

        3.1.1. Drivers

        3.1.2. Restraints

        3.1.3. Opportunity

        3.1.4. Trends

    3.2. Scenario Forecast

        3.2.1. Demand in Optimistic Scenario

        3.2.2. Demand in Likely Scenario

        3.2.3. Demand in Conservative Scenario

    3.3. Opportunity Map Analysis

    3.4. Product Life Cycle Analysis

    3.5. Supply Chain Analysis

        3.5.1. Supply Side Participants and their Roles

            3.5.1.1. Producers

            3.5.1.2. Mid-Level Participants (Traders / Agents / Brokers)

            3.5.1.3. Wholesalers and Distributors

        3.5.2. Value Added and Value Created at Node in the Supply Chain

        3.5.3. List of Raw Material Suppliers

        3.5.4. List of Existing and Potential Buyers

    3.6. Investment Feasibility Matrix

    3.7. Value Chain Analysis

        3.7.1. Profit Margin Analysis

        3.7.2. Wholesalers and Distributors

        3.7.3. Retailers

    3.8. PESTLE and Porter’s Analysis

    3.9. Regulatory Landscape

        3.9.1. By Key Regions

        3.9.2. By Key Countries

    3.10. Regional Parent Market Outlook

    3.11. Production and Consumption Statistics

    3.12. Import and Export Statistics

4. Global Market Analysis 2018 to 2022 and Forecast, 2023 to 2033

    4.1. Historical Market Size Value (US$ Million) & Volume (Units) Analysis, 2018 to 2022

    4.2. Current and Future Market Size Value (US$ Million) & Volume (Units) Projections, 2023 to 2033

        4.2.1. Y-o-Y Growth Trend Analysis

        4.2.2. Absolute $ Opportunity Analysis

5. Global Market Analysis 2018 to 2022 and Forecast 2023 to 2033, By Capacity

    5.1. Introduction / Key Findings

    5.2. Historical Market Size Value (US$ Million) & Volume (Units) Analysis By Capacity, 2018 to 2022

    5.3. Current and Future Market Size Value (US$ Million) & Volume (Units) Analysis and Forecast By Capacity, 2023 to 2033

        5.3.1. Less Than 5 Birds

        5.3.2. 6 to 15 Birds

        5.3.3. 16 to 30 Birds

        5.3.4. More Than 30 Birds

    5.4. Y-o-Y Growth Trend Analysis By Capacity, 2018 to 2022

    5.5. Absolute $ Opportunity Analysis By Capacity, 2023 to 2033

6. Global Market Analysis 2018 to 2022 and Forecast 2023 to 2033, By Material

    6.1. Introduction / Key Findings

    6.2. Historical Market Size Value (US$ Million) & Volume (Units) Analysis By Material, 2018 to 2022

    6.3. Current and Future Market Size Value (US$ Million) & Volume (Units) Analysis and Forecast By Material, 2023 to 2033

        6.3.1. Stainless Steel

        6.3.2. Mild Steel

    6.4. Y-o-Y Growth Trend Analysis By Material, 2018 to 2022

    6.5. Absolute $ Opportunity Analysis By Material, 2023 to 2033

7. Global Market Analysis 2018 to 2022 and Forecast 2023 to 2033, By Motor Power

    7.1. Introduction / Key Findings

    7.2. Historical Market Size Value (US$ Million) & Volume (Units) Analysis By Motor Power, 2018 to 2022

    7.3. Current and Future Market Size Value (US$ Million) & Volume (Units) Analysis and Forecast By Motor Power, 2023 to 2033

        7.3.1. 0.5Hp

        7.3.2. 1Hp

        7.3.3. 2Hp

        7.3.4. More than 2Hp

    7.4. Y-o-Y Growth Trend Analysis By Motor Power, 2018 to 2022

    7.5. Absolute $ Opportunity Analysis By Motor Power, 2023 to 2033

8. Global Market Analysis 2018 to 2022 and Forecast 2023 to 2033, By Region

    8.1. Introduction

    8.2. Historical Market Size Value (US$ Million) & Volume (Units) Analysis By Region, 2018 to 2022

    8.3. Current Market Size Value (US$ Million) & Volume (Units) Analysis and Forecast By Region, 2023 to 2033

        8.3.1. North America

        8.3.2. Latin America

        8.3.3. Europe

        8.3.4. Asia Pacific

        8.3.5. Middle East & Africa (MEA)

    8.4. Market Attractiveness Analysis By Region

9. North America Market Analysis 2018 to 2022 and Forecast 2023 to 2033, By Country

    9.1. Historical Market Size Value (US$ Million) & Volume (Units) Trend Analysis By Market Taxonomy, 2018 to 2022

    9.2. Market Size Value (US$ Million) & Volume (Units) Forecast By Market Taxonomy, 2023 to 2033

        9.2.1. By Country

            9.2.1.1. The US

            9.2.1.2. Canada

        9.2.2. By Capacity

        9.2.3. By Material

        9.2.4. By Motor Power

    9.3. Market Attractiveness Analysis

        9.3.1. By Country

        9.3.2. By Capacity

        9.3.3. By Material

        9.3.4. By Motor Power

    9.4. Key Takeaways

10. Latin America Market Analysis 2018 to 2022 and Forecast 2023 to 2033, By Country

    10.1. Historical Market Size Value (US$ Million) & Volume (Units) Trend Analysis By Market Taxonomy, 2018 to 2022

    10.2. Market Size Value (US$ Million) & Volume (Units) Forecast By Market Taxonomy, 2023 to 2033

        10.2.1. By Country

            10.2.1.1. Brazil

            10.2.1.2. Mexico

            10.2.1.3. Rest of Latin America

        10.2.2. By Capacity

        10.2.3. By Material

        10.2.4. By Motor Power

    10.3. Market Attractiveness Analysis

        10.3.1. By Country

        10.3.2. By Capacity

        10.3.3. By Material

        10.3.4. By Motor Power

    10.4. Key Takeaways

11. Europe Market Analysis 2018 to 2022 and Forecast 2023 to 2033, By Country

    11.1. Historical Market Size Value (US$ Million) & Volume (Units) Trend Analysis By Market Taxonomy, 2018 to 2022

    11.2. Market Size Value (US$ Million) & Volume (Units) Forecast By Market Taxonomy, 2023 to 2033

        11.2.1. By Country

            11.2.1.1. Germany

            11.2.1.2. The UK

            11.2.1.3. France

            11.2.1.4. Spain

            11.2.1.5. Italy

            11.2.1.6. Rest of Europe

        11.2.2. By Capacity

        11.2.3. By Material

        11.2.4. By Motor Power

    11.3. Market Attractiveness Analysis

        11.3.1. By Country

        11.3.2. By Capacity

        11.3.3. By Material

        11.3.4. By Motor Power

    11.4. Key Takeaways

12. Asia Pacific Market Analysis 2018 to 2022 and Forecast 2023 to 2033, By Country

    12.1. Historical Market Size Value (US$ Million) & Volume (Units) Trend Analysis By Market Taxonomy, 2018 to 2022

    12.2. Market Size Value (US$ Million) & Volume (Units) Forecast By Market Taxonomy, 2023 to 2033

        12.2.1. By Country

            12.2.1.1. China

            12.2.1.2. Japan

            12.2.1.3. South Korea

            12.2.1.4. Singapore

            12.2.1.5. Thailand

            12.2.1.6. Indonesia

            12.2.1.7. Australia

            12.2.1.8. New Zealand

            12.2.1.9. Rest of Asia Pacific

        12.2.2. By Capacity

        12.2.3. By Material

        12.2.4. By Motor Power

    12.3. Market Attractiveness Analysis

        12.3.1. By Country

        12.3.2. By Capacity

        12.3.3. By Material

        12.3.4. By Motor Power

    12.4. Key Takeaways

13. MEA Market Analysis 2018 to 2022 and Forecast 2023 to 2033, By Country

    13.1. Historical Market Size Value (US$ Million) & Volume (Units) Trend Analysis By Market Taxonomy, 2018 to 2022

    13.2. Market Size Value (US$ Million) & Volume (Units) Forecast By Market Taxonomy, 2023 to 2033

        13.2.1. By Country

            13.2.1.1. GCC Countries

            13.2.1.2. South Africa

            13.2.1.3. Israel

            13.2.1.4. Rest of MEA

        13.2.2. By Capacity

        13.2.3. By Material

        13.2.4. By Motor Power

    13.3. Market Attractiveness Analysis

        13.3.1. By Country

        13.3.2. By Capacity

        13.3.3. By Material

        13.3.4. By Motor Power

    13.4. Key Takeaways

14. Key Countries Market Analysis

    14.1. The US

        14.1.1. Pricing Analysis

        14.1.2. Market Share Analysis, 2022

            14.1.2.1. By Capacity

            14.1.2.2. By Material

            14.1.2.3. By Motor Power

    14.2. Canada

        14.2.1. Pricing Analysis

        14.2.2. Market Share Analysis, 2022

            14.2.2.1. By Capacity

            14.2.2.2. By Material

            14.2.2.3. By Motor Power

    14.3. Brazil

        14.3.1. Pricing Analysis

        14.3.2. Market Share Analysis, 2022

            14.3.2.1. By Capacity

            14.3.2.2. By Material

            14.3.2.3. By Motor Power

    14.4. Mexico

        14.4.1. Pricing Analysis

        14.4.2. Market Share Analysis, 2022

            14.4.2.1. By Capacity

            14.4.2.2. By Material

            14.4.2.3. By Motor Power

    14.5. Germany

        14.5.1. Pricing Analysis

        14.5.2. Market Share Analysis, 2022

            14.5.2.1. By Capacity

            14.5.2.2. By Material

            14.5.2.3. By Motor Power

    14.6. The UK

        14.6.1. Pricing Analysis

        14.6.2. Market Share Analysis, 2022

            14.6.2.1. By Capacity

            14.6.2.2. By Material

            14.6.2.3. By Motor Power

    14.7. France

        14.7.1. Pricing Analysis

        14.7.2. Market Share Analysis, 2022

            14.7.2.1. By Capacity

            14.7.2.2. By Material

            14.7.2.3. By Motor Power

    14.8. Spain

        14.8.1. Pricing Analysis

        14.8.2. Market Share Analysis, 2022

            14.8.2.1. By Capacity

            14.8.2.2. By Material

            14.8.2.3. By Motor Power

    14.9. Italy

        14.9.1. Pricing Analysis

        14.9.2. Market Share Analysis, 2022

            14.9.2.1. By Capacity

            14.9.2.2. By Material

            14.9.2.3. By Motor Power

    14.10. China

        14.10.1. Pricing Analysis

        14.10.2. Market Share Analysis, 2022

            14.10.2.1. By Capacity

            14.10.2.2. By Material

            14.10.2.3. By Motor Power

    14.11. Japan

        14.11.1. Pricing Analysis

        14.11.2. Market Share Analysis, 2022

            14.11.2.1. By Capacity

            14.11.2.2. By Material

            14.11.2.3. By Motor Power

    14.12. South Korea

        14.12.1. Pricing Analysis

        14.12.2. Market Share Analysis, 2022

            14.12.2.1. By Capacity

            14.12.2.2. By Material

            14.12.2.3. By Motor Power

    14.13. Singapore

        14.13.1. Pricing Analysis

        14.13.2. Market Share Analysis, 2022

            14.13.2.1. By Capacity

            14.13.2.2. By Material

            14.13.2.3. By Motor Power

    14.14. Thailand

        14.14.1. Pricing Analysis

        14.14.2. Market Share Analysis, 2022

            14.14.2.1. By Capacity

            14.14.2.2. By Material

            14.14.2.3. By Motor Power

    14.15. Indonesia

        14.15.1. Pricing Analysis

        14.15.2. Market Share Analysis, 2022

            14.15.2.1. By Capacity

            14.15.2.2. By Material

            14.15.2.3. By Motor Power

    14.16. Australia

        14.16.1. Pricing Analysis

        14.16.2. Market Share Analysis, 2022

            14.16.2.1. By Capacity

            14.16.2.2. By Material

            14.16.2.3. By Motor Power

    14.17. New Zealand

        14.17.1. Pricing Analysis

        14.17.2. Market Share Analysis, 2022

            14.17.2.1. By Capacity

            14.17.2.2. By Material

            14.17.2.3. By Motor Power

    14.18. GCC Countries

        14.18.1. Pricing Analysis

        14.18.2. Market Share Analysis, 2022

            14.18.2.1. By Capacity

            14.18.2.2. By Material

            14.18.2.3. By Motor Power

    14.19. South Africa

        14.19.1. Pricing Analysis

        14.19.2. Market Share Analysis, 2022

            14.19.2.1. By Capacity

            14.19.2.2. By Material

            14.19.2.3. By Motor Power

    14.20. Israel

        14.20.1. Pricing Analysis

        14.20.2. Market Share Analysis, 2022

            14.20.2.1. By Capacity

            14.20.2.2. By Material

            14.20.2.3. By Motor Power

15. Market Structure Analysis

    15.1. Competition Dashboard

    15.2. Competition Benchmarking

    15.3. Market Share Analysis of Top Players

        15.3.1. By Regional

        15.3.2. By Capacity

        15.3.3. By Material

        15.3.4. By Motor Power

16. Competition Analysis

    16.1. Competition Deep Dive

        16.1.1. Global Kitchen Equipment Company

            16.1.1.1. Overview

            16.1.1.2. Product Portfolio

            16.1.1.3. Profitability by Market Segments

            16.1.1.4. Sales Footprint

            16.1.1.5. Strategy Overview

                16.1.1.5.1. Marketing Strategy

                16.1.1.5.2. Product Strategy

                16.1.1.5.3. Channel Strategy

        16.1.2. Zhucheng Xinhaoyun Machinery Co. Ltd

            16.1.2.1. Overview

            16.1.2.2. Product Portfolio

            16.1.2.3. Profitability by Market Segments

            16.1.2.4. Sales Footprint

            16.1.2.5. Strategy Overview

                16.1.2.5.1. Marketing Strategy

                16.1.2.5.2. Product Strategy

                16.1.2.5.3. Channel Strategy

        16.1.3. Buffalo Tools

            16.1.3.1. Overview

            16.1.3.2. Product Portfolio

            16.1.3.3. Profitability by Market Segments

            16.1.3.4. Sales Footprint

            16.1.3.5. Strategy Overview

                16.1.3.5.1. Marketing Strategy

                16.1.3.5.2. Product Strategy

                16.1.3.5.3. Channel Strategy

        16.1.4. LEM Products

            16.1.4.1. Overview

            16.1.4.2. Product Portfolio

            16.1.4.3. Profitability by Market Segments

            16.1.4.4. Sales Footprint

            16.1.4.5. Strategy Overview

                16.1.4.5.1. Marketing Strategy

                16.1.4.5.2. Product Strategy

                16.1.4.5.3. Channel Strategy

        16.1.5. Qingdao zhongbang Haotong Machinery co., Ltd

            16.1.5.1. Overview

            16.1.5.2. Product Portfolio

            16.1.5.3. Profitability by Market Segments

            16.1.5.4. Sales Footprint

            16.1.5.5. Strategy Overview

                16.1.5.5.1. Marketing Strategy

                16.1.5.5.2. Product Strategy

                16.1.5.5.3. Channel Strategy

        16.1.6. Hangzhou zhengfeng machinery co., Ltd

            16.1.6.1. Overview

            16.1.6.2. Product Portfolio

            16.1.6.3. Profitability by Market Segments

            16.1.6.4. Sales Footprint

            16.1.6.5. Strategy Overview

                16.1.6.5.1. Marketing Strategy

                16.1.6.5.2. Product Strategy

                16.1.6.5.3. Channel Strategy

        16.1.7. Zhucheng Qinghong Machinery Co., Ltd

            16.1.7.1. Overview

            16.1.7.2. Product Portfolio

            16.1.7.3. Profitability by Market Segments

            16.1.7.4. Sales Footprint

            16.1.7.5. Strategy Overview

                16.1.7.5.1. Marketing Strategy

                16.1.7.5.2. Product Strategy

                16.1.7.5.3. Channel Strategy

        16.1.8. Burdis

            16.1.8.1. Overview

            16.1.8.2. Product Portfolio

            16.1.8.3. Profitability by Market Segments

            16.1.8.4. Sales Footprint

            16.1.8.5. Strategy Overview

                16.1.8.5.1. Marketing Strategy

                16.1.8.5.2. Product Strategy

                16.1.8.5.3. Channel Strategy

        16.1.9. Meyn Food Processing Technology B.V.

            16.1.9.1. Overview

            16.1.9.2. Product Portfolio

            16.1.9.3. Profitability by Market Segments

            16.1.9.4. Sales Footprint

            16.1.9.5. Strategy Overview

                16.1.9.5.1. Marketing Strategy

                16.1.9.5.2. Product Strategy

                16.1.9.5.3. Channel Strategy

        16.1.10. Lucky Buck Mineral

            16.1.10.1. Overview

            16.1.10.2. Product Portfolio

            16.1.10.3. Profitability by Market Segments

            16.1.10.4. Sales Footprint

            16.1.10.5. Strategy Overview

                16.1.10.5.1. Marketing Strategy

                16.1.10.5.2. Product Strategy

                16.1.10.5.3. Channel Strategy

17. Assumptions & Acronyms Used

18. Research Methodology

List of Tables

Table 1: Global Market Value (US$ Million) Forecast by Region, 2018 to 2033

Table 2: Global Market Volume (Units) Forecast by Region, 2018 to 2033

Table 3: Global Market Value (US$ Million) Forecast by Capacity, 2018 to 2033

Table 4: Global Market Volume (Units) Forecast by Capacity, 2018 to 2033

Table 5: Global Market Value (US$ Million) Forecast by Material, 2018 to 2033

Table 6: Global Market Volume (Units) Forecast by Material, 2018 to 2033

Table 7: Global Market Value (US$ Million) Forecast by Motor Power, 2018 to 2033

Table 8: Global Market Volume (Units) Forecast by Motor Power, 2018 to 2033

Table 9: North America Market Value (US$ Million) Forecast by Country, 2018 to 2033

Table 10: North America Market Volume (Units) Forecast by Country, 2018 to 2033

Table 11: North America Market Value (US$ Million) Forecast by Capacity, 2018 to 2033

Table 12: North America Market Volume (Units) Forecast by Capacity, 2018 to 2033

Table 13: North America Market Value (US$ Million) Forecast by Material, 2018 to 2033

Table 14: North America Market Volume (Units) Forecast by Material, 2018 to 2033

Table 15: North America Market Value (US$ Million) Forecast by Motor Power, 2018 to 2033

Table 16: North America Market Volume (Units) Forecast by Motor Power, 2018 to 2033

Table 17: Latin America Market Value (US$ Million) Forecast by Country, 2018 to 2033

Table 18: Latin America Market Volume (Units) Forecast by Country, 2018 to 2033

Table 19: Latin America Market Value (US$ Million) Forecast by Capacity, 2018 to 2033

Table 20: Latin America Market Volume (Units) Forecast by Capacity, 2018 to 2033

Table 21: Latin America Market Value (US$ Million) Forecast by Material, 2018 to 2033

Table 22: Latin America Market Volume (Units) Forecast by Material, 2018 to 2033

Table 23: Latin America Market Value (US$ Million) Forecast by Motor Power, 2018 to 2033

Table 24: Latin America Market Volume (Units) Forecast by Motor Power, 2018 to 2033

Table 25: Europe Market Value (US$ Million) Forecast by Country, 2018 to 2033

Table 26: Europe Market Volume (Units) Forecast by Country, 2018 to 2033

Table 27: Europe Market Value (US$ Million) Forecast by Capacity, 2018 to 2033

Table 28: Europe Market Volume (Units) Forecast by Capacity, 2018 to 2033

Table 29: Europe Market Value (US$ Million) Forecast by Material, 2018 to 2033

Table 30: Europe Market Volume (Units) Forecast by Material, 2018 to 2033

Table 31: Europe Market Value (US$ Million) Forecast by Motor Power, 2018 to 2033

Table 32: Europe Market Volume (Units) Forecast by Motor Power, 2018 to 2033

Table 33: Asia Pacific Market Value (US$ Million) Forecast by Country, 2018 to 2033

Table 34: Asia Pacific Market Volume (Units) Forecast by Country, 2018 to 2033

Table 35: Asia Pacific Market Value (US$ Million) Forecast by Capacity, 2018 to 2033

Table 36: Asia Pacific Market Volume (Units) Forecast by Capacity, 2018 to 2033

Table 37: Asia Pacific Market Value (US$ Million) Forecast by Material, 2018 to 2033

Table 38: Asia Pacific Market Volume (Units) Forecast by Material, 2018 to 2033

Table 39: Asia Pacific Market Value (US$ Million) Forecast by Motor Power, 2018 to 2033

Table 40: Asia Pacific Market Volume (Units) Forecast by Motor Power, 2018 to 2033

Table 41: MEA Market Value (US$ Million) Forecast by Country, 2018 to 2033

Table 42: MEA Market Volume (Units) Forecast by Country, 2018 to 2033

Table 43: MEA Market Value (US$ Million) Forecast by Capacity, 2018 to 2033

Table 44: MEA Market Volume (Units) Forecast by Capacity, 2018 to 2033

Table 45: MEA Market Value (US$ Million) Forecast by Material, 2018 to 2033

Table 46: MEA Market Volume (Units) Forecast by Material, 2018 to 2033

Table 47: MEA Market Value (US$ Million) Forecast by Motor Power, 2018 to 2033

Table 48: MEA Market Volume (Units) Forecast by Motor Power, 2018 to 2033

List of Charts

Figure 1: Global Market Value (US$ Million) by Capacity, 2023 to 2033

Figure 2: Global Market Value (US$ Million) by Material, 2023 to 2033

Figure 3: Global Market Value (US$ Million) by Motor Power, 2023 to 2033

Figure 4: Global Market Value (US$ Million) by Region, 2023 to 2033

Figure 5: Global Market Value (US$ Million) Analysis by Region, 2018 to 2033

Figure 6: Global Market Volume (Units) Analysis by Region, 2018 to 2033

Figure 7: Global Market Value Share (%) and BPS Analysis by Region, 2023 to 2033

Figure 8: Global Market Y-o-Y Growth (%) Projections by Region, 2023 to 2033

Figure 9: Global Market Value (US$ Million) Analysis by Capacity, 2018 to 2033

Figure 10: Global Market Volume (Units) Analysis by Capacity, 2018 to 2033

Figure 11: Global Market Value Share (%) and BPS Analysis by Capacity, 2023 to 2033

Figure 12: Global Market Y-o-Y Growth (%) Projections by Capacity, 2023 to 2033

Figure 13: Global Market Value (US$ Million) Analysis by Material, 2018 to 2033

Figure 14: Global Market Volume (Units) Analysis by Material, 2018 to 2033

Figure 15: Global Market Value Share (%) and BPS Analysis by Material, 2023 to 2033

Figure 16: Global Market Y-o-Y Growth (%) Projections by Material, 2023 to 2033

Figure 17: Global Market Value (US$ Million) Analysis by Motor Power, 2018 to 2033

Figure 18: Global Market Volume (Units) Analysis by Motor Power, 2018 to 2033

Figure 19: Global Market Value Share (%) and BPS Analysis by Motor Power, 2023 to 2033

Figure 20: Global Market Y-o-Y Growth (%) Projections by Motor Power, 2023 to 2033

Figure 21: Global Market Attractiveness by Capacity, 2023 to 2033

Figure 22: Global Market Attractiveness by Material, 2023 to 2033

Figure 23: Global Market Attractiveness by Motor Power, 2023 to 2033

Figure 24: Global Market Attractiveness by Region, 2023 to 2033

Figure 25: North America Market Value (US$ Million) by Capacity, 2023 to 2033

Figure 26: North America Market Value (US$ Million) by Material, 2023 to 2033

Figure 27: North America Market Value (US$ Million) by Motor Power, 2023 to 2033

Figure 28: North America Market Value (US$ Million) by Country, 2023 to 2033

Figure 29: North America Market Value (US$ Million) Analysis by Country, 2018 to 2033

Figure 30: North America Market Volume (Units) Analysis by Country, 2018 to 2033

Figure 31: North America Market Value Share (%) and BPS Analysis by Country, 2023 to 2033

Figure 32: North America Market Y-o-Y Growth (%) Projections by Country, 2023 to 2033

Figure 33: North America Market Value (US$ Million) Analysis by Capacity, 2018 to 2033

Figure 34: North America Market Volume (Units) Analysis by Capacity, 2018 to 2033

Figure 35: North America Market Value Share (%) and BPS Analysis by Capacity, 2023 to 2033

Figure 36: North America Market Y-o-Y Growth (%) Projections by Capacity, 2023 to 2033

Figure 37: North America Market Value (US$ Million) Analysis by Material, 2018 to 2033

Figure 38: North America Market Volume (Units) Analysis by Material, 2018 to 2033

Figure 39: North America Market Value Share (%) and BPS Analysis by Material, 2023 to 2033

Figure 40: North America Market Y-o-Y Growth (%) Projections by Material, 2023 to 2033

Figure 41: North America Market Value (US$ Million) Analysis by Motor Power, 2018 to 2033

Figure 42: North America Market Volume (Units) Analysis by Motor Power, 2018 to 2033

Figure 43: North America Market Value Share (%) and BPS Analysis by Motor Power, 2023 to 2033

Figure 44: North America Market Y-o-Y Growth (%) Projections by Motor Power, 2023 to 2033

Figure 45: North America Market Attractiveness by Capacity, 2023 to 2033

Figure 46: North America Market Attractiveness by Material, 2023 to 2033

Figure 47: North America Market Attractiveness by Motor Power, 2023 to 2033

Figure 48: North America Market Attractiveness by Country, 2023 to 2033

Figure 49: Latin America Market Value (US$ Million) by Capacity, 2023 to 2033

Figure 50: Latin America Market Value (US$ Million) by Material, 2023 to 2033

Figure 51: Latin America Market Value (US$ Million) by Motor Power, 2023 to 2033

Figure 52: Latin America Market Value (US$ Million) by Country, 2023 to 2033

Figure 53: Latin America Market Value (US$ Million) Analysis by Country, 2018 to 2033

Figure 54: Latin America Market Volume (Units) Analysis by Country, 2018 to 2033

Figure 55: Latin America Market Value Share (%) and BPS Analysis by Country, 2023 to 2033

Figure 56: Latin America Market Y-o-Y Growth (%) Projections by Country, 2023 to 2033

Figure 57: Latin America Market Value (US$ Million) Analysis by Capacity, 2018 to 2033

Figure 58: Latin America Market Volume (Units) Analysis by Capacity, 2018 to 2033

Figure 59: Latin America Market Value Share (%) and BPS Analysis by Capacity, 2023 to 2033

Figure 60: Latin America Market Y-o-Y Growth (%) Projections by Capacity, 2023 to 2033

Figure 61: Latin America Market Value (US$ Million) Analysis by Material, 2018 to 2033

Figure 62: Latin America Market Volume (Units) Analysis by Material, 2018 to 2033

Figure 63: Latin America Market Value Share (%) and BPS Analysis by Material, 2023 to 2033

Figure 64: Latin America Market Y-o-Y Growth (%) Projections by Material, 2023 to 2033

Figure 65: Latin America Market Value (US$ Million) Analysis by Motor Power, 2018 to 2033

Figure 66: Latin America Market Volume (Units) Analysis by Motor Power, 2018 to 2033

Figure 67: Latin America Market Value Share (%) and BPS Analysis by Motor Power, 2023 to 2033

Figure 68: Latin America Market Y-o-Y Growth (%) Projections by Motor Power, 2023 to 2033

Figure 69: Latin America Market Attractiveness by Capacity, 2023 to 2033

Figure 70: Latin America Market Attractiveness by Material, 2023 to 2033

Figure 71: Latin America Market Attractiveness by Motor Power, 2023 to 2033

Figure 72: Latin America Market Attractiveness by Country, 2023 to 2033

Figure 73: Europe Market Value (US$ Million) by Capacity, 2023 to 2033

Figure 74: Europe Market Value (US$ Million) by Material, 2023 to 2033

Figure 75: Europe Market Value (US$ Million) by Motor Power, 2023 to 2033

Figure 76: Europe Market Value (US$ Million) by Country, 2023 to 2033

Figure 77: Europe Market Value (US$ Million) Analysis by Country, 2018 to 2033

Figure 78: Europe Market Volume (Units) Analysis by Country, 2018 to 2033

Figure 79: Europe Market Value Share (%) and BPS Analysis by Country, 2023 to 2033

Figure 80: Europe Market Y-o-Y Growth (%) Projections by Country, 2023 to 2033

Figure 81: Europe Market Value (US$ Million) Analysis by Capacity, 2018 to 2033

Figure 82: Europe Market Volume (Units) Analysis by Capacity, 2018 to 2033

Figure 83: Europe Market Value Share (%) and BPS Analysis by Capacity, 2023 to 2033

Figure 84: Europe Market Y-o-Y Growth (%) Projections by Capacity, 2023 to 2033

Figure 85: Europe Market Value (US$ Million) Analysis by Material, 2018 to 2033

Figure 86: Europe Market Volume (Units) Analysis by Material, 2018 to 2033

Figure 87: Europe Market Value Share (%) and BPS Analysis by Material, 2023 to 2033

Figure 88: Europe Market Y-o-Y Growth (%) Projections by Material, 2023 to 2033

Figure 89: Europe Market Value (US$ Million) Analysis by Motor Power, 2018 to 2033

Figure 90: Europe Market Volume (Units) Analysis by Motor Power, 2018 to 2033

Figure 91: Europe Market Value Share (%) and BPS Analysis by Motor Power, 2023 to 2033

Figure 92: Europe Market Y-o-Y Growth (%) Projections by Motor Power, 2023 to 2033

Figure 93: Europe Market Attractiveness by Capacity, 2023 to 2033

Figure 94: Europe Market Attractiveness by Material, 2023 to 2033

Figure 95: Europe Market Attractiveness by Motor Power, 2023 to 2033

Figure 96: Europe Market Attractiveness by Country, 2023 to 2033

Figure 97: Asia Pacific Market Value (US$ Million) by Capacity, 2023 to 2033

Figure 98: Asia Pacific Market Value (US$ Million) by Material, 2023 to 2033

Figure 99: Asia Pacific Market Value (US$ Million) by Motor Power, 2023 to 2033

Figure 100: Asia Pacific Market Value (US$ Million) by Country, 2023 to 2033

Figure 101: Asia Pacific Market Value (US$ Million) Analysis by Country, 2018 to 2033

Figure 102: Asia Pacific Market Volume (Units) Analysis by Country, 2018 to 2033

Figure 103: Asia Pacific Market Value Share (%) and BPS Analysis by Country, 2023 to 2033

Figure 104: Asia Pacific Market Y-o-Y Growth (%) Projections by Country, 2023 to 2033

Figure 105: Asia Pacific Market Value (US$ Million) Analysis by Capacity, 2018 to 2033

Figure 106: Asia Pacific Market Volume (Units) Analysis by Capacity, 2018 to 2033

Figure 107: Asia Pacific Market Value Share (%) and BPS Analysis by Capacity, 2023 to 2033

Figure 108: Asia Pacific Market Y-o-Y Growth (%) Projections by Capacity, 2023 to 2033

Figure 109: Asia Pacific Market Value (US$ Million) Analysis by Material, 2018 to 2033

Figure 110: Asia Pacific Market Volume (Units) Analysis by Material, 2018 to 2033

Figure 111: Asia Pacific Market Value Share (%) and BPS Analysis by Material, 2023 to 2033

Figure 112: Asia Pacific Market Y-o-Y Growth (%) Projections by Material, 2023 to 2033

Figure 113: Asia Pacific Market Value (US$ Million) Analysis by Motor Power, 2018 to 2033

Figure 114: Asia Pacific Market Volume (Units) Analysis by Motor Power, 2018 to 2033

Figure 115: Asia Pacific Market Value Share (%) and BPS Analysis by Motor Power, 2023 to 2033

Figure 116: Asia Pacific Market Y-o-Y Growth (%) Projections by Motor Power, 2023 to 2033

Figure 117: Asia Pacific Market Attractiveness by Capacity, 2023 to 2033

Figure 118: Asia Pacific Market Attractiveness by Material, 2023 to 2033

Figure 119: Asia Pacific Market Attractiveness by Motor Power, 2023 to 2033

Figure 120: Asia Pacific Market Attractiveness by Country, 2023 to 2033

Figure 121: MEA Market Value (US$ Million) by Capacity, 2023 to 2033

Figure 122: MEA Market Value (US$ Million) by Material, 2023 to 2033

Figure 123: MEA Market Value (US$ Million) by Motor Power, 2023 to 2033

Figure 124: MEA Market Value (US$ Million) by Country, 2023 to 2033

Figure 125: MEA Market Value (US$ Million) Analysis by Country, 2018 to 2033

Figure 126: MEA Market Volume (Units) Analysis by Country, 2018 to 2033

Figure 127: MEA Market Value Share (%) and BPS Analysis by Country, 2023 to 2033

Figure 128: MEA Market Y-o-Y Growth (%) Projections by Country, 2023 to 2033

Figure 129: MEA Market Value (US$ Million) Analysis by Capacity, 2018 to 2033

Figure 130: MEA Market Volume (Units) Analysis by Capacity, 2018 to 2033

Figure 131: MEA Market Value Share (%) and BPS Analysis by Capacity, 2023 to 2033

Figure 132: MEA Market Y-o-Y Growth (%) Projections by Capacity, 2023 to 2033

Figure 133: MEA Market Value (US$ Million) Analysis by Material, 2018 to 2033

Figure 134: MEA Market Volume (Units) Analysis by Material, 2018 to 2033

Figure 135: MEA Market Value Share (%) and BPS Analysis by Material, 2023 to 2033

Figure 136: MEA Market Y-o-Y Growth (%) Projections by Material, 2023 to 2033

Figure 137: MEA Market Value (US$ Million) Analysis by Motor Power, 2018 to 2033

Figure 138: MEA Market Volume (Units) Analysis by Motor Power, 2018 to 2033

Figure 139: MEA Market Value Share (%) and BPS Analysis by Motor Power, 2023 to 2033

Figure 140: MEA Market Y-o-Y Growth (%) Projections by Motor Power, 2023 to 2033

Figure 141: MEA Market Attractiveness by Capacity, 2023 to 2033

Figure 142: MEA Market Attractiveness by Material, 2023 to 2033

Figure 143: MEA Market Attractiveness by Motor Power, 2023 to 2033

Figure 144: MEA Market Attractiveness by Country, 2023 to 2033

Recommendations

Process Automation

Chicken Plucking Machine Market

Published : January 2023

Explore Industrial Automation Insights

View Reports