Reports

- Global Locations -

Headquarters

Future Market Insights, Inc.

Christiana Corporate, 200
Continental Drive, Suite 401,
Newark, Delaware - 19713,
United States

T: +1-845-579-5705

Americas

Future Market Insights, Inc.

616 Corporate Way, Suite 2-9018,
Valley Cottage, NY 10989, United States

T: +1-347-918-3531

MEA

Future Market Insights

1602-6 Jumeirah Bay X2 Tower, Plot No: JLT-PH2-X2A,
Jumeirah Lakes Towers, Dubai,
United Arab Emirates

Europe

Future Market Insights

3rd Floor, 207 Regent Street,
W1B 3HH London
United Kingdom

T: + 44 (0) 20 8123 9659
D: +44 (0) 20 3287 4268

Asia Pacific

Future Market Insights

IndiaLand Global Tech Park, Unit UG-1, Behind Grand HighStreet, Phase 1, Hinjawadi, MH, Pune – 411057, India

Plumbing Fitting & Fixtures Market Snapshot (2023 to 2033)

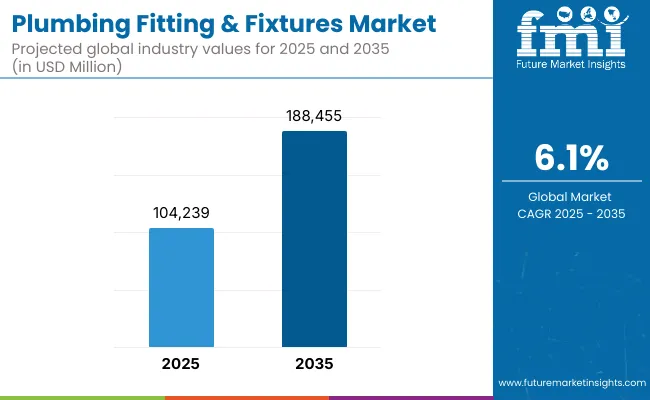
The global plumbing fitting & fixtures market is anticipated at US$ 89 billion in 2022. Demand is likely to remain high for plumbing fittings & fixtures during the assessment period. The market is likely to reach US$ 164.8 billion in 2033, recording a CAGR of 5.7% from 2023 to 2033. The market is likely to secure US$ 94.3 billion in 2023.

Attribute Details
Plumbing Fitting & Fixtures Market Size Value in 2023 US$ 94.3 billion
Plumbing Fitting & Fixtures Market Forecast Value in 2033 US$ 164.8 billion
Global Growth Rate 5.7% CAGR
Forecast Period 2023 to 2033

Don't pay for what you don't need

Customize your report by selecting specific countries or regions and save 30%!

Key Factors Shaping the Demand Outlook of the Plumbing Fitting & Fixtures Industry

  • Rising application in the Industrial, and residential sectors to augment the growth of the plumbing fitting & fixtures market
  • Increasing repair and remodeling of kitchens, and restrooms elevates the demand
  • Widening application of plumbing fitting & fixtures in the commercial sector is expected to spur the growth
  • Growing advances in technology are expected to create new growth prospects for plumbing fitting & fixtures manufacturers.

Plumbing Fitting & Fixtures Market Revenue Analysis from 2018 to 2022 Vs Market Outlook for 2023 to 2033

Historical CAGR (2018 to 2022) 7.0%
Forecasted CAGR (2023 to 2033) 5.7%

The increasing application in the residential and commercial sectors is expected to drive the growth of the plumbing fittings & fixtures market. The increased technological advancement and increased disposable income drive the growth of the plumbing fittings & fixtures market during the forecast period.

The increasing focus on water conservation and sustainability in plumbing systems. This has led to the development and adoption of eco-friendly plumbing fittings and fixtures that reduce water consumption without compromising performance and is expected to drive the growth of the plumbing fittings & fixtures market during the forecast period.

The increasing demand for smart plumbing technologies, such as sensors and automated systems, that offer improved efficiency and convenience is expected to boost the market demand. The plumbing fittings & fixtures market is projected to show a noteworthy growth of US$ 164.8billion by the end of the forecast period of 2033

Nikhil Kaitwade
Nikhil Kaitwade

Principal Consultant

Talk to Analyst

Find your sweet spots for generating winning opportunities in this market.

Which Drivers Underpin Plumbing Fitting & Fixtures Industry Expansion?

Rapid Infrastructural Development to Drive the Growth of the Plumbing Fitting & Fixtures Market

The increasing demand for smart homes & offices is positively influencing the growth of the plumbing fittings & fixtures market. Increasing construction activities and rapid urbanization and the use of modern architecture with water-efficient systems are likely to spur the demand for plumbing fittings & fixtures.

The global population is continuously growing, leading to increased urbanization. Urban areas require extensive plumbing systems to cater to the needs of a large population. This drives the demand for plumbing fittings and fixtures. Increasing demand for new plumbing fittings and fixtures to replace outdated or worn-out components owing to the increase in renovation and remodeling projects in residential and commercial buildings. Thus the growing urbanization and increased demand for new houses & apartments are expected to provide an opportunity for growth of the plumbing fittings and fixtures market during the forecast period.

Increasing Disposable Income to Boost the Growth of the Market

The increasing disposable income of individuals around the globe & increasing renovation activities for changing the look of the kitchens, and bathrooms have prompted the growth of the plumbing fittings & fixtures market. The increasing popularity of smart homes and changing aesthetic appeals of the home are expected to drive the plumbing fittings & fixtures market.

With increased awareness about hygiene & sanitization consumers are more willing to invest in high-quality plumbing fittings and fixtures. This trend drives the demand for premium products with improved design, this awareness has led to increased demand for plumbing fittings & fixtures.

Comparative View of Adjacent Plumbing Fitting & Fixtures Markets

Global Plumbing Fitting & Fixtures Market:

Attributes Global Plumbing Fitting & Fixtures Market
CAGR (2023 to 2033) 5.7%
Market Value (2033) US$ 164.8 billion
Growth Factor The rapid growth in the residential sector is expected to boost market sales in the forecast period.
Opportunities Technological advances in plumbing technology & introduction of touchless faucets, antimicrobial surfaces, and hygienic toilet designs offer opportunities for market expansion in the forecast period.

Global Pipes Market:

Attributes Global Pipes Market
CAGR (2023 to 2033) 5.4%
Market Value (2033) US$ 237 billion
Growth Factor Growth in construction activities in the industrial, commercial & residential sectors is expected to boost the market growth in the forecast period.
Opportunities Significant growth in infrastructure development & waste management industry is expected to offer significant opportunities for market expansion in the forecast period.

Global Plumbing Fixtures Market:

Attributes Global Plumbing Fixtures Market
CAGR (2023 to 2033) 4.8%
Market Value (2033) US$ 24.6 billion
Growth Factor Increasing disposable income& rising popularity of smart homes are expected to boost market sales in the forecast period.
Opportunities Introduction of new systems like water efficient systems is anticipated to augment the market expansion in the forecast period.

Get the data you need at a Fraction of the cost

Personalize your report by choosing insights you need
and save 40%!

Country-wise Insights

Why is the United States Regarded as a Prominent Market for Plumbing Fittings & Fixtures Market?

Increasing Application of Smart Plumbing Techniques to Boost the Growth of the Plumbing Fittings & Fixtures Market in the United States

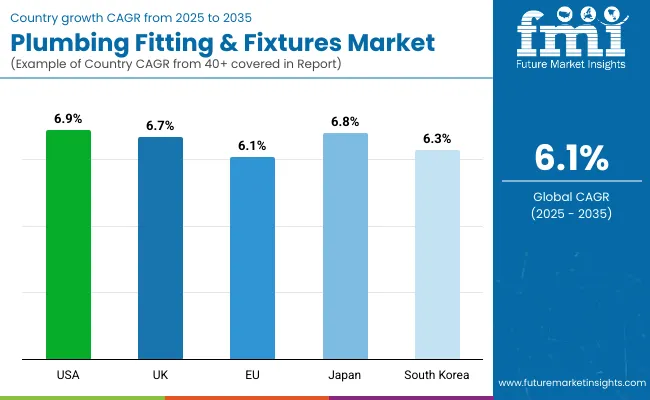
The global plumbing fitting & fixtures market is expected to be dominated by North America. The market is anticipated to expand at a CAGR of 5.7% and is expected to accumulate a market value of US$ 28.3 billion over the forecast period.

The rapid development in the new residential, commercial, and infrastructure projects drives the demand for plumbing fittings and fixtures. The construction of housing units, office buildings, hotels, hospitals, and educational institutions creates a robust market for plumbing products.

The rising trend of having bathrooms with aesthetic appeals is bringing extensive demand for plumbing fittings & fixtures. The rapid technological advances in plumbing technology and increased application of smart plumbing technology provide opportunities for the plumbing fittings & fixtures market during the forecast period.

How Will the Plumbing Fittings & Fixtures Market Expand Across the United Kingdom?

Growing Construction Activities in the Region to Boost the Growth of the Market in the United Kingdom

The plumbing fittings & fixtures sales in the United Kingdom are expected to keep rising with a CAGR of 5.5% and are expected to gain a market value of US$ 6.1 billion by the end of the forecast period.

A robust construction industry with ongoing residential, commercial, and infrastructure projects in the region. The construction of new buildings and infrastructure requires plumbing systems and components, driving the demand for plumbing fittings and fixtures.

Increasing use of water-efficient plumbing fittings and fixtures, owing to the strict water efficiency regulations and standards implemented by governments and regulatory bodies, leads to market growth. Increasing awareness about hygiene & sanitation and increased demand for touchless and antimicrobial plumbing fixtures boosts the market growth.

What is the Demand Scenario for Plumbing Fittings & Fixtures in China?

Rapid Urbanization to Drive the Growth of the Market in China

China’s plumbing fittings & fixtures market is expected to rise at a 5.5% CAGR between 2023 to 2033. The market is expected to gain a market value of US$ 35.2 billion by the end of the forecast period. China accounts for the highest market share in the plumbing fittings & fixtures market.

China's ongoing urbanization process has led to a surge in construction activities, including residential, commercial, and infrastructure projects. As cities expand, there is a high demand for plumbing systems and components, driving the growth of the plumbing fittings and fixtures market.

Category-wise Insights

Based on Product Type, Which Is the Most Prominent Segment in the Plumbing Fittings & Fixtures Market?

Bathroom Fixtures & Fittings A Segment to Gain Significant Traction During the Forecast Period

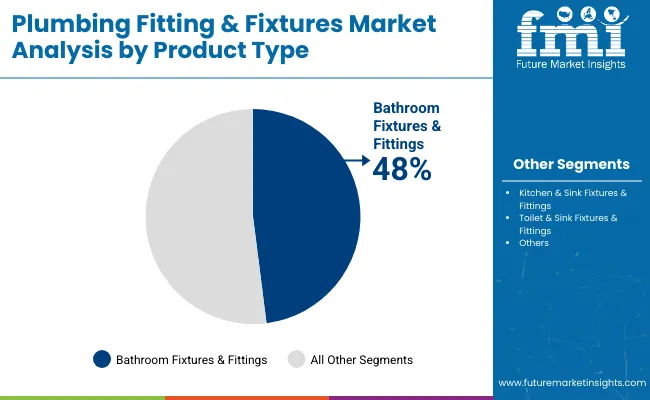
Based on product type, the plumbing fittings & fixtures market is segmented into bathroom fixtures & fittings, kitchen & sink fixtures & fittings, toilet & sink fixtures & fittings, and other segments. The bathroom fixtures & fittings segment is expected to dominate the market in the forecast period. The segment is projected to exhibit a CAGR of 5.6% during the forecast period.

Bathroom fixtures and fittings refer to the essential components and accessories that are installed in bathrooms. These include various items such as faucets, sinks, toilets, bathtubs, showers, vanities, mirrors, towel bars, and other accessories. Rapid demand for bathroom fittings and fixtures is driving segmental growth.

Based on Application, Which Segment Accounts for the Highest Revenue in the Plumbing Fittings & Fixtures Market?

Residential Segment Generates High Revenue

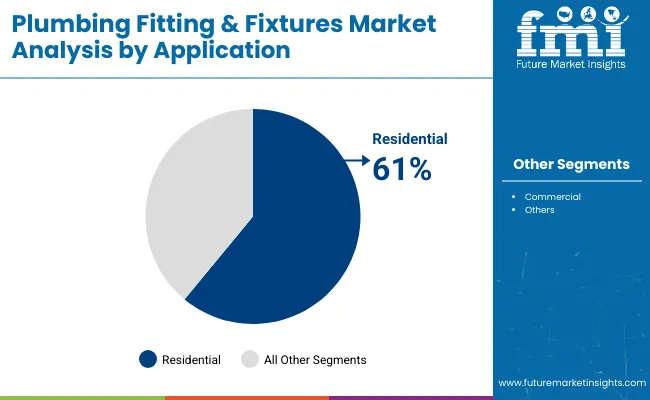
Based on the application, the market is segmented into the residential & commercial segments. Among all, the residential segment remains the application category is expected to expand with a CAGR of 5.4% throughout the forecast period.

The residential sector is the fastest-growing application of the plumbing fittings & fixtures market owing to the new construction activities going on in the residential sector and increased urbanization to boost the growth of the segment. On the other hand, the commercial segment is expected to account for a significant share of the market during the forecast period.

The Start-Up Ecosystem: How Key Players Are Opening Frontiers for Future Growth?

New players in the plumbing fittings & fixtures market trade only plumbing gem commercial and zip water among others are adopting various marketing strategies such as new product launches, geographical expansion, mergers and acquisitions, partnerships, and collaboration to identify the interest of potential buyers and create a larger customer base. For instance

  • Founded in 2002 Trade Only Plumbing is the E-distributor of building supplies. The product catalog includes plumbing supplies, bathroom furniture, fittings & spares, pipe & fittings, power tools & accessories, macerators, heating supplies, and more.
  • Founded in 2013 - Gemm Commercial provides commercial maintenance and bathroom renovation services. Offerings include bathroom designing, coloring, fixtures & fittings, and commercial services such as office partitioning & ceilings, designing boardrooms, conference rooms, kitchens & cabinets, electrical & plumbing services, and more. Some of its clients include Novotel, Pan Pacific Perth, Brennen Sloan, and more.
  • HydroTap by Zip Water: HydroTap by Zip Water is a start-up that specializes in providing filtered boiling, chilled, and sparkling water systems for homes and offices. Their products offer convenience, energy efficiency, and superior water quality compared to traditional water dispensers.

Who are the Leading Players in the Plumbing Fittings & Fixtures Market?

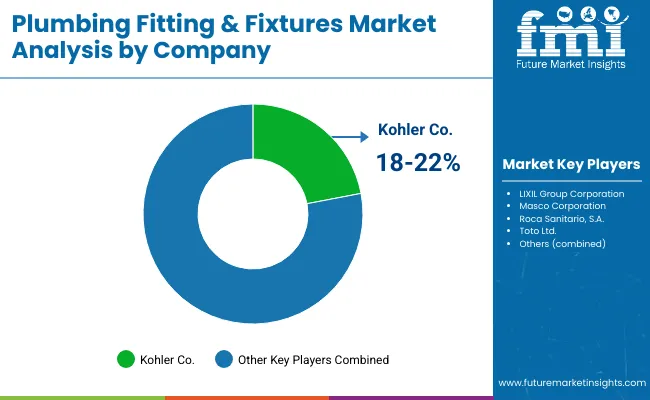
Prominent players in the plumbing fittings & fixtures market are American Bath Group; American Standard Brands; Asahi Eito Co., Ltd.; Cera Sanitaryware Ltd.; Elkay Manufacturing Company among others.

The key players in plumbing fittings & fixtures are focusing on improved productivity and quality of their products in order to gain more customer base. Key players are working on research & development activities for the effective composition of the material that is to be used for manufacturing.

Other expansion strategies of key players include extensive research & development activities, collaborations, and mergers & acquisitions. Some notable developments are as follows:

  • In June 2020 - American Standard introduced its new, easy-to-install filtration products for kitchen and bath: The American Standard Filtered Kitchen Faucet and Filtered 4-Spray Hand Shower Rail System. They offer a wide range of products, including faucets, toilets, bathtubs, showers, and sinks. American Standard focuses on water efficiency, durability, and customer satisfaction
  • CERA, India’s fastest-growing home solutions provider, which has been known for its path-breaking innovations since 1980, is proud to launch SENATOR by CERA, a premium range of sanitary ware, faucets, wellness, and mirrors. Being a leader in style and innovation CERA presents yet another opportunity for consumers to give their bathroom an edge by choosing from a wide range of premium collections.

Report Scope

Attribute Details
Growth Rate CAGR of 5.7% from 2023 to2033
Market Value in 2023 US$ 94.3 billion
Market Value in 2033 US$ 164.8 billion
Base Year for Estimation 2022
Historical Data 2018 to 2022
Forecast Period 2023 to 2033
Quantitative Units Revenue in US$ billion and CAGR from 2023 to 2033
Report Coverage Revenue Forecast, Company Ranking, Competitive Landscape, Growth Factors, Trends, and Pricing Analysis
Segments Covered
  • Product Type
  • Application
  • Region
Regions Covered
  • North America
  • Latin America
  • Europe
  • Asia Pacific
  • Middle East and Africa
Key Countries Profiled
  • United States
  • Canada
  • Brazil
  • Mexico
  • Germany
  • United Kingdom
  • France
  • Spain
  • Italy
  • China
  • Japan
  • South Korea
  • Singapore
  • Thailand
  • Indonesia
  • Australia
  • New Zealand
  • GCC
  • South Africa
  • Israel
Key Companies Profiled
  • American Bath Group
  • American Standard Brands
  • Asahi Eito Co., Ltd.
  • Cera Sanitaryware Ltd.
  • Elkay Manufacturing Company

Key Segments Covered in the Plumbing Fittings & Fixtures Industry Analysis

Plumbing Fittings & Fixtures Market by Product Type:

  • Bathroom Fixtures & Fittings
  • Kitchen & Sink Fixtures & Fittings
  • Toilet & Sink Fixtures & Fittings
  • Others

Plumbing Fittings & Fixtures Market by Application:

  • Residential
  • Commercial

Plumbing Fittings & Fixtures Market by Region:

  • North America
  • Latin America
  • Europe
  • Asia Pacific
  • Middle East and Africa

Frequently Asked Questions

How Big is the Plumbing Fitting & Fixtures Market?

The market is anticipated to be worth US$ 94.3 billion in 2023.

What is the Growth Potential of the Market?

The growth potential of the market is 5.7% through 2033.

Which Factors Support the Market Growth?

Surging kitchen repairs and remodeling, and expanding applications in the commercial sector.

Which Factors are Creating Growth Prospects for the Plumbing Fitting & Fixtures Market?

Increase in the launch of touchless faucets, hygienic toilet designs, and antimicrobial surfaces.

What is the Demand Scope for Plumbing Fitting & Fixtures in China?

The demand scope for plumbing fitting & fixtures in China is 5.5% CAGR.

Table of Content

1. Executive Summary

    1.1. Global Market Outlook

    1.2. Demand-side Trends

    1.3. Supply-side Trends

    1.4. Technology Roadmap Analysis

    1.5. Analysis and Recommendations

2. Market Overview

    2.1. Market Coverage / Taxonomy

    2.2. Market Definition / Scope / Limitations

3. Market Background

    3.1. Market Dynamics

        3.1.1. Drivers

        3.1.2. Restraints

        3.1.3. Opportunity

        3.1.4. Trends

    3.2. Scenario Forecast

        3.2.1. Demand in Optimistic Scenario

        3.2.2. Demand in Likely Scenario

        3.2.3. Demand in Conservative Scenario

    3.3. Opportunity Map Analysis

    3.4. Product Life Cycle Analysis

    3.5. Supply Chain Analysis

        3.5.1. Supply Side Participants and their Roles

            3.5.1.1. Producers

            3.5.1.2. Mid-Level Participants (Traders/ Agents/ Brokers)

            3.5.1.3. Wholesalers and Distributors

        3.5.2. Value Added and Value Created at Node in the Supply Chain

        3.5.3. List of Raw Material Suppliers

        3.5.4. List of Existing and Potential Buyer’s

    3.6. Investment Feasibility Matrix

    3.7. Value Chain Analysis

        3.7.1. Profit Margin Analysis

        3.7.2. Wholesalers and Distributors

        3.7.3. Retailers

    3.8. PESTLE and Porter’s Analysis

    3.9. Regulatory Landscape

        3.9.1. By Key Regions

        3.9.2. By Key Countries

    3.10. Regional Parent Market Outlook

    3.11. Production and Consumption Statistics

    3.12. Import and Export Statistics

4. Global Market Analysis 2018 to 2022 and Forecast, 2023 to 2033

    4.1. Historical Market Size Value (US$ Million) & Volume (Units) Analysis, 2018 to 2022

    4.2. Current and Future Market Size Value (US$ Million) & Volume (Units) Projections, 2023 to 2033

        4.2.1. Y-o-Y Growth Trend Analysis

        4.2.2. Absolute $ Opportunity Analysis

5. Global Market Analysis 2018 to 2022 and Forecast 2023 to 2033, By Product Type

    5.1. Introduction / Key Findings

    5.2. Historical Market Size Value (US$ Million) & Volume (Units) Analysis By Product Type, 2018 to 2022

    5.3. Current and Future Market Size Value (US$ Million) & Volume (Units) Analysis and Forecast By Product Type, 2023 to 2033

        5.3.1. Bathroom Fixtures & Fittings

        5.3.2. Kitchen & Sink Fixtures & Fittings

        5.3.3. Toilet & Sink Fixtures & Fittings

        5.3.4. Others

    5.4. Y-o-Y Growth Trend Analysis By Product Type, 2018 to 2022

    5.5. Absolute $ Opportunity Analysis By Product Type, 2023 to 2033

6. Global Market Analysis 2018 to 2022 and Forecast 2023 to 2033, By Application

    6.1. Introduction / Key Findings

    6.2. Historical Market Size Value (US$ Million) & Volume (Units) Analysis By Application, 2018 to 2022

    6.3. Current and Future Market Size Value (US$ Million) & Volume (Units) Analysis and Forecast By Application, 2023 to 2033

        6.3.1. Residential

        6.3.2. Commercial

    6.4. Y-o-Y Growth Trend Analysis By Application, 2018 to 2022

    6.5. Absolute $ Opportunity Analysis By Application, 2023 to 2033

7. Global Market Analysis 2018 to 2022 and Forecast 2023 to 2033, By Region

    7.1. Introduction

    7.2. Historical Market Size Value (US$ Million) & Volume (Units) Analysis By Region, 2018 to 2022

    7.3. Current Market Size Value (US$ Million) & Volume (Units) Analysis and Forecast By Region, 2023 to 2033

        7.3.1. North America

        7.3.2. Latin America

        7.3.3. Europe

        7.3.4. Asia Pacific

        7.3.5. MEA

    7.4. Market Attractiveness Analysis By Region

8. North America Market Analysis 2018 to 2022 and Forecast 2023 to 2033, By Country

    8.1. Historical Market Size Value (US$ Million) & Volume (Units) Trend Analysis By Market Taxonomy, 2018 to 2022

    8.2. Market Size Value (US$ Million) & Volume (Units) Forecast By Market Taxonomy, 2023 to 2033

        8.2.1. By Country

            8.2.1.1. The USA

            8.2.1.2. Canada

        8.2.2. By Product Type

        8.2.3. By Application

    8.3. Market Attractiveness Analysis

        8.3.1. By Country

        8.3.2. By Product Type

        8.3.3. By Application

    8.4. Key Takeaways

9. Latin America Market Analysis 2018 to 2022 and Forecast 2023 to 2033, By Country

    9.1. Historical Market Size Value (US$ Million) & Volume (Units) Trend Analysis By Market Taxonomy, 2018 to 2022

    9.2. Market Size Value (US$ Million) & Volume (Units) Forecast By Market Taxonomy, 2023 to 2033

        9.2.1. By Country

            9.2.1.1. Brazil

            9.2.1.2. Mexico

            9.2.1.3. Rest of Latin America

        9.2.2. By Product Type

        9.2.3. By Application

    9.3. Market Attractiveness Analysis

        9.3.1. By Country

        9.3.2. By Product Type

        9.3.3. By Application

    9.4. Key Takeaways

10. Europe Market Analysis 2018 to 2022 and Forecast 2023 to 2033, By Country

    10.1. Historical Market Size Value (US$ Million) & Volume (Units) Trend Analysis By Market Taxonomy, 2018 to 2022

    10.2. Market Size Value (US$ Million) & Volume (Units) Forecast By Market Taxonomy, 2023 to 2033

        10.2.1. By Country

            10.2.1.1. Germany

            10.2.1.2. United Kingdom

            10.2.1.3. France

            10.2.1.4. Spain

            10.2.1.5. Italy

            10.2.1.6. Rest of Europe

        10.2.2. By Product Type

        10.2.3. By Application

    10.3. Market Attractiveness Analysis

        10.3.1. By Country

        10.3.2. By Product Type

        10.3.3. By Application

    10.4. Key Takeaways

11. Asia Pacific Market Analysis 2018 to 2022 and Forecast 2023 to 2033, By Country

    11.1. Historical Market Size Value (US$ Million) & Volume (Units) Trend Analysis By Market Taxonomy, 2018 to 2022

    11.2. Market Size Value (US$ Million) & Volume (Units) Forecast By Market Taxonomy, 2023 to 2033

        11.2.1. By Country

            11.2.1.1. China

            11.2.1.2. Japan

            11.2.1.3. South Korea

            11.2.1.4. Singapore

            11.2.1.5. Thailand

            11.2.1.6. Indonesia

            11.2.1.7. Australia

            11.2.1.8. New Zealand

            11.2.1.9. Rest of Asia Pacific

        11.2.2. By Product Type

        11.2.3. By Application

    11.3. Market Attractiveness Analysis

        11.3.1. By Country

        11.3.2. By Product Type

        11.3.3. By Application

    11.4. Key Takeaways

12. MEA Market Analysis 2018 to 2022 and Forecast 2023 to 2033, By Country

    12.1. Historical Market Size Value (US$ Million) & Volume (Units) Trend Analysis By Market Taxonomy, 2018 to 2022

    12.2. Market Size Value (US$ Million) & Volume (Units) Forecast By Market Taxonomy, 2023 to 2033

        12.2.1. By Country

            12.2.1.1. GCC Countries

            12.2.1.2. South Africa

            12.2.1.3. Israel

            12.2.1.4. Rest of MEA

        12.2.2. By Product Type

        12.2.3. By Application

    12.3. Market Attractiveness Analysis

        12.3.1. By Country

        12.3.2. By Product Type

        12.3.3. By Application

    12.4. Key Takeaways

13. Key Countries Market Analysis

    13.1. USA

        13.1.1. Pricing Analysis

        13.1.2. Market Share Analysis, 2022

            13.1.2.1. By Product Type

            13.1.2.2. By Application

    13.2. Canada

        13.2.1. Pricing Analysis

        13.2.2. Market Share Analysis, 2022

            13.2.2.1. By Product Type

            13.2.2.2. By Application

    13.3. Brazil

        13.3.1. Pricing Analysis

        13.3.2. Market Share Analysis, 2022

            13.3.2.1. By Product Type

            13.3.2.2. By Application

    13.4. Mexico

        13.4.1. Pricing Analysis

        13.4.2. Market Share Analysis, 2022

            13.4.2.1. By Product Type

            13.4.2.2. By Application

    13.5. Germany

        13.5.1. Pricing Analysis

        13.5.2. Market Share Analysis, 2022

            13.5.2.1. By Product Type

            13.5.2.2. By Application

    13.6. United Kingdom

        13.6.1. Pricing Analysis

        13.6.2. Market Share Analysis, 2022

            13.6.2.1. By Product Type

            13.6.2.2. By Application

    13.7. France

        13.7.1. Pricing Analysis

        13.7.2. Market Share Analysis, 2022

            13.7.2.1. By Product Type

            13.7.2.2. By Application

    13.8. Spain

        13.8.1. Pricing Analysis

        13.8.2. Market Share Analysis, 2022

            13.8.2.1. By Product Type

            13.8.2.2. By Application

    13.9. Italy

        13.9.1. Pricing Analysis

        13.9.2. Market Share Analysis, 2022

            13.9.2.1. By Product Type

            13.9.2.2. By Application

    13.10. China

        13.10.1. Pricing Analysis

        13.10.2. Market Share Analysis, 2022

            13.10.2.1. By Product Type

            13.10.2.2. By Application

    13.11. Japan

        13.11.1. Pricing Analysis

        13.11.2. Market Share Analysis, 2022

            13.11.2.1. By Product Type

            13.11.2.2. By Application

    13.12. South Korea

        13.12.1. Pricing Analysis

        13.12.2. Market Share Analysis, 2022

            13.12.2.1. By Product Type

            13.12.2.2. By Application

    13.13. Singapore

        13.13.1. Pricing Analysis

        13.13.2. Market Share Analysis, 2022

            13.13.2.1. By Product Type

            13.13.2.2. By Application

    13.14. Thailand

        13.14.1. Pricing Analysis

        13.14.2. Market Share Analysis, 2022

            13.14.2.1. By Product Type

            13.14.2.2. By Application

    13.15. Indonesia

        13.15.1. Pricing Analysis

        13.15.2. Market Share Analysis, 2022

            13.15.2.1. By Product Type

            13.15.2.2. By Application

    13.16. Australia

        13.16.1. Pricing Analysis

        13.16.2. Market Share Analysis, 2022

            13.16.2.1. By Product Type

            13.16.2.2. By Application

    13.17. New Zealand

        13.17.1. Pricing Analysis

        13.17.2. Market Share Analysis, 2022

            13.17.2.1. By Product Type

            13.17.2.2. By Application

    13.18. GCC Countries

        13.18.1. Pricing Analysis

        13.18.2. Market Share Analysis, 2022

            13.18.2.1. By Product Type

            13.18.2.2. By Application

    13.19. South Africa

        13.19.1. Pricing Analysis

        13.19.2. Market Share Analysis, 2022

            13.19.2.1. By Product Type

            13.19.2.2. By Application

    13.20. Israel

        13.20.1. Pricing Analysis

        13.20.2. Market Share Analysis, 2022

            13.20.2.1. By Product Type

            13.20.2.2. By Application

14. Market Structure Analysis

    14.1. Competition Dashboard

    14.2. Competition Benchmarking

    14.3. Market Share Analysis of Top Players

        14.3.1. By Regional

        14.3.2. By Product Type

        14.3.3. By Application

15. Competition Analysis

    15.1. Competition Deep Dive

        15.1.1. American Bath Group

            15.1.1.1. Overview

            15.1.1.2. Product Portfolio

            15.1.1.3. Profitability by Market Segments

            15.1.1.4. Sales Footprint

            15.1.1.5. Strategy Overview

                15.1.1.5.1. Marketing Strategy

                15.1.1.5.2. Product Strategy

                15.1.1.5.3. Channel Strategy

        15.1.2. American Standard Brands

            15.1.2.1. Overview

            15.1.2.2. Product Portfolio

            15.1.2.3. Profitability by Market Segments

            15.1.2.4. Sales Footprint

            15.1.2.5. Strategy Overview

                15.1.2.5.1. Marketing Strategy

                15.1.2.5.2. Product Strategy

                15.1.2.5.3. Channel Strategy

        15.1.3. Asahi Eito Co., Ltd.

            15.1.3.1. Overview

            15.1.3.2. Product Portfolio

            15.1.3.3. Profitability by Market Segments

            15.1.3.4. Sales Footprint

            15.1.3.5. Strategy Overview

                15.1.3.5.1. Marketing Strategy

                15.1.3.5.2. Product Strategy

                15.1.3.5.3. Channel Strategy

        15.1.4. Cera Sanitaryware Ltd.

            15.1.4.1. Overview

            15.1.4.2. Product Portfolio

            15.1.4.3. Profitability by Market Segments

            15.1.4.4. Sales Footprint

            15.1.4.5. Strategy Overview

                15.1.4.5.1. Marketing Strategy

                15.1.4.5.2. Product Strategy

                15.1.4.5.3. Channel Strategy

        15.1.5. Elkay Manufacturing Company

            15.1.5.1. Overview

            15.1.5.2. Product Portfolio

            15.1.5.3. Profitability by Market Segments

            15.1.5.4. Sales Footprint

            15.1.5.5. Strategy Overview

                15.1.5.5.1. Marketing Strategy

                15.1.5.5.2. Product Strategy

                15.1.5.5.3. Channel Strategy

        15.1.6. Geberit AG

            15.1.6.1. Overview

            15.1.6.2. Product Portfolio

            15.1.6.3. Profitability by Market Segments

            15.1.6.4. Sales Footprint

            15.1.6.5. Strategy Overview

                15.1.6.5.1. Marketing Strategy

                15.1.6.5.2. Product Strategy

                15.1.6.5.3. Channel Strategy

        15.1.7. Grohe AG

            15.1.7.1. Overview

            15.1.7.2. Product Portfolio

            15.1.7.3. Profitability by Market Segments

            15.1.7.4. Sales Footprint

            15.1.7.5. Strategy Overview

                15.1.7.5.1. Marketing Strategy

                15.1.7.5.2. Product Strategy

                15.1.7.5.3. Channel Strategy

        15.1.8. Hindustan Sanitaryware & Industries Ltd

            15.1.8.1. Overview

            15.1.8.2. Product Portfolio

            15.1.8.3. Profitability by Market Segments

            15.1.8.4. Sales Footprint

            15.1.8.5. Strategy Overview

                15.1.8.5.1. Marketing Strategy

                15.1.8.5.2. Product Strategy

                15.1.8.5.3. Channel Strategy

        15.1.9. Ideal Standard International

            15.1.9.1. Overview

            15.1.9.2. Product Portfolio

            15.1.9.3. Profitability by Market Segments

            15.1.9.4. Sales Footprint

            15.1.9.5. Strategy Overview

                15.1.9.5.1. Marketing Strategy

                15.1.9.5.2. Product Strategy

                15.1.9.5.3. Channel Strategy

        15.1.10. Jacuzzi, Inc

            15.1.10.1. Overview

            15.1.10.2. Product Portfolio

            15.1.10.3. Profitability by Market Segments

            15.1.10.4. Sales Footprint

            15.1.10.5. Strategy Overview

                15.1.10.5.1. Marketing Strategy

                15.1.10.5.2. Product Strategy

                15.1.10.5.3. Channel Strategy

16. Assumptions & Acronyms Used

17. Research Methodology

List of Tables

Table 1: Global Market Value (US$ Million) Forecast by Region, 2018 to 2033

Table 2: Global Market Volume (Units) Forecast by Region, 2018 to 2033

Table 3: Global Market Value (US$ Million) Forecast by Product Type, 2018 to 2033

Table 4: Global Market Volume (Units) Forecast by Product Type, 2018 to 2033

Table 5: Global Market Value (US$ Million) Forecast by Application, 2018 to 2033

Table 6: Global Market Volume (Units) Forecast by Application, 2018 to 2033

Table 7: North America Market Value (US$ Million) Forecast by Country, 2018 to 2033

Table 8: North America Market Volume (Units) Forecast by Country, 2018 to 2033

Table 9: North America Market Value (US$ Million) Forecast by Product Type, 2018 to 2033

Table 10: North America Market Volume (Units) Forecast by Product Type, 2018 to 2033

Table 11: North America Market Value (US$ Million) Forecast by Application, 2018 to 2033

Table 12: North America Market Volume (Units) Forecast by Application, 2018 to 2033

Table 13: Latin America Market Value (US$ Million) Forecast by Country, 2018 to 2033

Table 14: Latin America Market Volume (Units) Forecast by Country, 2018 to 2033

Table 15: Latin America Market Value (US$ Million) Forecast by Product Type, 2018 to 2033

Table 16: Latin America Market Volume (Units) Forecast by Product Type, 2018 to 2033

Table 17: Latin America Market Value (US$ Million) Forecast by Application, 2018 to 2033

Table 18: Latin America Market Volume (Units) Forecast by Application, 2018 to 2033

Table 19: Europe Market Value (US$ Million) Forecast by Country, 2018 to 2033

Table 20: Europe Market Volume (Units) Forecast by Country, 2018 to 2033

Table 21: Europe Market Value (US$ Million) Forecast by Product Type, 2018 to 2033

Table 22: Europe Market Volume (Units) Forecast by Product Type, 2018 to 2033

Table 23: Europe Market Value (US$ Million) Forecast by Application, 2018 to 2033

Table 24: Europe Market Volume (Units) Forecast by Application, 2018 to 2033

Table 25: Asia Pacific Market Value (US$ Million) Forecast by Country, 2018 to 2033

Table 26: Asia Pacific Market Volume (Units) Forecast by Country, 2018 to 2033

Table 27: Asia Pacific Market Value (US$ Million) Forecast by Product Type, 2018 to 2033

Table 28: Asia Pacific Market Volume (Units) Forecast by Product Type, 2018 to 2033

Table 29: Asia Pacific Market Value (US$ Million) Forecast by Application, 2018 to 2033

Table 30: Asia Pacific Market Volume (Units) Forecast by Application, 2018 to 2033

Table 31: MEA Market Value (US$ Million) Forecast by Country, 2018 to 2033

Table 32: MEA Market Volume (Units) Forecast by Country, 2018 to 2033

Table 33: MEA Market Value (US$ Million) Forecast by Product Type, 2018 to 2033

Table 34: MEA Market Volume (Units) Forecast by Product Type, 2018 to 2033

Table 35: MEA Market Value (US$ Million) Forecast by Application, 2018 to 2033

Table 36: MEA Market Volume (Units) Forecast by Application, 2018 to 2033

List of Charts

Figure 1: Global Market Value (US$ Million) by Product Type, 2023 to 2033

Figure 2: Global Market Value (US$ Million) by Application, 2023 to 2033

Figure 3: Global Market Value (US$ Million) by Region, 2023 to 2033

Figure 4: Global Market Value (US$ Million) Analysis by Region, 2018 to 2033

Figure 5: Global Market Volume (Units) Analysis by Region, 2018 to 2033

Figure 6: Global Market Value Share (%) and BPS Analysis by Region, 2023 to 2033

Figure 7: Global Market Y-o-Y Growth (%) Projections by Region, 2023 to 2033

Figure 8: Global Market Value (US$ Million) Analysis by Product Type, 2018 to 2033

Figure 9: Global Market Volume (Units) Analysis by Product Type, 2018 to 2033

Figure 10: Global Market Value Share (%) and BPS Analysis by Product Type, 2023 to 2033

Figure 11: Global Market Y-o-Y Growth (%) Projections by Product Type, 2023 to 2033

Figure 12: Global Market Value (US$ Million) Analysis by Application, 2018 to 2033

Figure 13: Global Market Volume (Units) Analysis by Application, 2018 to 2033

Figure 14: Global Market Value Share (%) and BPS Analysis by Application, 2023 to 2033

Figure 15: Global Market Y-o-Y Growth (%) Projections by Application, 2023 to 2033

Figure 16: Global Market Attractiveness by Product Type, 2023 to 2033

Figure 17: Global Market Attractiveness by Application, 2023 to 2033

Figure 18: Global Market Attractiveness by Region, 2023 to 2033

Figure 19: North America Market Value (US$ Million) by Product Type, 2023 to 2033

Figure 20: North America Market Value (US$ Million) by Application, 2023 to 2033

Figure 21: North America Market Value (US$ Million) by Country, 2023 to 2033

Figure 22: North America Market Value (US$ Million) Analysis by Country, 2018 to 2033

Figure 23: North America Market Volume (Units) Analysis by Country, 2018 to 2033

Figure 24: North America Market Value Share (%) and BPS Analysis by Country, 2023 to 2033

Figure 25: North America Market Y-o-Y Growth (%) Projections by Country, 2023 to 2033

Figure 26: North America Market Value (US$ Million) Analysis by Product Type, 2018 to 2033

Figure 27: North America Market Volume (Units) Analysis by Product Type, 2018 to 2033

Figure 28: North America Market Value Share (%) and BPS Analysis by Product Type, 2023 to 2033

Figure 29: North America Market Y-o-Y Growth (%) Projections by Product Type, 2023 to 2033

Figure 30: North America Market Value (US$ Million) Analysis by Application, 2018 to 2033

Figure 31: North America Market Volume (Units) Analysis by Application, 2018 to 2033

Figure 32: North America Market Value Share (%) and BPS Analysis by Application, 2023 to 2033

Figure 33: North America Market Y-o-Y Growth (%) Projections by Application, 2023 to 2033

Figure 34: North America Market Attractiveness by Product Type, 2023 to 2033

Figure 35: North America Market Attractiveness by Application, 2023 to 2033

Figure 36: North America Market Attractiveness by Country, 2023 to 2033

Figure 37: Latin America Market Value (US$ Million) by Product Type, 2023 to 2033

Figure 38: Latin America Market Value (US$ Million) by Application, 2023 to 2033

Figure 39: Latin America Market Value (US$ Million) by Country, 2023 to 2033

Figure 40: Latin America Market Value (US$ Million) Analysis by Country, 2018 to 2033

Figure 41: Latin America Market Volume (Units) Analysis by Country, 2018 to 2033

Figure 42: Latin America Market Value Share (%) and BPS Analysis by Country, 2023 to 2033

Figure 43: Latin America Market Y-o-Y Growth (%) Projections by Country, 2023 to 2033

Figure 44: Latin America Market Value (US$ Million) Analysis by Product Type, 2018 to 2033

Figure 45: Latin America Market Volume (Units) Analysis by Product Type, 2018 to 2033

Figure 46: Latin America Market Value Share (%) and BPS Analysis by Product Type, 2023 to 2033

Figure 47: Latin America Market Y-o-Y Growth (%) Projections by Product Type, 2023 to 2033

Figure 48: Latin America Market Value (US$ Million) Analysis by Application, 2018 to 2033

Figure 49: Latin America Market Volume (Units) Analysis by Application, 2018 to 2033

Figure 50: Latin America Market Value Share (%) and BPS Analysis by Application, 2023 to 2033

Figure 51: Latin America Market Y-o-Y Growth (%) Projections by Application, 2023 to 2033

Figure 52: Latin America Market Attractiveness by Product Type, 2023 to 2033

Figure 53: Latin America Market Attractiveness by Application, 2023 to 2033

Figure 54: Latin America Market Attractiveness by Country, 2023 to 2033

Figure 55: Europe Market Value (US$ Million) by Product Type, 2023 to 2033

Figure 56: Europe Market Value (US$ Million) by Application, 2023 to 2033

Figure 57: Europe Market Value (US$ Million) by Country, 2023 to 2033

Figure 58: Europe Market Value (US$ Million) Analysis by Country, 2018 to 2033

Figure 59: Europe Market Volume (Units) Analysis by Country, 2018 to 2033

Figure 60: Europe Market Value Share (%) and BPS Analysis by Country, 2023 to 2033

Figure 61: Europe Market Y-o-Y Growth (%) Projections by Country, 2023 to 2033

Figure 62: Europe Market Value (US$ Million) Analysis by Product Type, 2018 to 2033

Figure 63: Europe Market Volume (Units) Analysis by Product Type, 2018 to 2033

Figure 64: Europe Market Value Share (%) and BPS Analysis by Product Type, 2023 to 2033

Figure 65: Europe Market Y-o-Y Growth (%) Projections by Product Type, 2023 to 2033

Figure 66: Europe Market Value (US$ Million) Analysis by Application, 2018 to 2033

Figure 67: Europe Market Volume (Units) Analysis by Application, 2018 to 2033

Figure 68: Europe Market Value Share (%) and BPS Analysis by Application, 2023 to 2033

Figure 69: Europe Market Y-o-Y Growth (%) Projections by Application, 2023 to 2033

Figure 70: Europe Market Attractiveness by Product Type, 2023 to 2033

Figure 71: Europe Market Attractiveness by Application, 2023 to 2033

Figure 72: Europe Market Attractiveness by Country, 2023 to 2033

Figure 73: Asia Pacific Market Value (US$ Million) by Product Type, 2023 to 2033

Figure 74: Asia Pacific Market Value (US$ Million) by Application, 2023 to 2033

Figure 75: Asia Pacific Market Value (US$ Million) by Country, 2023 to 2033

Figure 76: Asia Pacific Market Value (US$ Million) Analysis by Country, 2018 to 2033

Figure 77: Asia Pacific Market Volume (Units) Analysis by Country, 2018 to 2033

Figure 78: Asia Pacific Market Value Share (%) and BPS Analysis by Country, 2023 to 2033

Figure 79: Asia Pacific Market Y-o-Y Growth (%) Projections by Country, 2023 to 2033

Figure 80: Asia Pacific Market Value (US$ Million) Analysis by Product Type, 2018 to 2033

Figure 81: Asia Pacific Market Volume (Units) Analysis by Product Type, 2018 to 2033

Figure 82: Asia Pacific Market Value Share (%) and BPS Analysis by Product Type, 2023 to 2033

Figure 83: Asia Pacific Market Y-o-Y Growth (%) Projections by Product Type, 2023 to 2033

Figure 84: Asia Pacific Market Value (US$ Million) Analysis by Application, 2018 to 2033

Figure 85: Asia Pacific Market Volume (Units) Analysis by Application, 2018 to 2033

Figure 86: Asia Pacific Market Value Share (%) and BPS Analysis by Application, 2023 to 2033

Figure 87: Asia Pacific Market Y-o-Y Growth (%) Projections by Application, 2023 to 2033

Figure 88: Asia Pacific Market Attractiveness by Product Type, 2023 to 2033

Figure 89: Asia Pacific Market Attractiveness by Application, 2023 to 2033

Figure 90: Asia Pacific Market Attractiveness by Country, 2023 to 2033

Figure 91: MEA Market Value (US$ Million) by Product Type, 2023 to 2033

Figure 92: MEA Market Value (US$ Million) by Application, 2023 to 2033

Figure 93: MEA Market Value (US$ Million) by Country, 2023 to 2033

Figure 94: MEA Market Value (US$ Million) Analysis by Country, 2018 to 2033

Figure 95: MEA Market Volume (Units) Analysis by Country, 2018 to 2033

Figure 96: MEA Market Value Share (%) and BPS Analysis by Country, 2023 to 2033

Figure 97: MEA Market Y-o-Y Growth (%) Projections by Country, 2023 to 2033

Figure 98: MEA Market Value (US$ Million) Analysis by Product Type, 2018 to 2033

Figure 99: MEA Market Volume (Units) Analysis by Product Type, 2018 to 2033

Figure 100: MEA Market Value Share (%) and BPS Analysis by Product Type, 2023 to 2033

Figure 101: MEA Market Y-o-Y Growth (%) Projections by Product Type, 2023 to 2033

Figure 102: MEA Market Value (US$ Million) Analysis by Application, 2018 to 2033

Figure 103: MEA Market Volume (Units) Analysis by Application, 2018 to 2033

Figure 104: MEA Market Value Share (%) and BPS Analysis by Application, 2023 to 2033

Figure 105: MEA Market Y-o-Y Growth (%) Projections by Application, 2023 to 2033

Figure 106: MEA Market Attractiveness by Product Type, 2023 to 2033

Figure 107: MEA Market Attractiveness by Application, 2023 to 2033

Figure 108: MEA Market Attractiveness by Country, 2023 to 2033

Recommendations

Technology

LED Displays, Lighting and Fixtures Market

Published : March 2023

Industrial Automation

Railway Track Fittings Market

Published : February 2023

Industrial Automation

Oil and Gas Fittings Market

Published : July 2022

Explore Industrial Automation Insights

View Reports

Plumbing Fitting & Fixtures Market