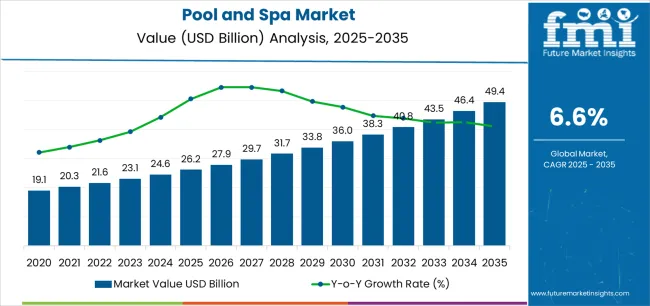
The Pool and Spa Market is estimated to be valued at USD 26.2 billion in 2025 and is projected to reach USD 49.4 billion by 2035, registering a compound annual growth rate (CAGR) of 6.6% over the forecast period.
The pool and spa market is expanding steadily, supported by rising consumer inclination toward wellness, hydrotherapy, and outdoor leisure activities. Growth is driven by increasing disposable incomes, the proliferation of residential pools and spas, and rising demand for health-oriented relaxation facilities. The market benefits from technological advancements in water purification, heating systems, and energy-efficient pumps that enhance the overall user experience.
Expanding commercial infrastructure, including resorts and fitness centers, further contributes to market development. Consumers are increasingly opting for customizable spa and pool solutions emphasizing aesthetics and convenience.
Environmental awareness has also LED to the integration of eco-friendly materials and water-saving technologies. With growing emphasis on luxury living and health-based recreation, the global pool and spa market is projected to maintain robust growth momentum across residential and commercial sectors.
| Metric | Value |
|---|---|
| Pool and Spa Market Estimated Value in (2025 E) | USD 26.2 billion |
| Pool and Spa Market Forecast Value in (2035 F) | USD 49.4 billion |
| Forecast CAGR (2025 to 2035) | 6.6% |
The market is segmented by Type, Accessories, and Material and region. By Type, the market is divided into Spas and Pools. In terms of Accessories, the market is classified into Filters, Chlorinators, Blowers, Cleaners, Covers, Suction Fittings, Pool Pumps, and Others. Based on Material, the market is segmented into Fiberglass, Plastic, Rubber, Stainless Steel, and Others. Regionally, the market is classified into North America, Latin America, Western Europe, Eastern Europe, Balkan & Baltic Countries, Russia & Belarus, Central Asia, East Asia, South Asia & Pacific, and the Middle East & Africa.
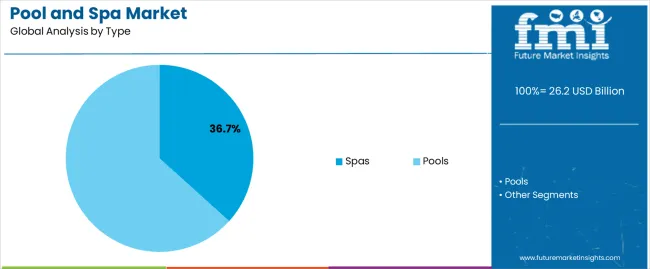
The spas segment leads the type category in the pool and spa market, holding approximately 36.7% share. This dominance is attributed to increasing adoption of spa facilities for relaxation, therapy, and wellness purposes. Rising health awareness and the growing influence of wellness tourism have significantly boosted spa installations across homes, hotels, and health centers.
Technological innovations such as automated controls, improved heating systems, and advanced filtration enhance spa functionality and user comfort. The segment’s growth is further supported by the rising popularity of compact, portable spa units suitable for residential applications.
Demand for hydrotherapy-based wellness treatments has also increased, reinforcing spa utilization across diverse consumer demographics. With continuous investment in energy-efficient and smart spa solutions, the segment is expected to retain its strong position throughout the forecast period.
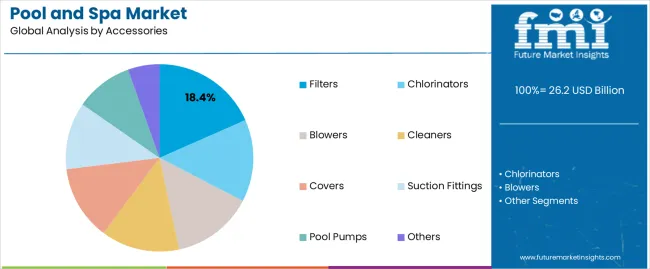
The filters segment holds approximately 18.4% share in the accessories category, reflecting its critical role in maintaining water clarity and hygiene. Growing awareness regarding water quality and safety has increased the demand for efficient filtration systems in both pools and spas.
Filters are integral to removing debris, contaminants, and microorganisms, ensuring optimal water circulation and reduced maintenance efforts. Market growth is reinforced by the adoption of automated and smart filtration systems that enhance energy efficiency and operational lifespan.
Manufacturers are increasingly focusing on innovations in cartridge and sand filters to improve performance and lower operational costs. With expanding residential installations and regulatory emphasis on water sanitation, the filters segment is expected to witness steady growth, supporting the overall sustainability of pool and spa systems.
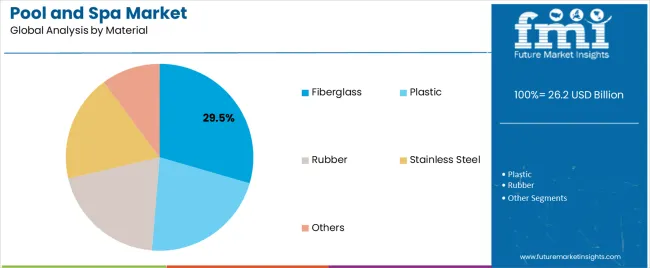
The fiberglass segment dominates the material category, accounting for approximately 29.5% of the pool and spa market. Its leadership is driven by superior durability, low maintenance, and faster installation compared to traditional materials such as concrete. Fiberglass pools and spas offer smooth, nonporous surfaces that resist algae growth and chemical wear, enhancing longevity.
The segment benefits from the growing preference for prefabricated, customizable designs that minimize construction time. Cost-effectiveness over the long term, coupled with minimal maintenance requirements, has strengthened its adoption among residential users.
Increasing use of advanced resins and composite materials to improve strength and thermal efficiency further supports growth. With aesthetic versatility and high return on investment, the fiberglass segment is projected to maintain dominance across modern pool and spa installations.
The scope for pool and spa rose at an 8.5% CAGR between 2020 and 2025. The global market is anticipated to grow at a moderate CAGR of 6.9% over the forecast period 2025 to 2035. The market experienced steady growth during the historical period from 2020 to 2025, driven by economic growth.
The global economy experienced moderate growth during this period, contributing to increased consumer spending on discretionary items like pools and spas.
Consumers had more financial resources to invest in home improvement projects and leisure amenities, as household incomes rose in many regions. Growing interest in health and wellness activities spurred demand for spas and hydrotherapy facilities, as consumers sought relaxation and stress relief.
Looking ahead to the forecast period from 2025 to 2035, the market is expected to witness significant growth. Changing consumer demographics and lifestyle preferences will shape demand for customized pool and spa designs, with an emphasis on multi-functional spaces and eco-friendly features.
Advancements in technology, including AI driven automation, virtual reality, and augmented reality applications, will revolutionize the design, construction, and maintenance of pools and spas, offering enhanced user experiences and operational efficiency.
Stringent regulations and safety standards will influence product design and installation practices, requiring industry stakeholders to prioritize compliance and risk management.
Collaboration between industry stakeholders, including manufacturers, designers, contractors, and regulatory authorities, will drive innovation, standardization, and best practices in the pool and spa market.
There is a growing trend towards wellness and leisure activities. Pools and spas are seen as elements of relaxation and recreation, fitting well with modern lifestyles where people seek ways to de stress and unwind.
The upfront cost of installing a pool or spa can be prohibitive for many consumers. The expense associated with excavation, construction, equipment, and landscaping may deter potential buyers, especially in regions with lower household incomes or stringent budget constraints.
The below table showcases revenues in terms of the top 5 leading countries, spearheaded by the United Kingdom and China. The countries are expected to lead the market through 2035.
| Countries | Forecast CAGRs from 2025 to 2035 |
|---|---|
| The United States | 7.2% |
| China | 7.8% |
| The United Kingdom | 8.3% |
| Japan | 5.2% |
| Korea | 4.0% |
The pool and spa market in the United States expected to expand at a CAGR of 7.2% through 2035. The strength of the housing market influences demand for pools and spas.
Homeowners are more likely to invest in backyard enhancements, including pools and spa installations, to increase property value and enhance outdoor living spaces, as home values rise and new construction projects increase.
Americans prioritize outdoor living and leisure activities, making pools and spas desirable additions to residential properties. Pools and spas offer opportunities for families and individuals to enjoy quality time outdoors and improve their overall well being, with a focus on wellness, relaxation, and entertainment.
The pool and spa market in the United Kingdom is anticipated to expand at a CAGR of 8.3% through 2035. The wellness trend is gaining traction in the country, with consumers seeking ways to improve their physical and mental well-being. Spas offer relaxation, stress relief, and therapeutic treatments, aligning with the growing emphasis on self-care and holistic wellness practices.
The United Kingdom attracts domestic and international tourists seeking leisure and recreation opportunities. Hotels, resorts, and holiday accommodations with pool and spa facilities appeal to travelers, driving demand for commercial spa installations and contributing to the growth of the hospitality sector.
Pool and spa trends in China are taking a turn for the better. A 7.8% CAGR is forecast for the country from 2025 to 2035. The development of luxury residential properties, resorts, and mixed use developments in China includes the integration of pool and spa facilities as premium amenities.
Developers incorporate pools, hot tubs, and wellness centers into residential complexes to attract high end buyers and enhance property values.
Government initiatives aimed at promoting domestic consumption and boosting the tourism industry contribute to the growth of the pool and spa market in China. Policies supporting leisure and recreational infrastructure development create opportunities for businesses in the pool and spa sector to expand their market presence.
The pool and spa market in Japan is poised to expand at a CAGR of 5.2% through 2035. The traditional onsen culture in country has deep historical and cultural roots.
Onsen resorts and hot spring towns attract visitors seeking natural mineral baths and therapeutic experiences. The integration of modern spa amenities with traditional onsen practices appeals to a wide range of visitors.
Japanese consumers are increasingly health conscious and seek out activities and products that promote physical and mental well-being. Spas and hydrotherapy treatments are viewed as beneficial for relieving stress, improving circulation, and alleviating muscle tension.
The pool and spa market in Korea is anticipated to expand at a CAGR of 8.9% through 2035. The Korean families prioritize spending quality time together and engaging in shared activities.
Pools and spas provide opportunities for family bonding, recreation, and outdoor entertainment, making them desirable additions to residential properties and community centers.
Koreans value outdoor recreation and sports activities as part of a healthy lifestyle. Pools and spas offer opportunities for swimming, water sports, and aquatic fitness programs, catering to enthusiasts and athletes seeking training facilities, leisure centers, and competitive venues.
The below table highlights how spas segment is projected to lead the market in terms of type, and is expected to account for a CAGR of 6.6% through 2035. Based on accessories, the filters segment is expected to account for a CAGR of 6.3% through 2035.
| Category | CAGR from 2025 to 2035 |
|---|---|
| Spas | 6.6% |
| Filters | 6.3% |
Based on type, the spas segment is expected to continue dominating the pool and spa market. Increasing awareness of the health benefits associated with spa treatments drives demand for spa facilities and equipment.
Consumers seek relaxation, stress relief, and therapeutic benefits offered by steam baths, saunas, and hydromassage bathtubs to alleviate muscle tension, improve circulation, and promote overall well being.
The trend towards creating spa like experiences at home drives demand for electric spas, hydromassage bathtubs, and sauna rooms. Homeowners seek to transform their bathrooms or outdoor spaces into personal wellness retreats, investing in spa equipment and amenities for daily relaxation and rejuvenation.
In terms of accessories, the filters segment is expected to continue dominating the pool and spa market. Consumers prioritize water quality and hygiene when maintaining their pools and spas.
Filters play a crucial role in removing impurities, debris, and contaminants from the water, ensuring clarity, cleanliness, and safety for swimmers. The demand for high quality filtration systems grows, as awareness of waterborne illnesses and health risks increases.
Proper filtration is essential for the longevity and performance of pool and spa equipment. Filters prevent debris and particles from clogging pipes, pumps, and other components, reducing the risk of damage, corrosion, and operational inefficiencies.
Regular filter maintenance and replacement extend the lifespan of equipment and minimize repair costs over time.
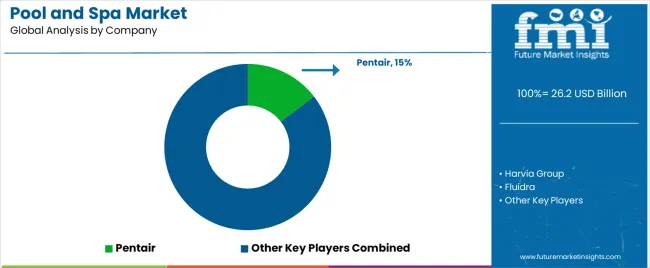
The competitive landscape of the pool and spa market is characterized by a diverse array of players, including manufacturers, distributors, retailers, service providers, and contractors.
The pool and spa market attracts both established companies and niche players seeking to capitalize on consumer demand for leisure amenities, wellness solutions, and outdoor living spaces.
Company Portfolio
| Attribute | Details |
|---|---|
| Estimated Market Size in 2025 | USD 26.2 billion |
| Projected Market Valuation in 2035 | USD 49.4 billion |
| Value-based CAGR 2025 to 2035 | 6.6% |
| Forecast Period | 2025 to 2035 |
| Historical Data Available for | 2020 to 2025 |
| Market Analysis | Value in USD billion |
| Key Regions Covered | North America; Latin America; Western Europe; Eastern Europe; South Asia and Pacific; East Asia; The Middle East & Africa |
| Key Market Segments Covered | Type, Accessories, Material, Region |
| Key Countries Profiled | The United States, Canada, Brazil, Mexico, Germany, France, France, Spain, Italy, Russia, Poland, Czech Republic, Romania, India, Bangladesh, Australia, New Zealand, China, Japan, South Korea, GCC countries, South Africa, Israel |
| Key Companies Profiled | Harvia Group; Pentair; Fluidra; KLAFS GmbH & Co. KG; TyloHelo; Kohler Co.; Arctic Spas; Roca; Jaquar; Bullfrog Spas |
The global pool and spa market is estimated to be valued at USD 26.2 billion in 2025.
The market size for the pool and spa market is projected to reach USD 49.4 billion by 2035.
The pool and spa market is expected to grow at a 6.6% CAGR between 2025 and 2035.
The key product types in pool and spa market are spas, _electric spas, _steam baths, _saunas, _hydromassage bathtubs, pools, _lap pools, _wading pools, _heated pools and _others.
In terms of accessories, filters segment to command 18.4% share in the pool and spa market in 2025.


Full Research Suite comprises of:
Market outlook & trends analysis
Interviews & case studies
Strategic recommendations
Vendor profiles & capabilities analysis
5-year forecasts
8 regions and 60+ country-level data splits
Market segment data splits
12 months of continuous data updates
DELIVERED AS:
PDF EXCEL ONLINE
Carpool As A Service Market Size and Share Forecast Outlook 2025 to 2035
Pallet Pooling Market Growth – Trends & Forecast 2024-2034
Swimming Pool Accessories Market Size and Share Forecast Outlook 2025 to 2035
Motorized Pool Tube Market Size and Share Forecast Outlook 2025 to 2035
Medical Whirlpool Market
Solar Floating Pool Lights Market Insights – Trends, Demand & Growth 2025-2035
Portable & Inflatable Swimming Pool Market Trends - Growth & Demand to 2025 to 2035
Anderson Cascade Impactor Market Size and Share Forecast Outlook 2025 to 2035
Andersen-Tawil Syndrome Treatment Market Trends - Growth & Future Prospects 2025 to 2035
Andro Supplements Market
Handheld Imaging Systems Market Size and Share Forecast Outlook 2025 to 2035
Sandwich Panel System Market Size and Share Forecast Outlook 2025 to 2035
Hand Tools Market Size and Share Forecast Outlook 2025 to 2035
Land Survey Equipment Market Size and Share Forecast Outlook 2025 to 2035
Handloom Product Market Size and Share Forecast Outlook 2025 to 2035
Band File Sander Belts Market Size and Share Forecast Outlook 2025 to 2035
Handheld XRF Analyzers Market Size and Share Forecast Outlook 2025 to 2035
Sand Abrasion Tester Market Size and Share Forecast Outlook 2025 to 2035
Sand Testing Equipments Market Size and Share Forecast Outlook 2025 to 2035
Landscape Lighting Market Size and Share Forecast Outlook 2025 to 2035

Thank you!
You will receive an email from our Business Development Manager. Please be sure to check your SPAM/JUNK folder too.
Chat With
MaRIA