
- Market Size (2026)
- USD 414.2 Mn
- Forecast (2036)
- USD 980.6 Mn
- CAGR (2026 to 2036)
- 9.0%
How big is the Popping Boba Market in 2026?
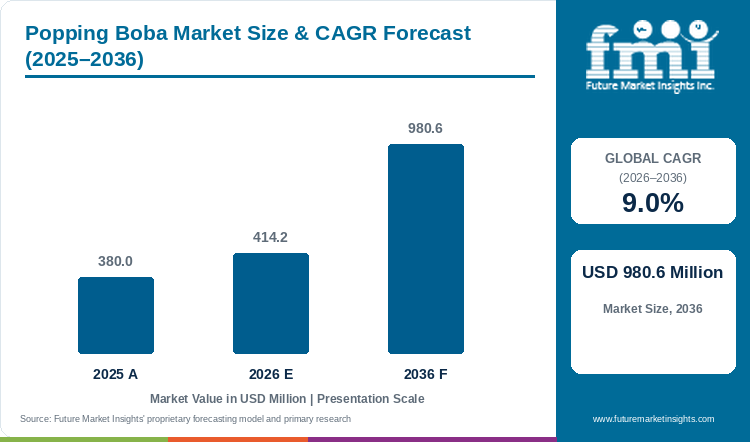
The global popping boba market is on course to reach USD 980.6 million by 2036, a CAGR of 9.0% from 2026 to 2036. The market was valued at USD 380.0 million in 2025 and is estimated at USD 414.2 million in 2026.
Popping Boba Market Size and Forecast
Table 1: Popping Boba Market Size and Forecast
| Market size and forecast | Value |
|---|---|
| Market size in 2025 | USD 380.0 million |
| Estimated market size in 2026 | USD 414.2 million |
| Projected market size by 2036 | USD 980.6 million |
| CAGR from 2026 to 2036 | 9.0% |
Source: Future Market Insights analysis of the popping boba market, 2026.
Menu breadth is a more useful competitive measure than the number of familiar fruit flavours. Bossen's current collection separates higher-juice pearls from original, sour, energy, exotic and small-container offers. Those choices give distributors different ways to sell into a shop's topping budget. The commercial challenge is securing repeat orders after the first promotional menu has ended. A pearl that sells slowly occupies refrigerator space and ties up cash in an opened tub.
Fruit innovation is also widening the list of possible competitors for an operator's next drink launch. On 14 January 2026, Kerry introduced a digital version of its Global Taste Charts with direct sample ordering through KerryNow. The tool reduces the effort needed to test alternative beverage concepts. Pearl specialists need evidence of finished-drink acceptance alongside a broad catalogue. The strongest offer pairs a distinctive topping with an appropriate pack size and a reproducible serving specification. That purchasing decision sits within the broader bubble tea market.
Key Market Trends & Insights
- Assortment planning extends beyond flavour to pack size. Tea Zone's range includes bulk jars alongside smaller packs, so the amount an individual outlet can use economically matters.
- Open-container turnover is a purchasing consideration separate from unopened shelf life. Bossen specifies refrigeration after opening for its Strawberry Pure25 product and recommends consumption within one week.
- Japan's revised food-contact positive-list system applies to designated synthetic-resin materials. Packaging conformity can determine which pearl container is suitable for an export programme even when the food recipe stays the same.
Regional Highlights
- Vietnam, Indonesia and the United Kingdom are gaining share of global revenue. FMI's 2036 shares are Vietnam 5.3% (from 4.0%), Indonesia 6.0% (from 5.0%) and the United Kingdom 3.3% (from 3.0%).
- Share slips for Taiwan, Japan and South Korea as revenue grows. FMI projects Taiwan at 6.1% against 8.0% in 2026, Japan at 5.0% against 6.0% in 2026 and South Korea at 4.6% against 5.0% in 2026 by 2036.
Analyst Perspective
“Repeat purchase will depend on how well a pearl assortment fits an outlet's actual serving pattern. More flavours can win the initial listing, but pack turnover and consistency decide whether the listing lasts. Suppliers have a stronger commercial case when they show how a new pearl performs in the operator's chosen drink and delivery format.”
- Nandini Roy Choudhury, Principal Analyst at Future Market Insights
How is the Popping Boba Market segmented?
- By flavour: Strawberry, Mango, Lychee, Passion Fruit, Blueberry, and Others.
- By end use: Bubble Tea Shops, Dessert and Frozen Yogurt Outlets, Beverage Brands and Cafes, and Home and Retail.
- By pack format: Bulk Foodservice Tubs and Jars, Retail Pouches and Jars, and Single-Serve Cups.
- By region: East Asia, Southeast Asia, North America, Western Europe, and Rest of world.
Why does the Strawberry segment lead by Flavour in the Popping Boba Market in 2026?
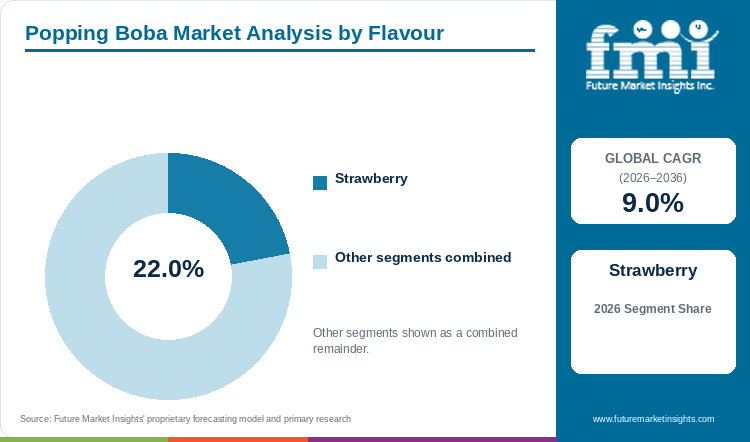
The Strawberry segment holds 22.0% of the Popping Boba Market by flavour in 2026.
Strawberry holds 22.0% of the Popping Boba Market by flavour in 2026 and leads the individually named flavours. The combined Others category is larger at 26.0%, but it aggregates many choices that do not share one purchasing pattern, so Strawberry is the single flavour a supplier can plan around. One supplier identifies Taiwan as the origin of its Strawberry Pure25 product, which shows that the flavour is supplied as a distinct, specified line.
The wider assortment competes collectively with this core line. Tea Zone lists options such as rose, honey and brown sugar alongside its fruit range. A specialist flavour needs enough repeat demand to justify manufacturing and distribution through the same network.
FMI projects Strawberry at 20.0% by 2036, while Others reaches 28.4%. Strawberry remains a reference line for operators assessing a new topping. Broader beverage flavouring market choices compete for the same development time, so assortment growth needs a clear role in the finished menu. Short menu trials can generate orders without creating a durable category, so suppliers need to judge which flavours earn a permanent listing.
Mango, Lychee, Passion Fruit, Blueberry and Others together hold the remaining 78.0% by flavour.
Table 2: Flavour, 2026 Share
| Leading Share | 2026 market share |
|---|---|
| Strawberry | 22.0% |
| All Other Segments Combined Share | 78.0% |
Source: Future Market Insights analysis of the popping boba market, 2026.
Why does the Bubble Tea Shops segment lead by End Use in the Popping Boba Market in 2026?
The Bubble Tea Shops segment holds 56.0% of the Popping Boba Market by end use in 2026.
Specialist tea outlets concentrate topping decisions within a menu already organised around combinations of bases, flavours and inclusions. One supplier's current catalogue combines pearls with tea, powders, syrups, utensils and beverage equipment. For a distributor, that breadth creates an opportunity to sell the topping within an existing ingredient order.
Bubble Tea Shops generate USD 232.0 million of 2026 revenue in the FMI assessment. Demand reaches USD 537.8 million by 2036 despite the modest reduction in share. Beverage Brands and Cafes and Home and Retail expand from smaller bases. Those channels may use a different pack or service routine from specialist shops.
Dessert and Frozen Yogurt Outlets hold 22.0% in 2026. Their relevance is supported by suppliers explicitly offering pearls for dessert applications. The adjacent frozen yogurt market brings a different display and serving context. Suppliers entering it need to demonstrate topping integrity during service.
Dessert and Frozen Yogurt Outlets, Beverage Brands and Cafes and Home and Retail together hold the remaining 44.0% by end use.
Table 3: End Use, 2026 Share
| Leading Share | 2026 market share |
|---|---|
| Bubble Tea Shops | 56.0% |
| All Other Segments Combined Share | 44.0% |
Source: Future Market Insights analysis of the popping boba market, 2026.
Why does the Bulk Foodservice Tubs and Jars segment lead by Pack Format in the Popping Boba Market in 2026?
The Bulk Foodservice Tubs and Jars segment holds 60.0% of the Popping Boba Market by pack format in 2026.
Bulk foodservice packs lead because bubble tea shops, the main end use at 56.0%, buy popping boba in quantities sized to a shop's daily topping use. One supplier's range includes bulk jars alongside smaller packs, which shows that sellers already separate the same product by pack size. A shop operator compares cost per serving and waste once a jar is opened, so pack size sets the economic comparison as much as flavour does.
Retail and single-serve formats serve a different buyer. Home and retail customers buy small quantities at higher unit prices, and packaging must satisfy consumer labelling and food-contact rules.
FMI's 2026 assessment values Bulk Foodservice Tubs and Jars at USD 248.5 million. Growth in retail and single-serve packs would reduce this share without lowering bulk revenue. Suppliers should price the formats separately, because a shop jar and a retail pouch carry different packaging cost per serving.
Retail Pouches and Jars and Single-Serve Cups together hold the remaining 40.0% by pack format.
Table 4: Pack Format, 2026 Share
| Leading Share | 2026 market share |
|---|---|
| Bulk Foodservice Tubs and Jars | 60.0% |
| All Other Segments Combined Share | 40.0% |
Source: Future Market Insights analysis of the popping boba market, 2026.
What are the key drivers restraints and opportunities?
Repeat menu placement drives pearl orders. Slow open-pack turnover restrains assortment breadth, while channel-specific packs and differentiated flavours offer room for additional sales.
Driver
Inclusion in a recurring tea or dessert order creates repeat ingredient demand beyond a single promotional drink.
Restraint
Each additional opened flavour requires stock rotation and handling that must be justified by outlet sales.
Opportunity
Matching a distinctive pearl to a suitable pack and a tested beverage application can open business outside specialist bubble tea shops.
How do purchasing rules and qualification affect popping boba market demand?
A promotional topping becomes valuable when an operator can keep it on the menu without increasing waste or slowing preparation. In FMI's view, the growth opportunity depends on converting initial consumer interest into repeat listings. This favours suppliers that can support the buyer through a full trial cycle, including taste assessment after the drink has stood for its expected service period.
The product should also have a defined place within the menu. A sour pearl may be sold as a contrasting inclusion, whereas a fruit pearl may reinforce the base flavour. A separate sour collection from one supplier shows that acidity is already used as a point of product differentiation. Expansion into cafés will depend on whether the topping fits the operator's existing preparation process and price position.
What limits reliable popping boba market supply and quality?
The principal commercial risk is ordering more variety than an outlet can turn over. The Strawberry Pure25 page separates an 18-month shelf life from its refrigerated after-opening guidance. Comparing suppliers only on the longest shelf-life claim would miss that distinction.
A recipe substitution also has wider consequences than taste. Different colours, sweeteners or preservatives can change destination-country review and labelling needs. China's GB 2760-2024 is a national standard for food additive use. Product classification and the actual formulation must be checked for the intended sale.
Where can suppliers win additional business in the popping boba market?
Small-container ranges offer a route into occasional use without requiring an outlet to hold a bulk jar of every flavour. The opportunity is to increase the number of commercially viable listings, not simply to reduce pack size. Larger customers may still prefer bulk formats when throughput supports them.
Takeaway presentation also deserves a joint test of the pearl, cup and serving method. Japan's positive-list framework provides one example of a separate materials requirement. The wider compostable foodservice packaging market affects serviceware choices, but the final container still needs to suit the food and the destination's rules. Suppliers that provide usable application information can reduce the number of trials required before a buyer makes a permanent listing decision.
Popping Boba Market by Country (2026 to 2036)
Table 5: Popping Boba Market Country Growth Forecast
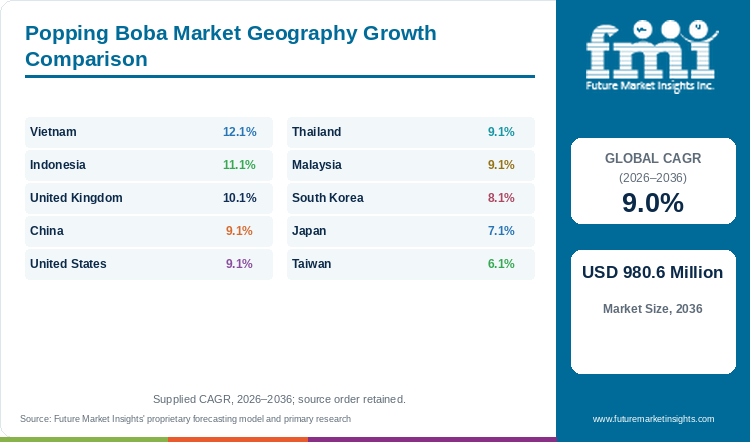
| Country | CAGR, 2026 to 2036 |
|---|---|
| Vietnam | 12.1% |
| Indonesia | 11.1% |
| United Kingdom | 10.1% |
| China | 9.1% |
| United States | 9.1% |
| Thailand | 9.1% |
| Malaysia | 9.1% |
| South Korea | 8.1% |
| Japan | 7.1% |
| Taiwan | 6.1% |
Source: Future Market Insights analysis of the popping boba market, 2026.
Vietnam
Recent changes in food import procedures make regulatory continuity a material part of Vietnam's sales opportunity. On 6 April 2026, the government extended the suspension of Decree 46 and the related product-registration resolution until revised food safety legislation and implementing rules take effect. Its official account states that Decree 15/2018 and associated guidance continue during the suspension. The announcement followed difficulties in implementation. It provides a concrete reason to review the applicable procedure before scheduling an import programme.
Vietnam is the fastest-growing named country in FMI's popping boba outlook. Revenue increases from USD 16.6 million in 2026 to USD 51.9 million by 2036, with a 12.1% CAGR across 2026 to 2036. The USD 35.3 million rise over the decade ranks Vietnam fourth for increase. Revenue in Vietnam multiplies 3.1 times by 2036, compared with 2.4 times worldwide.
FMI sees an advantage for distributors that keep the selling programme aligned with the current import process. A customer offered a new menu inclusion needs confidence that replenishment will follow the initial delivery. Suppliers should avoid building a large promotional assortment before they understand which products can be supported consistently. This is particularly relevant when several flavours differ in their ingredient information. The strongest growth proposition is a smaller number of repeatable listings that can broaden as actual demand becomes clear.
Indonesia
Indonesia has one of the stronger expansion rates in the FMI outlook. Popping boba revenue rises from USD 20.7 million in 2026 to USD 59.3 million by 2036, with a CAGR of 11.1% from 2026 to 2036. For an ingredient seller, that raises a practical question: how much of the range can be supported through a repeatable import and sales programme as orders become larger?
The timetable for preparing that programme changed in October 2026. Australian government guidance records the postponement of expanded mandatory halal certification for imported food and beverages to 18 October 2028. It also records the revocation of the associated pre-shipment inspection requirement. The change gives exporters more preparation time. Treating the earlier October 2026 deadline as still operative would also misstate the immediate purchasing environment.
FMI expects the most durable sales programmes to develop customer acceptance and product documentation together. A flavour portfolio has to remain manageable for the importer as well as attractive on a menu. Buyers need to know what each product contains and which manufacturing arrangement it follows. Completing that work before a deadline approaches reduces the risk of interrupting a range that has already won regular orders. The higher forecast growth still depends on the finished drink selling repeatedly at a viable price. Certification preparation and underlying consumer demand answer different parts of the commercial case.
United Kingdom
The United Kingdom's advertising restrictions create a distinction between a product's sale and the way it can be promoted. Government guidance states that restrictions on identifiable less healthy food and drink advertising came into force on 5 January 2026. The rules include an online paid-advertising restriction and a television watershed, with scope and exemptions determined by the legislation. A pearl-containing drink must be assessed under the relevant definitions. The rules do not amount to a blanket ban on popping boba.
FMI expects United Kingdom revenue to increase from USD 12.4 million in 2026 to USD 32.5 million in 2036. A 10.1% CAGR from 2026 to 2036 places growth above the global rate despite the smaller starting base. The commercial task is to build a product and promotional approach that remains viable after the first period of curiosity. Revenue in the United Kingdom multiplies 2.6 times by 2036, compared with 2.4 times worldwide.
For a supplier, flavour is only one component of the finished drink. The beverage base and the serving amount also influence its overall composition. This makes it useful to evaluate the complete menu item before committing to a national promotional programme. FMI expects application support to have more value when it helps the operator understand those choices with accurate product information. Claims of reduced sugar or natural ingredients need to match the actual recipe.
China
China's commercial importance comes from the size of its revenue base and the need to maintain a consistent specification across repeat ingredient purchases. FMI assigns the country USD 91.1 million of popping boba revenue in 2026, representing 22.0% of the global market. A 9.1% CAGR from 2026 to 2036 takes revenue to USD 217.6 million. This is the largest named national market in the assessment. China grows at 9.1% a year, 0.1 points faster than the global rate.
Food formulation is an important boundary for suppliers seeking that business. The National Health Commission and the State Administration for Market Regulation issued GB 2760-2024 among a group of national food safety standards in their February 2024 announcement. That establishes the relevant additive-use framework. Buyers need to review the finished product's classification and ingredient specification before placing a recurring order.
FMI expects larger purchase programmes to favour consistency within the approved recipe. An inexpensive flavour change loses its appeal if it forces the buyer to repeat its technical review or revise product information. Suppliers should separate a stable core range from new flavours undergoing commercial trials. This also makes it easier to compare repeat demand with launch-related orders. The main sales opportunity lies in retaining well-performing listings across successive menu cycles instead of assuming that all of China's prepared-tea sales translate into popping boba demand.
United States
The United States offers a route through established specialty ingredient distributors instead of only through new tea-shop openings. Two suppliers each publish broad pearl assortments directed to beverage and dessert users. This makes assortment availability visible, while leaving the success of each outlet's menu to be demonstrated commercially. FMI forecasts a CAGR of 9.1% for the United States between 2026 and 2036. Revenue rises from USD 66.3 million to USD 158.3 million. The United States records a USD 92.0 million increase, second of the ten.
Import responsibility gives the distributor a role beyond holding local stock. FDA's Foreign Supplier Verification Programs guidance explains obligations intended to ensure that imported food meets applicable United States requirements and is not adulterated or misbranded with respect to allergen labelling. Pearl buyers therefore need to understand which business owns the import and verification responsibilities.
For the supplier, an approved import and distribution arrangement can support several types of account. A specialist tea shop may buy a core fruit range repeatedly. A café testing a seasonal drink may need a much narrower assortment. Those customers should not receive identical stocking recommendations. FMI's view is that the additional national revenue will depend partly on matching availability to outlet throughput. A distributor able to replenish a proven flavour promptly has a different offer from one that simply advertises the longest list of choices.
Thailand
In Thailand, the decision to keep an additional pearl flavour should turn on reorders across a distributor's service route. Initial samples can attract interest without generating enough continuing sales to support permanent stock. FMI expects national revenue to rise from USD 20.7 million to USD 49.5 million between 2026 and 2036. The projected 9.1% CAGR from 2026 to 2036 creates room for a broader business, but each new item still needs a viable role within it.
A limited promotional range may work when it travels with an established ingredient order. A slow-moving bulk jar may be harder to support even if its price per unit is lower. This leads to two separate commercial decisions: which flavours deserve regular availability, and which should be ordered only for a defined menu trial. The range can expand as those trials reveal the strength of actual demand.
Accurate local product information must accompany that assortment. Thailand's Ministry of Public Health Notification No. 450 addresses prepackaged food labelling. Its English version incorporates October 2026 amendments and specifies food names, ingredient information and responsible business details within the applicable requirements. The exact obligations vary with the product and route to sale. A distributor should therefore be able to connect each offered flavour and pack to its own information. That connection supports the Thai growth case by allowing a successful menu trial to become a dependable regular listing.
Malaysia
Malaysia starts from a smaller popping boba revenue base than China or the United States. FMI projects USD 16.6 million in 2026 and USD 39.6 million by 2036. A broad international catalogue does not automatically justify stocking every flavour locally. The commercial range needs to reflect the number and type of accounts a distributor can replenish with enough frequency to maintain turnover.
Handling adds a second dimension to that stocking decision. Malaysia's Ministry of Health describes risk-based food entry controls and requirements covering preparation, storage and transport at food premises. A product's acceptance into trade therefore does not settle how an outlet should manage an opened pack. Product training is useful when it explains the actual supplier instructions and chosen serving application. The pack must still suit the customer's level of use. Training cannot create sufficient throughput for a flavour that rarely sells.
Across 2026 to 2036, the FMI forecast is a 9.1% CAGR. In practical terms, the additional business leaves room for several supply approaches. A smaller customer may be served best by a narrow selection with reliable replenishment. A multi-outlet buyer may place more value on keeping one core specification consistent across its locations. The distributor should judge both by their reorders and residual stock after a menu trial. FMI's view is that Malaysian sales can expand through those repeatable accounts without requiring every new flavour to become a permanent locally held item. That is a more useful commercial test than catalogue breadth alone.
South Korea
South Korea's import system makes the producing facility part of the commercial decision. The Ministry of Food and Drug Safety states that foreign food facilities must be registered before import declaration. Its guidance also describes controls across customs clearance and domestic distribution.
The FMI outlook puts South Korean popping boba revenue at USD 20.7 million in 2026, rising to USD 45.1 million in 2036. The forecast CAGR is 8.1% from 2026 to 2036. The growth case is therefore stronger for a supplier that can maintain a dependable route to market than for one relying on occasional low-priced shipments. Consistent product identification helps the importer connect a flavour to its responsible manufacturer. On 2026 revenue, South Korea stands joint fifth in the ten-country set. In the popping boba market, South Korea's revenue grows 2.2 times over the decade, against 2.4 times globally.
There is also a commercial reason to limit unnecessary changes. An outlet that has tested a pearl in a drink needs the reordered product to perform comparably. Switching source or specification can create another round of testing at the same time as the import review. FMI expects established suppliers to compete on that continuity, particularly when customers seek to repeat a menu item across several locations. It reflects revenue expansion within the defined topping market, including the possibility of higher sales through existing customers.
Japan
A foodservice jar and an individually sold retail portion create different entry costs in Japan. The former must fit an outlet's handling routine. The latter must make the inclusion understandable before purchase and justify its own shelf space. FMI puts Japanese popping boba revenue at USD 24.9 million in 2026. At that scale, a supplier needs to choose its first channel carefully instead of assuming that the same pack can serve every account.
Container selection is part of that choice. The Consumer Affairs Agency's positive-list system for food-contact apparatus and packaging completed its transition at the end of May 2025. Designated synthetic-resin materials are covered by the system. The food and the container therefore need to be assessed together for the proposed sale. An attractive portion pack still has to meet the relevant materials requirements. A compliant bulk jar still has to fit the customer's rate of use.
The national outlook reaches USD 49.3 million by 2036, with a CAGR of 7.1% from 2026 to 2036. FMI expects the additional business to be more accessible to suppliers that can preserve a successful specification after the initial trial. Changing a container or formulation can require further assessment just when a customer wants to reorder. A narrow starting range gives the supplier a clearer basis for learning which pack-flavour combinations deserve permanent stock. Wider assortment can follow demonstrated demand instead of precede it. The Japanese opportunity is consequently tied to execution across the chosen selling channel as well as consumer acceptance.
Taiwan
Taiwan's position as a source of commercial pearl products needs to be separated from the size of its domestic market. The Strawberry Pure25 listing identifies Taiwan as the product's origin. Domestic popping boba revenue is forecast by FMI to increase from USD 33.1 million in 2026 to USD 59.9 million in 2036. The 2026 to 2036 CAGR is 6.1%. Taiwan's slice of global revenue goes from 8.0% to 6.1%. Revenue in Taiwan climbs by USD 26.8 million, sixth among the ten. Taiwan's 2026 revenue ranks third of ten.
Business-use labelling creates an important distinction within that trade. Taiwan FDA's guidance states that prepackaged food for business use is subject to the food safety labelling framework. It also distinguishes imports intended for repacking or further processing from products sold directly to food factories, catering businesses or consumers. A large jar sold to a café should therefore not be treated as an unlabelled intermediate merely because the customer is a business.
A manufacturer supplying several destinations may need separate presentation and documentation for each sales route while maintaining the same physical product. Domestic buyers gain from a clear connection between the identified product and the specification they receive. Export buyers need destination-ready information as well. FMI expects differentiation to rest increasingly on the supplier's ability to preserve that connection across flavours and pack formats.
Who are the notable companies in the Popping Boba Market?
Notable companies in the Popping Boba Market include Tea Zone, Bossen, Monin, Kerry Group and Torani.
The companies in this assessment occupy different commercial positions. Tea Zone and Bossen publish specific pearl ranges and compete for topping listings. Their catalogues allow buyers to compare flavour breadth and pack presentation. Tea Zone is part of Karat by Lollicup, whose catalogue combines beverage ingredients with equipment and service supplies. That wider offer is relevant to the way a distributor serves an outlet.
Monin's documented strawberry purée is a beverage ingredient, while Torani's documented Forest Pine product is a syrup. Kerry Group supports flavour development and sampling. These roles are relevant to menu design, but they do not establish that the three companies manufacture popping pearls. Their broader company revenue should not be counted as popping boba revenue. Bubble Tea Supply's current site offers specialist ingredients and business support, providing another route through which operators develop and replenish their menus.
FMI's competitive assessment therefore separates a direct topping offer from an adjacent ingredient offer. A supplier can influence the finished drink without competing for the same production contract. Buyers need that distinction when comparing manufacturers, wholesalers and formulation partners.
Key Developments in the Popping Boba Market
- On 7 April 2026, Pecan Deluxe Candy Company announced that it had expanded its Dallas, Texas facility and doubled popping boba production capacity. The company states output of up to 100.0 million pounds per year, depending on product size and flavor.
Key Players in the Popping Boba Market
- Tea Zone
- Bossen
- Monin
- Kerry Group
- Torani
- Bubble Tea Supply
Popping Boba Market Report Scope
Table 6: Popping Boba Market Report Scope
| Coverage field | Report scope |
|---|---|
| Market definition | Fruit-juice-filled spheres made by spherification and sold as toppings for drinks and desserts |
| Included applications | Bubble tea, frozen yogurt, desserts and other beverages |
| Market boundary | Sales of the pearls to foodservice operators and retail |
| Exclusions | Complete prepared-drink revenue, tapioca pearls, unrelated syrups and purées, and beverage equipment |
| Quantitative Units | USD million |
| Segment coverage | Flavour and end use |
| Pack Format coverage | Bulk Foodservice Tubs and Jars, Retail Pouches and Jars, Single-Serve Cups. |
| Country coverage | China, United States, Taiwan, Japan, Thailand, Indonesia, South Korea, Malaysia, Vietnam and United Kingdom |
| Companies considered | Monin, Kerry Group, Torani, Tea Zone, Bossen and Bubble Tea Supply, with direct and adjacent roles distinguished |
Source: Future Market Insights analysis of the popping boba market, 2026.
Popping Boba Market Research Methodology
The popping boba assessment brings together FMI's numerical outlook with secondary review of original supplier information and government guidance. Market boundaries distinguish pearl sales from complete drinks and adjacent ingredients. Competitive interpretation separates directly documented pearl offers from flavour and distribution roles. The review checks the association between evidence and claims, the stated country periods and the consistency of units and segment shares.
Popping Boba Market by Segments
Popping Boba Market segmented by Flavour:
- Strawberry
- Mango
- Lychee
- Passion Fruit
- Blueberry
- Others
Popping Boba Market segmented by End Use:
- Bubble Tea Shops
- Dessert and Frozen Yogurt Outlets
- Beverage Brands and Cafes
- Home and Retail
Popping Boba Market segmented by Pack Format:
- Bulk Foodservice Tubs and Jars
- Retail Pouches and Jars
- Single-Serve Cups
Popping Boba Market by Region
- East Asia
- China
- Taiwan
- Japan
- South Korea
- Southeast Asia
- Thailand
- Indonesia
- Malaysia
- Vietnam
- North America
- United States
- Western Europe
- United Kingdom
- Rest of world
Research Sources and Bibliography
- Australian Government Department of Foreign Affairs and Trade. Complying with Indonesian Halal Requirements. Guidance reflecting the 16 October 2026 postponement, accessed 9 November 2026. https://www.dfat.gov.au/geo/indonesia/complying-indonesian-halal-requirements
- Bossen. Bursting Boba Entire Collection. Product assortment, accessed 9 November 2026. https://www.bossenstore.com/collections/bursting-boba
- Bossen. Strawberry Bursting Boba Pure25. Product specification and storage guidance, accessed 9 November 2026. https://www.bossenstore.com/products/strawberry-bursting-boba-pure25
- Bubble Tea Supply. Bubble Tea Supply: Wholesale Ingredients and Business Support. Company website, accessed 9 November 2026. https://www.bubbleteasupply.com/
- Consumer Affairs Agency, Japan. Positive List System for Food Apparatus, Containers and Packaging from 1 June 2025. Accessed 9 November 2026. https://www.caa.go.jp/policies/policy/standards_evaluation/appliance/positive_list_new
- Government of Vietnam. Government and Prime Minister's Notable Directions for 4-10 April 2026: Continued Application of Decree 15/2018 on Food Safety. 11 April 2026. https://baochinhphu.vn/chi-dao-dieu-hanh-cua-chinh-phu-thu-tuong-chinh-phu-noi-bat-tuan-tu-4-10-4-2026-102260410100134649.htm
- Karat by Lollicup. Tea Zone Product Catalog 2026-2027. Company catalogue, accessed 9 November 2026. https://www.karatpackaging.com/files/Tea-Zone-Catalog.pdf
- Kerry Group. Kerry Releases 2026 Global Taste Charts: Defining the Future of Flavour with Data-Rich Insights. 14 January 2026. https://www.kerry.com/about/news-and-media/2026/kerry-launches-taste-charts-2026
- LollicupStore. Tea Zone Popping Pearls. Product assortment, accessed 9 November 2026. https://lollicupstore.com/collections/popping-pearls
- Ministry of Food and Drug Safety, South Korea. Imported Food Safety. Official import management and facility-registration guidance, accessed 9 November 2026. https://www.mfds.go.kr/eng/wpge/m_11/de011002l001.do
- Ministry of Health, Malaysia. Food Safety and Quality Programme. Updated 10 March 2026. https://www.moh.gov.my/en/corporate-info/division-information/food-safety-and-quality-programme
- Ministry of Public Health, Thailand. Notification No. 450 B.E. 2567 (2024): Labeling of Prepackaged Foods. English translation published by the Thai Food and Drug Administration, incorporating Notification No. 474 amendments published 30 October 2026. Accessed 9 November 2026. https://food.fda.moph.go.th/media.php?id=657392349080592384&name=P450_EN.pdf
- Monin. Strawberry Purée. Product information, accessed 9 November 2026. https://monin.us/products/strawberry-fruit-puree
- National Health Commission and State Administration for Market Regulation, China. Announcement on GB 2760-2024 and Other National Food Safety Standards. 8 February 2024. https://www.gov.cn/zhengce/zhengceku/202403/content_7001729.htm
- Pecan Deluxe Candy Company. (2026, April 10). Pecan Deluxe Doubles Popping Boba Capacity. https://pecandeluxe.com/news/pecan-deluxe-doubles-popping-boba-capacity/
- Taiwan Food and Drug Administration. Principles for Managing the Labeling of Foods (including Raw Materials) with Intact Package for Business Use. Announced 6 December 2013; updated 22 April 2022; accessed 9 November 2026. https://www.fda.gov.tw/ENG/lawContent.aspx?cid=16&id=3411
- Torani. A Taste of Adventure: Presenting Torani Forest Pine. 13 November 2025. https://www.torani.com/blog/a-taste-of-adventure-presenting-torani-forest-pine/
- United Kingdom Department of Health and Social Care and Department for Culture, Media and Sport. Less Healthy Food or Drink: Advertising and Promotions Restrictions. Updated 25 March 2026. https://www.gov.uk/government/collections/less-healthy-food-or-drink-advertising-and-promotions-restrictions
- United States Food and Drug Administration. Guidance for Industry: Foreign Supplier Verification Programs for Importers of Food for Humans and Animals. January 2023, accessed 9 November 2026. https://www.fda.gov/regulatory-information/search-fda-guidance-documents/guidance-industry-foreign-supplier-verification-programs-importers-food-humans-and-animals
This bibliography is provided for reader reference and is not exhaustive. The full report contains the complete reference list and detailed citations.
Table of Content
- Key Takeaways
- Market Size and CAGR
- Top Growth Driver
- Fastest Growing Segment
- Leading Region
- Key Companies
- Emerging Opportunities
- Executive Summary
- Global Market Outlook
- Demand-side Trends
- Supply-side Trends
- Technology Roadmap Analysis
- Analysis and Recommendations
- Analyst Perspective (What is happening? Why now? What should investors know?)
- Key Questions Answered
- How large is the market?
- What is the CAGR?
- What are key trends?
- Which region dominates?
- Who are the leaders?
Read More...
- Market Overview
- Market Coverage / Taxonomy
- Market Definition / Scope / Limitations
- Research Methodology
- Chapter Orientation
- Analytical Lens and Working Hypotheses
- Market Structure, Signals, and Trend Drivers
- Benchmarking and Cross-market Comparability
- Market Sizing, Forecasting, and Opportunity Mapping
- Research Design and Evidence Framework
- Desk Research Programme (Secondary Evidence)
- Expert Input and Fieldwork (Primary Evidence)
- Tooling, Models, and Reference Databases
- Data Engineering and Model Build
- Quality Assurance and Audit Trail
- Market Background
- Market Dynamics (Drivers, Restraints, Opportunity, Trends)
- Scenario Forecast (Optimistic, Likely, Conservative)
- Impact Analysis
- AI Impact
- Sustainability Impact
- Regulatory Impact
- Technology Impact
- Consumer / Buyer Analysis
- Purchase Drivers
- Adoption Barriers
- Buyer Journey
- Opportunity Map Analysis
- Product Life Cycle Analysis
- Supply Chain Analysis
- Investment Feasibility Matrix
- Value Chain Analysis
- PESTLE and Porter's Analysis
- Regulatory Landscape
- Regional Parent Market Outlook
- Production and Consumption Statistics
- Import and Export Statistics
- Global Market Analysis and Forecast, 2021 to 2036
- Historical Market Size Value (USD Million) Analysis, 2021 to 2025
- Current and Future Market Size Value (USD Million) Projections, 2026 to 2036
- Y-o-Y Growth Trend Analysis
- Absolute $ Opportunity Analysis
- Global Market Pricing Analysis, 2021 to 2036
- Global Market Analysis and Forecast, By Flavour, 2021 to 2036
- Introduction / Key Findings
- Historical Market Size Value (USD Million) Analysis By Flavour, 2021 to 2025
- Current and Future Market Size Value (USD Million) Analysis and Forecast By Flavour, 2026 to 2036
- Strawberry
- Mango
- Lychee
- Passion Fruit
- Blueberry
- Others
- Y-o-Y Growth Trend Analysis By Flavour, 2021 to 2025
- Absolute $ Opportunity Analysis By Flavour, 2026 to 2036
- Global Market Analysis and Forecast, By End Use, 2021 to 2036
- Introduction / Key Findings
- Historical Market Size Value (USD Million) Analysis By End Use, 2021 to 2025
- Current and Future Market Size Value (USD Million) Analysis and Forecast By End Use, 2026 to 2036
- Bubble Tea Shops
- Dessert and Frozen Yogurt Outlets
- Beverage Brands and Cafes
- Home and Retail
- Y-o-Y Growth Trend Analysis By End Use, 2021 to 2025
- Absolute $ Opportunity Analysis By End Use, 2026 to 2036
- Global Market Analysis and Forecast, By Pack Format, 2021 to 2036
- Introduction / Key Findings
- Historical Market Size Value (USD Million) Analysis By Pack Format, 2021 to 2025
- Current and Future Market Size Value (USD Million) Analysis and Forecast By Pack Format, 2026 to 2036
- Bulk Foodservice Tubs and Jars
- Retail Pouches and Jars
- Single-Serve Cups
- Y-o-Y Growth Trend Analysis By Pack Format, 2021 to 2025
- Absolute $ Opportunity Analysis By Pack Format, 2026 to 2036
- Global Market Analysis and Forecast, By Region, 2021 to 2036
- Introduction
- Historical Market Size Value (USD Million) Analysis By Region, 2021 to 2025
- Current Market Size Value (USD Million) Analysis and Forecast By Region, 2026 to 2036
- East Asia
- North America
- Western Europe
- Market Attractiveness Analysis By Region
- East Asia Market Analysis and Forecast, By Country
- Historical Market Size Value (USD Million) Trend Analysis By Market Taxonomy, 2021 to 2025
- Market Size Value (USD Million) Forecast By Market Taxonomy, 2026 to 2036
- By Country
- China
- Taiwan
- Japan
- South Korea
- Southeast Asia
- Thailand
- Indonesia
- Malaysia
- Vietnam
- By Flavour
- By End Use
- By Pack Format
- By Country
- Market Attractiveness Analysis
- By Country
- By Flavour
- By End Use
- By Pack Format
- Key Takeaways
- North America Market Analysis and Forecast, By Country, 2021 to 2036
- Historical Market Size Value (USD Million) Trend Analysis By Market Taxonomy, 2021 to 2025
- Market Size Value (USD Million) Forecast By Market Taxonomy, 2026 to 2036
- By Country
- United States
- By Flavour
- By End Use
- By Pack Format
- By Country
- Market Attractiveness Analysis
- By Country
- By Flavour
- By End Use
- By Pack Format
- Key Takeaways
- Western Europe Market Analysis and Forecast, By Country
- Historical Market Size Value (USD Million) Trend Analysis By Market Taxonomy, 2021 to 2025
- Market Size Value (USD Million) Forecast By Market Taxonomy, 2026 to 2036
- By Country
- United Kingdom
- Rest of world
- By Flavour
- By End Use
- By Pack Format
- By Country
- Market Attractiveness Analysis
- By Country
- By Flavour
- By End Use
- By Pack Format
- Key Takeaways
- Key Countries Market Analysis
- United States
- Pricing Analysis
- Market Share Analysis, 2025
- By Flavour
- By End Use
- By Pack Format
- United Kingdom
- Pricing Analysis
- Market Share Analysis, 2025
- By Flavour
- By End Use
- By Pack Format
- China
- Pricing Analysis
- Market Share Analysis, 2025
- By Flavour
- By End Use
- By Pack Format
- Japan
- Pricing Analysis
- Market Share Analysis, 2025
- By Flavour
- By End Use
- By Pack Format
- South Korea
- Pricing Analysis
- Market Share Analysis, 2025
- By Flavour
- By End Use
- By Pack Format
- Vietnam
- Pricing Analysis
- Market Share Analysis, 2025
- By Flavour
- By End Use
- By Pack Format
- Indonesia
- Pricing Analysis
- Market Share Analysis, 2025
- By Flavour
- By End Use
- By Pack Format
- Thailand
- Pricing Analysis
- Market Share Analysis, 2025
- By Flavour
- By End Use
- By Pack Format
- Malaysia
- Pricing Analysis
- Market Share Analysis, 2025
- By Flavour
- By End Use
- By Pack Format
- Taiwan
- Pricing Analysis
- Market Share Analysis, 2025
- By Flavour
- By End Use
- By Pack Format
- United States
- Market Structure Analysis
- Competition Dashboard
- Competition Benchmarking
- Market Share Analysis of Top Players
- By Regional
- By Flavour
- By End Use
- By Pack Format
- Emerging Startups
- Innovation Benchmarking
- Competition Analysis
- Competition Deep Dive
- Tea Zone
- Overview
- Product Portfolio
- Profitability by Market Segments
- Sales Footprint
- Strategy Overview
- Marketing Strategy
- Product Strategy
- Channel Strategy
- Bossen
- Monin
- Kerry Group
- Torani
- Bubble Tea Supply
- Tea Zone
- Case Studies
- Success Stories
- Recent Developments
- Competition Deep Dive
- Assumptions & Acronyms Used
List of Tables
- Table 1: Global Market Value (USD Million) Forecast by Region, 2021 to 2036
- Table 2: Global Market Value (USD Million) Forecast by Flavour, 2021 to 2036
- Table 3: Global Market Value (USD Million) Forecast by End Use, 2021 to 2036
- Table 4: Global Market Value (USD Million) Forecast by Pack Format, 2021 to 2036
- Table 5: East Asia Market Value (USD Million) Forecast by Country, 2021 to 2036
- Table 6: East Asia Market Value (USD Million) Forecast by Flavour, 2021 to 2036
- Table 7: East Asia Market Value (USD Million) Forecast by End Use, 2021 to 2036
- Table 8: East Asia Market Value (USD Million) Forecast by Pack Format, 2021 to 2036
- Table 9: North America Market Value (USD Million) Forecast by Country, 2021 to 2036
- Table 10: North America Market Value (USD Million) Forecast by Flavour, 2021 to 2036
- Table 11: North America Market Value (USD Million) Forecast by End Use, 2021 to 2036
- Table 12: North America Market Value (USD Million) Forecast by Pack Format, 2021 to 2036
- Table 13: Western Europe Market Value (USD Million) Forecast by Country, 2021 to 2036
- Table 14: Western Europe Market Value (USD Million) Forecast by Flavour, 2021 to 2036
- Table 15: Western Europe Market Value (USD Million) Forecast by End Use, 2021 to 2036
- Table 16: Western Europe Market Value (USD Million) Forecast by Pack Format, 2021 to 2036
List of Figures
- Figure 1: Global Market Pricing Analysis
- Figure 2: Global Market Value (USD Million) Forecast 2021-2036
- Figure 3: Global Market Value Share and BPS Analysis by Flavour, 2026 and 2036
- Figure 4: Global Market Y-o-Y Growth Comparison by Flavour, 2026-2036
- Figure 5: Global Market Attractiveness Analysis by Flavour
- Figure 6: Global Market Value Share and BPS Analysis by End Use, 2026 and 2036
- Figure 7: Global Market Y-o-Y Growth Comparison by End Use, 2026-2036
- Figure 8: Global Market Attractiveness Analysis by End Use
- Figure 9: Global Market Value Share and BPS Analysis by Pack Format, 2026 and 2036
- Figure 10: Global Market Y-o-Y Growth Comparison by Pack Format, 2026-2036
- Figure 11: Global Market Attractiveness Analysis by Pack Format
- Figure 12: Global Market Value (USD Million) Share and BPS Analysis by Region, 2026 and 2036
- Figure 13: Global Market Y-o-Y Growth Comparison by Region, 2026-2036
- Figure 14: Global Market Attractiveness Analysis by Region
- Figure 15: East Asia Market Incremental Dollar Opportunity, 2026-2036
- Figure 16: North America Market Incremental Dollar Opportunity, 2026-2036
- Figure 17: Western Europe Market Incremental Dollar Opportunity, 2026-2036
- Figure 18: East Asia Market Value Share and BPS Analysis by Country, 2026 and 2036
- Figure 19: East Asia Market Value Share and BPS Analysis by Flavour, 2026 and 2036
- Figure 20: East Asia Market Y-o-Y Growth Comparison by Flavour, 2026-2036
- Figure 21: East Asia Market Attractiveness Analysis by Flavour
- Figure 22: East Asia Market Value Share and BPS Analysis by End Use, 2026 and 2036
- Figure 23: East Asia Market Y-o-Y Growth Comparison by End Use, 2026-2036
- Figure 24: East Asia Market Attractiveness Analysis by End Use
- Figure 25: East Asia Market Value Share and BPS Analysis by Pack Format, 2026 and 2036
- Figure 26: East Asia Market Y-o-Y Growth Comparison by Pack Format, 2026-2036
- Figure 27: East Asia Market Attractiveness Analysis by Pack Format
- Figure 28: North America Market Value Share and BPS Analysis by Country, 2026 and 2036
- Figure 29: North America Market Value Share and BPS Analysis by Flavour, 2026 and 2036
- Figure 30: North America Market Y-o-Y Growth Comparison by Flavour, 2026-2036
- Figure 31: North America Market Attractiveness Analysis by Flavour
- Figure 32: North America Market Value Share and BPS Analysis by End Use, 2026 and 2036
- Figure 33: North America Market Y-o-Y Growth Comparison by End Use, 2026-2036
- Figure 34: North America Market Attractiveness Analysis by End Use
- Figure 35: North America Market Value Share and BPS Analysis by Pack Format, 2026 and 2036
- Figure 36: North America Market Y-o-Y Growth Comparison by Pack Format, 2026-2036
- Figure 37: North America Market Attractiveness Analysis by Pack Format
- Figure 38: Western Europe Market Value Share and BPS Analysis by Country, 2026 and 2036
- Figure 39: Western Europe Market Value Share and BPS Analysis by Flavour, 2026 and 2036
- Figure 40: Western Europe Market Y-o-Y Growth Comparison by Flavour, 2026-2036
- Figure 41: Western Europe Market Attractiveness Analysis by Flavour
- Figure 42: Western Europe Market Value Share and BPS Analysis by End Use, 2026 and 2036
- Figure 43: Western Europe Market Y-o-Y Growth Comparison by End Use, 2026-2036
- Figure 44: Western Europe Market Attractiveness Analysis by End Use
- Figure 45: Western Europe Market Value Share and BPS Analysis by Pack Format, 2026 and 2036
- Figure 46: Western Europe Market Y-o-Y Growth Comparison by Pack Format, 2026-2036
- Figure 47: Western Europe Market Attractiveness Analysis by Pack Format
- Figure 48: Global Market - Tier Structure Analysis
- Figure 49: Global Market - Company Share Analysis
Frequently Asked Questions
How big is the popping boba market in 2026?
FMI estimates the market at USD 414.2 million in 2026, up from USD 380.0 million in 2025. It is forecast to reach USD 980.6 million by 2036 at a 9.0% CAGR.
Which flavour leads the popping boba market in 2026?
Strawberry leads by flavour with 22.0% in 2026. All other segments together hold 78.0%.
Which end use and pack format lead in 2026?
Bubble Tea Shops holds 56.0% by end use and Bulk Foodservice Tubs and Jars holds 60.0% by pack format in FMI's 2026 assessment.
Which market is forecast to grow fastest through 2036?
Vietnam has the highest forecast CAGR at 12.1% during 2026 to 2036, followed by Indonesia at 11.1%.
Which named country has the fastest growth outlook?
Vietnam has the highest forecast CAGR among the ten named countries at 12.1% from 2026 to 2036.
Preview the report firsthand - request a free sample
Get SampleGet the brochure for pricing and purchase details.
Get PDF
