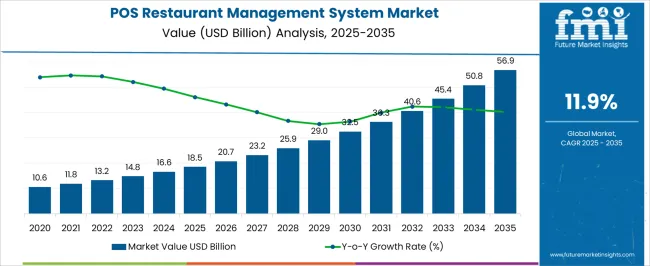
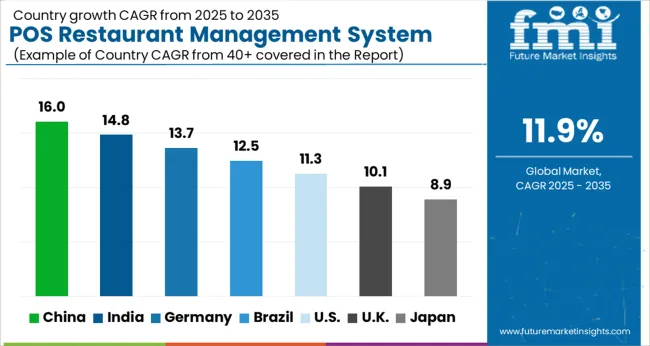
The POS Restaurant Management System Market is estimated to be valued at USD 18.5 billion in 2025 and is projected to reach USD 56.9 billion by 2035, registering a compound annual growth rate (CAGR) of 11.9% over the forecast period.
| Metric | Value |
|---|---|
| POS Restaurant Management System Market Estimated Value in (2025 E) | USD 18.5 billion |
| POS Restaurant Management System Market Forecast Value in (2035 F) | USD 56.9 billion |
| Forecast CAGR (2025 to 2035) | 11.9% |
The POS Restaurant Management System market is being driven by the growing need for efficient and seamless dining operations in restaurants across various regions. The current market environment reflects strong adoption of technology solutions that enable streamlined workflows, real-time order processing, and better customer service. With rising labor costs and the demand for enhanced customer experience, restaurant operators are prioritizing systems that improve operational efficiency and reduce manual intervention.
The ongoing digital transformation in the hospitality industry is accelerating the deployment of cloud-based solutions and mobile platforms. Investment in integrated payment systems, analytics, and customer engagement tools is contributing to the expansion of the market.
In the coming years, demand is expected to be further supported by the shift towards contactless transactions, personalization through data-driven insights, and increased use of mobile-based platforms that enable faster decision-making As dining experiences evolve and competition intensifies, POS systems are anticipated to remain a vital part of restaurant operations, offering scalability and flexibility while addressing both customer expectations and operational challenges.
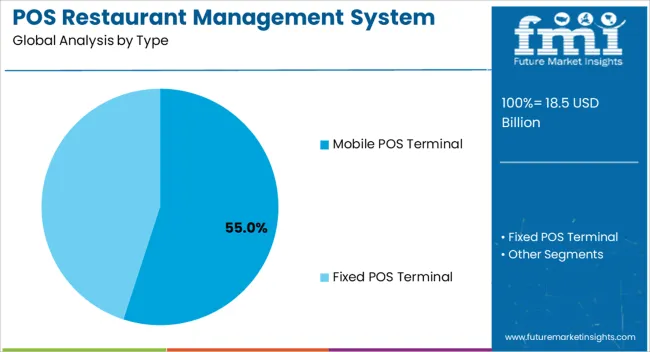
The Mobile POS Terminal type is projected to hold 55.00% of the POS Restaurant Management System market revenue share in 2025, making it the largest segment among all types. This position has been supported by the growing preference for portable and flexible payment solutions that can be used across dining environments. Mobile POS terminals are increasingly being adopted because they allow servers and staff to take orders and process payments at the table, reducing wait times and improving service efficiency.
The rise of cloud-based software platforms has further enabled real-time synchronization of orders and inventory, making mobile terminals essential in fast-paced restaurant settings. The ability to update menu items instantly and integrate loyalty programs through software upgrades has made mobile terminals highly desirable.
Additionally, the adoption of mobile payment options by customers has reinforced the demand for solutions that offer secure and quick transactions As restaurants aim to enhance customer satisfaction while optimizing staff productivity, mobile POS terminals are being positioned as the preferred choice in modern dining establishments.
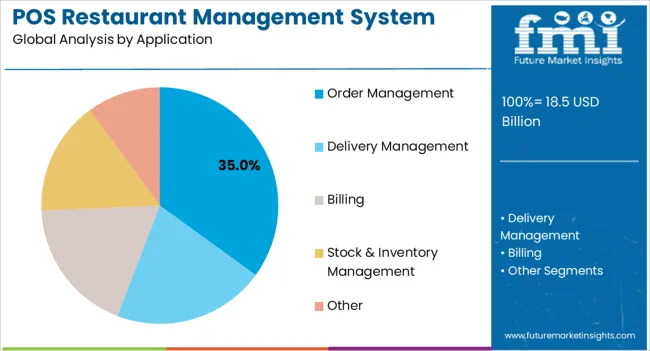
The Order Management application segment is expected to account for 35.00% of the total POS Restaurant Management System market revenue share in 2025, marking it as the leading application area. The growth of this segment has been attributed to the increasing complexity of restaurant operations and the need for efficient coordination between front-of-house and kitchen teams. Order management solutions are being integrated with menu customization, kitchen display systems, and customer-facing interfaces to ensure faster processing and reduced errors.
The ability to track orders in real time and monitor kitchen workflow has been critical in reducing delays and improving table turnover rates. Additionally, the integration of customer preferences, dietary restrictions, and personalized recommendations through data analytics has supported customer satisfaction.
The focus on minimizing human error and providing seamless communication across departments has further driven the adoption of order management solutions As restaurants face pressure to maintain high service standards while operating efficiently, order management has been positioned as a key component of technology-driven dining solutions.
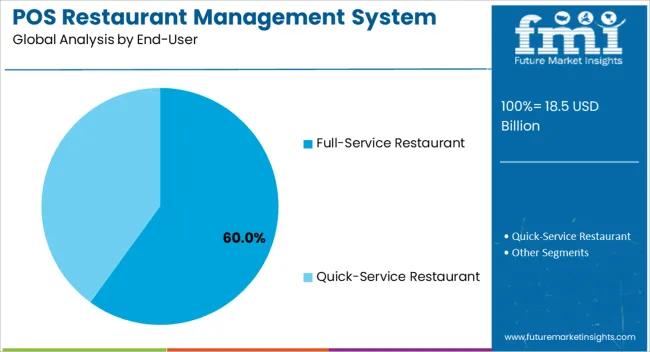
The Full Service Restaurant end-use industry segment is projected to hold 60.00% of the POS Restaurant Management System market revenue share in 2025, making it the dominant sector among end users. The leadership of this segment has been driven by the need for enhanced customer experience, operational efficiency, and streamlined order processing. Full service restaurants are increasingly adopting POS systems that support table-side ordering, integrated billing, and customer feedback management.
The demand for customized services and premium dining experiences has prompted operators to rely on technology solutions that can support a high-touch customer interaction model. The integration of real-time order tracking, personalized promotions, and loyalty programs has further contributed to improved customer retention and operational productivity.
Moreover, as labor management becomes more critical in full service settings, POS systems are being used to optimize scheduling, reduce manual tasks, and improve staff communication With rising competition and customer expectations, full service restaurants are prioritizing investments in technology platforms that ensure seamless dining experiences while improving overall profitability and workflow efficiency.
It is projected that increased demand for POS terminals is driving the adoption of POS restaurant management systems. Exponential growth has been witnessed from computer systems to management systems within the restaurant software industry.
The technological advancements in the restaurant industry and the rising need for software that is restaurant-specific, such as payment and billing, management of inventory, and table management, are likely to be the key drivers in the POS restaurant management systems market during the forecast period.
The POS restaurant management systems are said to be the restaurants' initial venture into the restaurant software market. Features of POS restaurant management systems that enable the interchange of cash and credit, the consolidation of sales data in a single storage, and more are strongly driving the industry.
The restaurant sector is increasingly focusing on the deployment of POS restaurant management systems, as there is a rising need to deliver outstanding services and experiences to customers. The demand is being fueled by the centralized operational capability of the systems, and the data accuracy in restaurant applications.
Advancements in payment options like debit cards, credit cards, e-wallets, and other options are also driving the growth of the POS restaurant management systems market.
The restaurant management system also provides tablets with restaurant ordering applications, real-time business analytics, and modules that are integrated for gift and loyalty cards, which is driving the expansion of the POS restaurant management systems market.
Although the market is being driven by increasing competition in the retail sector, coupled with a growing number of quick-service restaurant chains, there are also some restraining factors that are expected to curb the growth of the POS restaurant management systems market during the forecast period.
It is anticipated that the unavailability of a single seamless integrated software, and there is a lack of skilled personnel, and less adoption rate, are some primary factors that are likely to limit the market from realizing its utmost potential.
The POS restaurant management systems lack the ability to have unified interactions with other systems that have been deployed in the restaurant. Therefore, the growth of the POS restaurant management systems market share is likely to suffer a layback in the upcoming years.
North America is expected to hold a dominant share in the POS restaurant management systems market, owing to the development and expansion of the restaurant industries in this region.
POS restaurant management systems are giving mobility to restaurant operations, helping them improve kitchen efficiency and quality of service with reduced chances for errors. The North American region is currently accountable for 28.1% of the total market share for POS restaurant management systems.
However, the Asia-Pacific region is projected to lead the POS restaurant management systems market due to its favorable demographic condition and lucrative opportunities.
The European market for POS restaurant management systems is also anticipated to witness steady growth in market shares. Currently, this region is accountable for 22.1% of the total market size of the POS Restaurant Management System Market.
This region is receiving a lot of grants from multiple sources for the implementation of POS restaurant management systems. The growing integration of payment solutions in retail and hotel industries is leveraging the market size in this region.
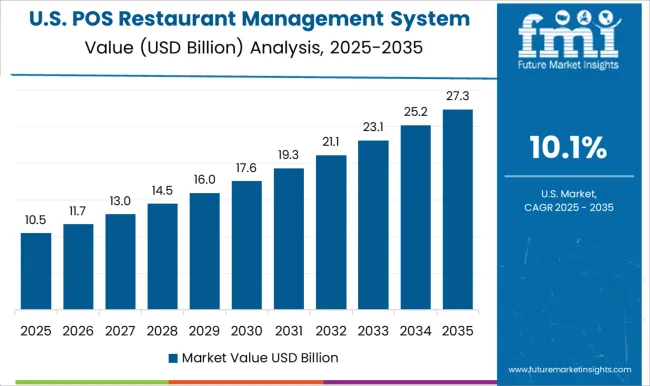
The United States POS restaurant management system market has grown significantly lately. The United States is one of the leading markets for the restaurant industry globally. The number of restaurants, cafes, bars, and food service establishments is increasing. This growth has created a strong demand for efficient restaurant management solutions. The demand has led to the growth of the POS restaurant management system industry.
The United States has a vibrant and diverse restaurant industry, ranging from quick-service restaurants (QSRs) to fine dining establishments. As per a National Restaurant Association report, restaurant sales in the United States surged to an all-time high of USD 18.5 billion in 2025, indicating a rise in consumer desire for dining out occasions. As consumer preferences evolve and technology advancements continue, restaurants are increasingly adopting POS restaurant management systems to enhance their operational efficiency, improve customer experience, and gain valuable insights into their business.
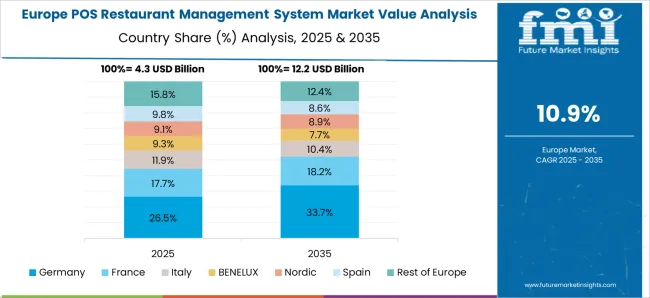
Germany has a vibrant restaurant industry, with a strong demand for innovative technologies to enhance operational efficiency and customer experience. The adoption of POS Restaurant Management Systems is rapidly increasing, driven by the need to streamline operations, improve order accuracy, manage inventory effectively, and enhance customer service. Consumers in Germany place a strong emphasis on food quality, authenticity, and sustainability. Restaurants that can demonstrate transparency in their sourcing practices and offer organic, locally-sourced ingredients tend to attract a larger customer base.
Germany has strict regulations regarding food safety, allergen labeling, and data protection. POS Restaurant Management Systems that offer compliance features and enable efficient reporting help restaurants meet these requirements. The increasing trend of quick-service restaurants and takeaways in Germany has led to a higher demand for POS systems that can efficiently handle high-volume, fast-paced operations. Streamlined order processing and integration with kitchen display systems are crucial in meeting this demand.
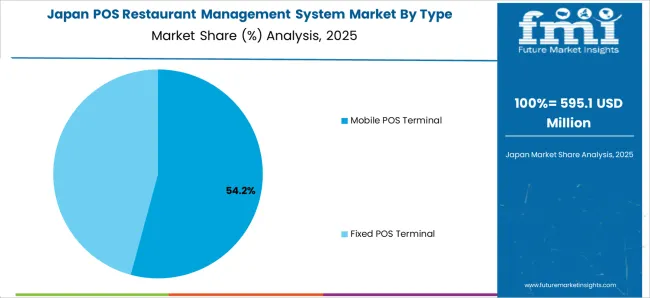
The Japan restaurant industry is highly competitive and renowned for its diverse culinary culture. The demand for POS restaurant management systems has been growing as restaurants seek to enhance customer service, improve operational efficiency, and gain a competitive edge. Mobile ordering and payment solutions have gained popularity in Japan with the widespread use of smartphones. Restaurants are adopting mobile POS systems that allow customers to place orders, make payments, and even access loyalty programs directly from their smartphones.
Omakase, meaning "chef's choice," is a dining experience highly valued in Japan. POS systems that cater to this culture, allowing chefs to personalize menus and provide a unique dining experience, have gained traction in the market. As Japan attracts many international tourists, POS systems with multilingual support are essential for restaurants to cater to non-Japanese-speaking customers. Hence, the Japan POS restaurant management system market is poised for considerable growth.
| Country | Value CAGR (2025 to 2035) |
|---|---|
| United Kingdom | 11.4% |
| China | 14.3% |
| India | 15.4% |
The United Kingdom POS restaurant management system market is experiencing significant growth. The increasing trend of eating out, the adoption of digital technology in the food service industry, and the demand for streamlined operations are driving the market. The United Kingdom has a thriving restaurant industry with a strong dining-out culture. Consumers are increasingly seeking convenience, personalized experiences, and efficient services while dining, leading to a growing demand for advanced restaurant management systems.
The adoption of mobile ordering and payment solutions is gaining momentum in the United Kingdom. Customers prefer the convenience of placing orders and making payments through their smartphones, driving the integration of mobile technologies with POS systems. The popularity of food delivery and takeaway services has surged in the United Kingdom, driven by convenience-seeking millennials and busy professionals. POS systems that integrate with online delivery platforms and provide streamlined order management have become essential for restaurants.
The restaurant industry in China has witnessed tremendous growth over the past decade. The surge in urbanization, the rise in disposable incomes, and shifting lifestyles have contributed to a greater desire for dining out encounters. This, in turn, has fueled the China POS restaurant management system market. The growth of online food delivery services, such as Meituan Dianping and Ele.me, has profoundly impacted the restaurant industry in China. Many restaurants have integrated their POS systems with these platforms to streamline operations, allowing seamless order management and inventory tracking.
China has been at the forefront of mobile payment adoption globally, with apps like Alipay and WeChat Pay dominating the market. This trend has extended to the restaurant industry, where customers prefer to make payments through their smartphones. QR code ordering has become prevalent in China, especially in quick-service restaurants. Customers can scan QR codes placed on tables to access digital menus, place orders, and make payments. POS systems that support QR code ordering streamline the entire process, reducing wait times and enhancing the dining experience.
Eating out has become more common among Indian consumers, driven by factors such as changing lifestyles, increased disposable incomes, and a desire for convenience. This trend has led to a rise in the number of restaurants and has directly influenced the growth of the India POS restaurant management system market. The demand for food delivery and takeaway services has also seen exponential growth in India. POS restaurant management systems that seamlessly integrate with third-party delivery platforms have become essential for restaurants looking to tap into this lucrative market segment.
The rapid growth of India's restaurant industry has been accompanied by infrastructure development, including the expansion of organized retail spaces, commercial complexes, and food courts. This growth in infrastructure provides restaurants with greater opportunities to establish their businesses, driving the demand for POS restaurant management systems. Moreover, India has witnessed a significant shift towards digital payments, driven by government initiatives such as demonetization and the promotion of cashless transactions. POS restaurant management systems that integrate with digital payment platforms have gained popularity.
| Segment | 2025 Value Share in Global Market |
|---|---|
| Mobile POS Terminal Type | 65.5% |
| Billing Application | 34.4% |
The dominance of mobile POS terminals can be attributed to their mobility and flexibility. They allow restaurant staff to take orders and process payments directly at the table or anywhere within the establishment, thereby enhancing efficiency and customer experience. Additionally, mobile POS terminals are cost-effective. Hence, they eliminate the need for expensive hardware installations and complex setups. This makes them an attractive option for restaurants, particularly smaller establishments. These terminals are also user-friendly, featuring intuitive interfaces and simple software, reducing training time and enabling easy adoption by staff.
Mobile POS terminals integrate seamlessly with various software solutions. This enables restaurants to streamline operations, consolidate data, and generate valuable insights. They also enhance customer service by allowing quick order processing, bill splitting, and acceptance of various payment methods, thereby contributing to customer satisfaction. Lastly, these terminals provide real-time data access, allowing restaurant owners and managers to make informed decisions and monitor operations remotely.
Due to several key factors, the billing segment holds a dominant position in the POS restaurant management system market:
Integration with other modules and scalability further enhance the dominance of the billing segment.
How are New Entrants Revolutionizing the POS Restaurant Management System Market?
The start-up ecosystem in the POS restaurant management systems is intense, with frequent innovations being made. Start-ups in the POS restaurant management systems market are focusing on improvising the services to give a seamless experience to the customers.
Toast is a cloud-based system providing solutions for POS, online ordering, gift cards, analytics, etc. It enables the users to monitor tableside orders, restaurant menus, online orders, payment processing, multi-location management, inventory management, email marketing, loyalty program, staff payroll management, and more. The company offers solutions to the subscription-based policy.
ChowNow is an online ordering, marketing, and customer management platform for restaurants. With ChowNow’s offering, restaurants can individually customize and brand their ordering apps on Facebook and mobile. With the start-up’s Facebook Ordering App, restaurants can take orders directly through their Facebook page.
How Does Competition Influence the POS Restaurant Management System Market?
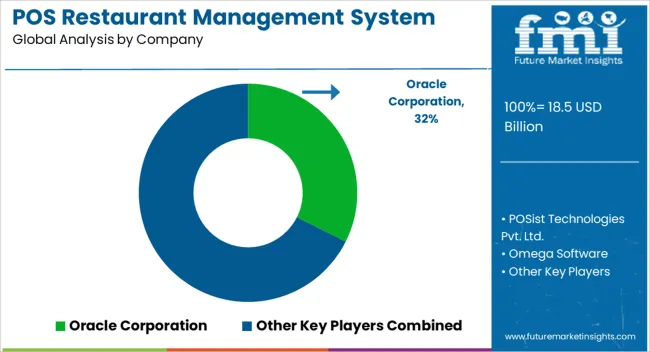
Some of the major key players in the POS Restaurant Management System market are Oracle Corporation, POSist Technologies Pvt. Ltd., Omega Software, Torque, eZeeBurrp, BIM POS SARL, AccuPOS, Lightspeed, Action Card, and others. These key vendors constantly focus on extending product offerings and introducing innovations in the products.
These market players are adhering to strategies such as partnership, acquisition, and research & development, with an aim to broaden their product portfolio.
The global POS restaurant management system market is estimated to be valued at USD 18.5 billion in 2025.
The market size for the POS restaurant management system market is projected to reach USD 56.9 billion by 2035.
The POS restaurant management system market is expected to grow at a 11.9% CAGR between 2025 and 2035.
The key product types in POS restaurant management system market are mobile POS terminal and fixed POS terminal.
In terms of application, order management segment to command 35.0% share in the POS restaurant management system market in 2025.


Full Research Suite comprises of:
Market outlook & trends analysis
Interviews & case studies
Strategic recommendations
Vendor profiles & capabilities analysis
5-year forecasts
8 regions and 60+ country-level data splits
Market segment data splits
12 months of continuous data updates
DELIVERED AS:
PDF EXCEL ONLINE
Post Porcelain Insulator Market Size and Share Forecast Outlook 2025 to 2035
Post-Operative Wound Treatment Market Size and Share Forecast Outlook 2025 to 2035
Post Harvesting Technologies Market Size and Share Forecast Outlook 2025 to 2035
Positive Patient Identification Market Size and Share Forecast Outlook 2025 to 2035
Post-Surgery Skin Repair Market Analysis - Size and Share Forecast Outlook 2025 to 2035
Postpartum Health Supplements Market Size and Share Forecast Outlook 2025 to 2035
Positive Airway Pressure Devices Market Size and Share Forecast Outlook 2025 to 2035
Positive Displacement Blowers Market Size and Share Forecast Outlook 2025 to 2035
Post-Operative Cataract Surgery Inflammation Treatment Market Size and Share Forecast Outlook 2025 to 2035
Post-Quantum Cryptography (PQC) Migration Market Analysis - Size, Share, and Forecast Outlook 2025 to 2035
Post-Traumatic Stress Disorder (PTSD) Treatment Market Size and Share Forecast Outlook 2025 to 2035
Postbiotic Feed Additives Market Analysis - Size and Share Forecast Outlook 2025 to 2035
Post Shave Care Products Market Size and Share Forecast Outlook 2025 to 2035
Postbiotic Supplements Market Analysis - Size, Share, and Forecast Outlook 2025 to 2035
Positive Displacement Sanitary Pumps Market Size and Share Forecast Outlook 2025 to 2035
Postnatal Probiotic Supplements Market Size and Share Forecast Outlook 2025 to 2035
Postoperative Pain Market Size and Share Forecast Outlook 2025 to 2035
Post-Harvest Treatment Market Size and Share Forecast Outlook 2025 to 2035
Post-Consumer Recycled (PCR) Plastic Packaging Market Analysis Size, Share & Forecast 2025 to 2035
Posture Correction Market Size and Share Forecast Outlook 2025 to 2035

Thank you!
You will receive an email from our Business Development Manager. Please be sure to check your SPAM/JUNK folder too.
Chat With
MaRIA