Reports

- Global Locations -

Headquarters

Future Market Insights, Inc.

Christiana Corporate, 200
Continental Drive, Suite 401,
Newark, Delaware - 19713,
United States

T: +1-845-579-5705

Americas

Future Market Insights, Inc.

616 Corporate Way, Suite 2-9018,
Valley Cottage, NY 10989, United States

T: +1-347-918-3531

MEA

Future Market Insights

1602-6 Jumeirah Bay X2 Tower, Plot No: JLT-PH2-X2A,
Jumeirah Lakes Towers, Dubai,
United Arab Emirates

Europe

Future Market Insights

3rd Floor, 207 Regent Street,
W1B 3HH London
United Kingdom

T: + 44 (0) 20 8123 9659
D: +44 (0) 20 3287 4268

Asia Pacific

Future Market Insights

IndiaLand Global Tech Park, Unit UG-1, Behind Grand HighStreet, Phase 1, Hinjawadi, MH, Pune – 411057, India

Post-Operative Cataract Surgery Inflammation Treatment Market Snapshot (2023 to 2033)

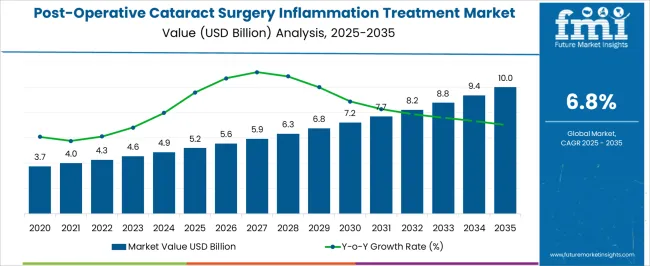
The global post-operative cataract surgery inflammation treatment market is slated to reach a valuation of US$ 4.56 billion in 2023. According to Future Market Insights, the market is expected to grow at a 6.77% CAGR until 2033, valued at US$ 8.78 billion.

Post-operative cataract surgeries are driven mainly by the aging population and the increased prevalence of ocular disorders resulting in higher demand for cataract surgery devices. The increasing demand in the global cataract market is a replication of the growing elderly population, as people aged over 60 years frequently develop conditions in which eyes have reduced elasticity, and in turn, it affects normal functioning. This boosts market growth.

The rise in the number of cortical necrosis therapeutics being delivered through retail pharmacies and the surge in the number of retail pharmacies in developed countries create opportunities for market growth. In addition to this, patients prefer retail pharmacies for purchasing drugs, as these are easily accessible.

The lack of qualified personnel who are unable to treat the patients with appropriate treatments could curb the growth of the global cataracts market over a forecast period. The huge expenditure associated with the treatment of cataracts surely hampers market growth. The high cost of cataract surgery, mainly in developing countries such as India, Brazil, South Africa, and China restrains the global market.

Attributes Details
Base year Market Value (2022) US$ 4.045 billion
Projected Forecast Value (2023) US$ 4.56 billion
Projected Forecast Value (2033) US$ 8.78 billion
Growth rate 6.77%
Forecast period 2023 to 2033

Don't pay for what you don't need

Customize your report by selecting specific countries or regions and save 30%!

Post-Operative Cataract Surgery Inflammation Treatment Market Historical Period 2018 To 2022 Demand Analysis Vs. Forecast 2023

The global post-operative cataract surgery inflammation treatment grew at a CAGR of 6.45% from 2018 to 2022, as per Future Market Insights, a provider of market research and competitive intelligence. Historically, the choice of intraocular lenses (IOLs) is a field that has seen great improvement. Optical biometers were then available and had become more affordable, providing more accurate measurements than those provided by ultrasonography, by reaching optimal accuracy even in dense and advanced cataracts.

Also, artificial intelligence was used for enhancing the precision of IOL calculations and personalized approaches for both patients and surgeons. Postoperative adjustment of IOL power had become available with the introduction of novel IOL technologies. The progress in evaluating the anterior surface and the tear apparatus has shown that tear dysfunction can significantly affect surgical outcomes, including producing a less precise IOL calculation and a longer postoperative recovery.

But nowadays, the current study is the first to compare intracanalicular dexamethasone directly to topical steroids after cataract surgery. Importantly, the study showed that the safety and efficacy of the two approaches were similar. The rates of breakthrough inflammation reported for both groups were similar to those reported by previous studies where more than half of the patients experiencing breakthrough inflammation admitted poor compliance or anxiety over administering drops.

Although, the investigators of the current study have noted that patients should be counseled on possible epiphora in the postoperative period where two of 24 patients have been experiencing canalicular obstruction with an intracanalicular dexamethasone ophthalmic insert.

Prominent Growth Drivers Influencing Post-Operative Cataract Surgery Inflammation Treatment Market

Rising prevalence of ophthalmic disorders & ocular pains

Ophthalmic disorders are the vital cause of major ocular and orbital pains in the eye. Ocular pain occurs over the surface of the eyes along with symptoms such as scratching, burning, or itching sensation. This may be due to multiple reasons, including irritation from foreign objects, infection, or trauma. Eyelashes or pieces of dirt, smoke, dust, or some harsh eye cosmetics are the common causes leading to ocular pain, redness, and watery eyes.

The prevalence of ocular pain keeps showing a surge in growth as chemical industries and pollution around the world are growing. Chemical burns and flash burns cause significant and severe ocular pain due to irritations over the eye surface. Style and blepharitis lead to severe ocular pain as they cause eye and oil glands to be more sensitive around the area.

A rise in traumatic injuries

Traumatic head injury is one of the causes of such disorders as optic nerve disorders. A traumatic injury is a physical injury that occurs suddenly with a certain degree of severity. Trauma can be caused by a variety of external injuries. The most common causes of traumatic injury include road accidents, sports injuries, and violence, among others which can lead to some serious eye disorders as well. The prevalence of such traumatic injuries is highly seen worldwide.

Hence, such traumatic injuries lead to optic nerve disorders, which are affecting the population in these years and it is increasing with the rising population. Therefore, a rise in traumatic injuries is expected to drive market growth.

Sabyasachi Ghosh
Sabyasachi Ghosh

Principal Consultant

Talk to Analyst

Find your sweet spots for generating winning opportunities in this market.

What Could Possibly Hinder Post-Operative Cataract Surgery Inflammation Treatment Market Demand?

High cost & risks associated with eye surgery & treatment

The cost of the various disorders treatment plays a major role in the market. The optic nerve disorders treatments are highly sophisticated, as the prevalence of such disorders is increasing; hence the need for such products has eventually raised, thereby raising the treatment cost, which can hinder the market growth in the coming years.

There are various methods for the treatment of optic neuritis disorder. Some of them are patients can take various medicines such as corticosteroids like methylprednisolone, prednisone, immunoglobulin, vitamin B12 shots, and various other surgeries. With these, there are some risks associated with it.

Therefore, for some of the population around the country, it is difficult for them to undergo such treatments due to the high cost. Hence, the high cost associated with ophthalmic disorders treatment is expected to restrain the market growth.

Lack of skilled professionals

The number of ophthalmologists in both emerging and industrialized countries is minor. However, projections are a little higher for developing countries. The number of ophthalmologists is cumulative but not as fast as the population of elderly patients aged 60 years or older who need to be amplified ophthalmologic care. In most countries, the problem is that demographic changes do not match up with professional development. It is required to train eye care teams to meet the current number of ophthalmologists worldwide. The increased need for ophthalmologists globally also reflects an increase in the cases of diabetes. Diabetic patients should get their eyes inspected every year. The increasing demand for ophthalmologists is directly proportional to the growing geriatric population since eye care is an integral part of healthcare. The access to care gaps can be met by combining factors, including more efficient practice structures, processes, and appropriate use of technology.
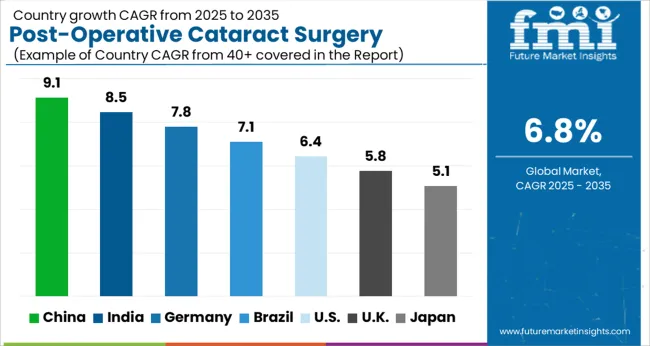
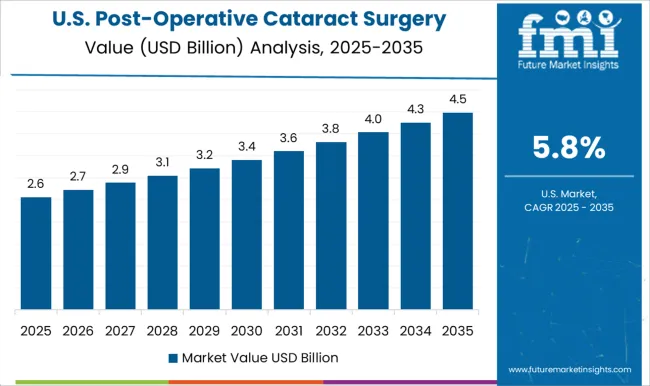
Region-wise Analysis

What Is the Outlook of The North American Post-Operative Cataract Surgery Inflammation Treatment Market?

Growth in the number of surgical procedures

The United States is expected to hold a major share of the market in North America. The major factors bolstering the market's growth are the growing number of surgical procedures, surge in awareness regarding postoperative pain management drugs, increasing number of product approvals, and rising focus on palliative care.

A research study titled "Comparison of Postoperative Pain Management Outcomes in the United States” was published stating that the American Pain Society Patient Outcome Questionnaire-Revised (APS-POQ-R) was completed by 244 patients in the United States with similar surgery sites. The Pain Management Index (PMI) was calculated on their first postoperative day.

Patients in the United States had a higher score on the APS-POQ "perception of pain management" subscale and a larger proportion of acceptable treatment, as assessed by the PMI. Also, higher compliance with pain management recommendations has resulted in higher perceptions among patients. Such statistics are likely to increase the demand for postoperative pain management medications within the country, thereby boosting the market's growth.

Rise in the number of product approvals

Several market players are engaged in implementing strategic initiatives, thereby contributing to the market's growth. In May 2021, Allay Therapeutics, a clinical-stage biotechnology company pioneering ultra-sustained analgesic products to transform postsurgical pain management and recovery, reported the first-ever clinical data showing non-opioid pain relief lasting two weeks after a single administration and Heron Therapeutics, Inc., a commercial-stage biotechnology company focused on developing treatments to address some of the most important unmet patient needs, reported that the United States Food and Drug Administration (FDA) has approved ZYNRELEF (bupivacaine and meloxicam) extended-release solution for use in adults for soft tissue or periarticular instillation to produce postsurgical analgesia for up to 72 hours after a bunionectomy, open inguinal herniorrhaphy, and total knee arthroplasty.

Get the data you need at a Fraction of the cost

Personalize your report by choosing insights you need
and save 40%!

Category-wise Insights

Which Type of Post-Operative Cataract Surgery Inflammation Drug Treatment Market is Most Prevalent?

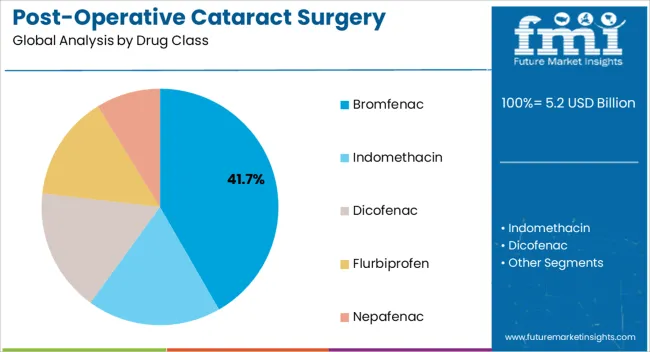
Bromfenac drug gains the dominant market share

Bromfenac ophthalmic solution 0.09% is indicated for the treatment of postoperative inflammation in patients who have undergone cataract extraction.

This is so because, the efficacy and safety of sodium bromfenac eye drop in the treatment of postoperative inflammation of cataract surgery were evaluated by the effective rate, symptom score, adverse reactions, incidence, recurrence rate, etc.

Which route of administration is expected to gain traction from 2023 to 2033?

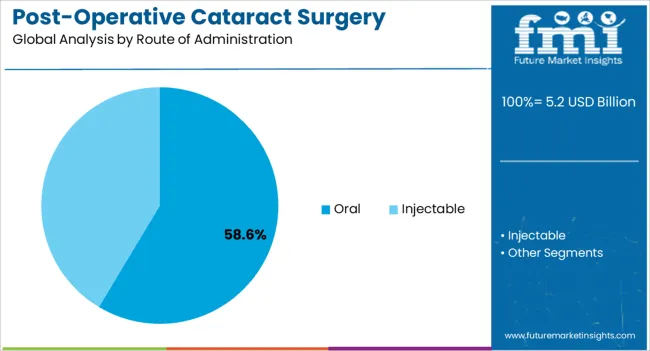
Injections are expected to boost the market share

Intracameral dexamethasone injection in the treatment of cataract surgery-induced inflammation.

Topical ophthalmic drug delivery represents the most popular option among cataract surgeons due to its effectiveness and good safety profile in controlling inflammation after cataract surgery.
Start-up Scenario

  • The United Kingdom -based subsidiary of Japanese ophthalmology firm Santen Pharmaceutical has announced the launch of Ducressa in the UK and Ireland, a fixed-dose combination (FDC) of levofloxacin and dexamethasone for use after cataract surgery that also offers a modern and convenient seven-day therapeutic strategy to optimize post-surgery care. Levofloxacin is a proven broad-spectrum antibiotic and dexamethasone, a potent anti-inflammatory agent, the company noted.
  • Sun Pharmaceutical Industries has received approval from the US health regulator for its non-steroid drug BromSite used to treat inflammation and prevent pain in patients undergoing cataract surgery.

How Competitive is the Market for Post-Operative Cataract Surgery Inflammation Drug Treatment Market Most Prevalent?

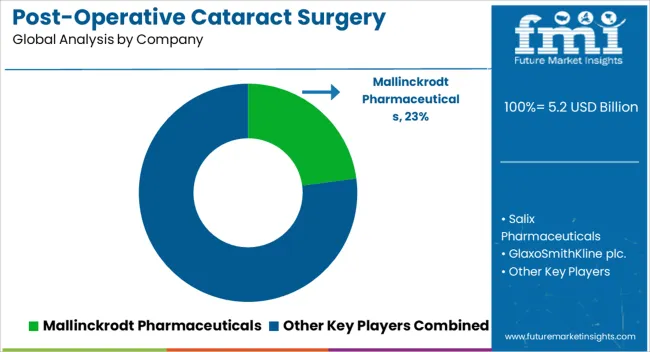
Some of the prominent players in the post-operative cataract surgery inflammation drug treatment market are

  • Mallinckrodt Pharmaceuticals
  • Salix Pharmaceuticals
  • GlaxoSmithKline plc.
  • Pfizer Inc.
  • ASKA Pharmaceutical Co., Ltd.
  • Bausch Health
  • Johnson & Johnson Services, Inc.
  • Janssen Global Services
  • Takeda Pharmaceutical Company Limited
  • Merck & Co., Inc.

Some of the important developments of the key players in the market are

  • In October 2022, Regeneron Pharmaceuticals, Inc. announced the USA. Food and Drug Administration (FDA) has accepted for Priority Review the supplemental Biologics License Application (sBLA) for EYLEA (aflibercept) Injection to treat Retinopathy of Prematurity (ROP) in preterm infants. This development helps the organization in developing its brand image in the ophthalmology market, among others.
  • In May 2022, Reichert, Inc. launched its redesigned refractometers & analytical instruments website with a vastly improved user experience.

Report Scope

Report Attribute Details
Growth Rate CAGR of 6.77% from 2023 to 2033
Market value in 2023 US$ 4.56 Billion
Market value in 2033 US$ 8.78 Billion
Base Year for Estimation 2022
Historical Data 2018 to 2022
Forecast Period 2023 to 2033
Quantitative Units USD Billion for Value and CAGR from 2023 to 2033
Report Coverage Revenue Forecast, Company Ranking, Competitive Landscape, Growth Factors, Trends, and Pricing Analysis
Segments Covered
  • Drug class
  • Route of Administration
  • Distribution Channel
  • Region
Regions Covered
  • North America
  • Latin America
  • Europe
  • South Asia
  • East Asia
  • Oceania
  • Middle East & Africa
Key Countries Profiled
  • United States
  • Canada
  • Brazil
  • Mexico
  • Germany
  • United Kingdom
  • France
  • Spain
  • Italy
  • India
  • Malaysia
  • Singapore
  • Thailand
  • China
  • Japan
  • South Korea
  • Australia
  • New Zealand
  • GCC countries
  • South Africa
  • Israel
Key Companies Profiled
  • Mallinckrodt Pharmaceuticals
  • Salix Pharmaceuticals
  • GlaxoSmithKline plc.
  • Pfizer Inc.
  • ASKA Pharmaceutical Co., Ltd.
  • Bausch Health
  • Johnson & Johnson Services, Inc.
  • Janssen Global Services
  • Takeda Pharmaceutical Company Limited
  • Merck & Co., Inc.
Customization Scope Available on Request

Key Segments Profiled in the Post-Operative Cataract Surgery Inflammation Drug Treatment Market

By Drug Class:

  • Bromfenac
  • Indomethacin
  • Dicofenac
  • Flurbiprofen
  • Nepafenac

By Route of Administration:

  • Oral
  • Injectable

By Distribution Channel:

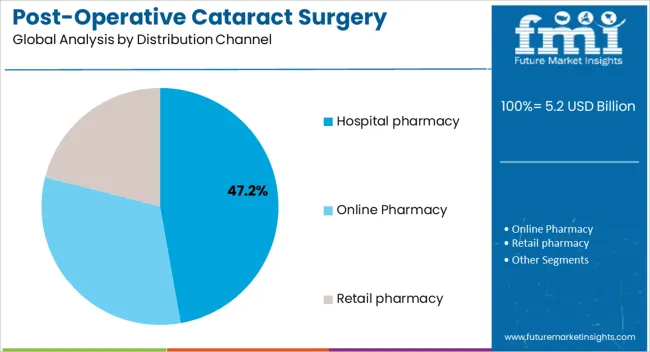
  • Hospital pharmacy
  • Online Pharmacy
  • Retail pharmacy

By Region:

  • North America
  • Latin America
  • Europe
  • South Asia
  • East Asia
  • Oceania
  • Middle East & Africa

Frequently Asked Questions

What is Current Market Valuation?

The market is estimated to secure a valuation of US$ 4.56 billion in 2023.

How Big Will be the Market by 2033?

The market is estimated to reach US$ 8.78 billion by 2033.

What is the Growth Potential of the Market?

Through 2033, the market is anticipated to expand at a 6.77% CAGR.

Which Route of Administration Segment to Lead the Market by 2023?

The market share for Injections segment is going to be the leading segment

Which Drug Class Segment to Lead the Market by 2023?

The bromfenac segment to be the leading segment in the market.

Table of Content

1. Executive Summary | Post-Operative Cataract Surgery Inflammation Treatment Market

    1.1. Global Market Outlook

    1.2. Demand-side Trends

    1.3. Supply-side Trends

    1.4. Technology Roadmap Analysis

    1.5. Analysis and Recommendations

2. Market Overview

    2.1. Market Coverage / Taxonomy

    2.2. Market Definition / Scope / Limitations

3. Market Background

    3.1. Market Dynamics

        3.1.1. Drivers

        3.1.2. Restraints

        3.1.3. Opportunity

        3.1.4. Trends

    3.2. Scenario Forecast

        3.2.1. Demand in Optimistic Scenario

        3.2.2. Demand in Likely Scenario

        3.2.3. Demand in Conservative Scenario

    3.3. Opportunity Map Analysis

    3.4. Investment Feasibility Matrix

    3.5. PESTLE and Porter’s Analysis

    3.6. Regulatory Landscape

        3.6.1. By Key Regions

        3.6.2. By Key Countries

    3.7. Regional Parent Market Outlook

4. Global Market Analysis 2018 to 2022 and Forecast, 2023 to 2033

    4.1. Historical Market Size Value (US$ Million) Analysis, 2018 to 2022

    4.2. Current and Future Market Size Value (US$ Million) Projections, 2023 to 2033

        4.2.1. Y-o-Y Growth Trend Analysis

        4.2.2. Absolute $ Opportunity Analysis

5. Global Market Analysis 2018 to 2022 and Forecast 2023 to 2033, By Drug Class

    5.1. Introduction / Key Findings

    5.2. Historical Market Size Value (US$ Million) Analysis By Drug Class, 2018 to 2022

    5.3. Current and Future Market Size Value (US$ Million) Analysis and Forecast By Drug Class, 2023 to 2033

        5.3.1. Bromfenac

        5.3.2. Indomethacin

        5.3.3. Dicofenac

        5.3.4. Flurbiprofen

        5.3.5. Nepafenac

    5.4. Y-o-Y Growth Trend Analysis By Drug Class, 2018 to 2022

    5.5. Absolute $ Opportunity Analysis By Drug Class, 2023 to 2033

6. Global Market Analysis 2018 to 2022 and Forecast 2023 to 2033, By Route of Administration

    6.1. Introduction / Key Findings

    6.2. Historical Market Size Value (US$ Million) Analysis By Route of Administration, 2018 to 2022

    6.3. Current and Future Market Size Value (US$ Million) Analysis and Forecast By Route of Administration, 2023 to 2033

        6.3.1. Oral

        6.3.2. Injectable

    6.4. Y-o-Y Growth Trend Analysis By Route of Administration, 2018 to 2022

    6.5. Absolute $ Opportunity Analysis By Route of Administration, 2023 to 2033

7. Global Market Analysis 2018 to 2022 and Forecast 2023 to 2033, By Distribution Channel

    7.1. Introduction / Key Findings

    7.2. Historical Market Size Value (US$ Million) Analysis By Distribution Channel, 2018 to 2022

    7.3. Current and Future Market Size Value (US$ Million) Analysis and Forecast By Distribution Channel, 2023 to 2033

        7.3.1. Hospital Pharmacy

        7.3.2. Online Pharmacy

        7.3.3. Retail Pharmacy

    7.4. Y-o-Y Growth Trend Analysis By Distribution Channel, 2018 to 2022

    7.5. Absolute $ Opportunity Analysis By Distribution Channel, 2023 to 2033

8. Global Market Analysis 2018 to 2022 and Forecast 2023 to 2033, By Region

    8.1. Introduction

    8.2. Historical Market Size Value (US$ Million) Analysis By Region, 2018 to 2022

    8.3. Current Market Size Value (US$ Million) Analysis and Forecast By Region, 2023 to 2033

        8.3.1. North America

        8.3.2. Latin America

        8.3.3. Europe

        8.3.4. South Asia

        8.3.5. East Asia

        8.3.6. Oceania

        8.3.7. MEA

    8.4. Market Attractiveness Analysis By Region

9. North America Market Analysis 2018 to 2022 and Forecast 2023 to 2033, By Country

    9.1. Historical Market Size Value (US$ Million) Trend Analysis By Market Taxonomy, 2018 to 2022

    9.2. Market Size Value (US$ Million) Forecast By Market Taxonomy, 2023 to 2033

        9.2.1. By Country

            9.2.1.1. USA

            9.2.1.2. Canada

        9.2.2. By Drug Class

        9.2.3. By Route of Administration

        9.2.4. By Distribution Channel

    9.3. Market Attractiveness Analysis

        9.3.1. By Country

        9.3.2. By Drug Class

        9.3.3. By Route of Administration

        9.3.4. By Distribution Channel

    9.4. Key Takeaways

10. Latin America Market Analysis 2018 to 2022 and Forecast 2023 to 2033, By Country

    10.1. Historical Market Size Value (US$ Million) Trend Analysis By Market Taxonomy, 2018 to 2022

    10.2. Market Size Value (US$ Million) Forecast By Market Taxonomy, 2023 to 2033

        10.2.1. By Country

            10.2.1.1. Brazil

            10.2.1.2. Mexico

            10.2.1.3. Rest of Latin America

        10.2.2. By Drug Class

        10.2.3. By Route of Administration

        10.2.4. By Distribution Channel

    10.3. Market Attractiveness Analysis

        10.3.1. By Country

        10.3.2. By Drug Class

        10.3.3. By Route of Administration

        10.3.4. By Distribution Channel

    10.4. Key Takeaways

11. Europe Market Analysis 2018 to 2022 and Forecast 2023 to 2033, By Country

    11.1. Historical Market Size Value (US$ Million) Trend Analysis By Market Taxonomy, 2018 to 2022

    11.2. Market Size Value (US$ Million) Forecast By Market Taxonomy, 2023 to 2033

        11.2.1. By Country

            11.2.1.1. Germany

            11.2.1.2. United kingdom

            11.2.1.3. France

            11.2.1.4. Spain

            11.2.1.5. Italy

            11.2.1.6. Rest of Europe

        11.2.2. By Drug Class

        11.2.3. By Route of Administration

        11.2.4. By Distribution Channel

    11.3. Market Attractiveness Analysis

        11.3.1. By Country

        11.3.2. By Drug Class

        11.3.3. By Route of Administration

        11.3.4. By Distribution Channel

    11.4. Key Takeaways

12. South Asia Market Analysis 2018 to 2022 and Forecast 2023 to 2033, By Country

    12.1. Historical Market Size Value (US$ Million) Trend Analysis By Market Taxonomy, 2018 to 2022

    12.2. Market Size Value (US$ Million) Forecast By Market Taxonomy, 2023 to 2033

        12.2.1. By Country

            12.2.1.1. India

            12.2.1.2. Malaysia

            12.2.1.3. Singapore

            12.2.1.4. Thailand

            12.2.1.5. Rest of South Asia

        12.2.2. By Drug Class

        12.2.3. By Route of Administration

        12.2.4. By Distribution Channel

    12.3. Market Attractiveness Analysis

        12.3.1. By Country

        12.3.2. By Drug Class

        12.3.3. By Route of Administration

        12.3.4. By Distribution Channel

    12.4. Key Takeaways

13. East Asia Market Analysis 2018 to 2022 and Forecast 2023 to 2033, By Country

    13.1. Historical Market Size Value (US$ Million) Trend Analysis By Market Taxonomy, 2018 to 2022

    13.2. Market Size Value (US$ Million) Forecast By Market Taxonomy, 2023 to 2033

        13.2.1. By Country

            13.2.1.1. China

            13.2.1.2. Japan

            13.2.1.3. South Korea

        13.2.2. By Drug Class

        13.2.3. By Route of Administration

        13.2.4. By Distribution Channel

    13.3. Market Attractiveness Analysis

        13.3.1. By Country

        13.3.2. By Drug Class

        13.3.3. By Route of Administration

        13.3.4. By Distribution Channel

    13.4. Key Takeaways

14. Oceania Market Analysis 2018 to 2022 and Forecast 2023 to 2033, By Country

    14.1. Historical Market Size Value (US$ Million) Trend Analysis By Market Taxonomy, 2018 to 2022

    14.2. Market Size Value (US$ Million) Forecast By Market Taxonomy, 2023 to 2033

        14.2.1. By Country

            14.2.1.1. Australia

            14.2.1.2. New Zealand

        14.2.2. By Drug Class

        14.2.3. By Route of Administration

        14.2.4. By Distribution Channel

    14.3. Market Attractiveness Analysis

        14.3.1. By Country

        14.3.2. By Drug Class

        14.3.3. By Route of Administration

        14.3.4. By Distribution Channel

    14.4. Key Takeaways

15. MEA Market Analysis 2018 to 2022 and Forecast 2023 to 2033, By Country

    15.1. Historical Market Size Value (US$ Million) Trend Analysis By Market Taxonomy, 2018 to 2022

    15.2. Market Size Value (US$ Million) Forecast By Market Taxonomy, 2023 to 2033

        15.2.1. By Country

            15.2.1.1. GCC Countries

            15.2.1.2. South Africa

            15.2.1.3. Israel

            15.2.1.4. Rest of MEA

        15.2.2. By Drug Class

        15.2.3. By Route of Administration

        15.2.4. By Distribution Channel

    15.3. Market Attractiveness Analysis

        15.3.1. By Country

        15.3.2. By Drug Class

        15.3.3. By Route of Administration

        15.3.4. By Distribution Channel

    15.4. Key Takeaways

16. Key Countries Market Analysis

    16.1. USA

        16.1.1. Pricing Analysis

        16.1.2. Market Share Analysis, 2022

            16.1.2.1. By Drug Class

            16.1.2.2. By Route of Administration

            16.1.2.3. By Distribution Channel

    16.2. Canada

        16.2.1. Pricing Analysis

        16.2.2. Market Share Analysis, 2022

            16.2.2.1. By Drug Class

            16.2.2.2. By Route of Administration

            16.2.2.3. By Distribution Channel

    16.3. Brazil

        16.3.1. Pricing Analysis

        16.3.2. Market Share Analysis, 2022

            16.3.2.1. By Drug Class

            16.3.2.2. By Route of Administration

            16.3.2.3. By Distribution Channel

    16.4. Mexico

        16.4.1. Pricing Analysis

        16.4.2. Market Share Analysis, 2022

            16.4.2.1. By Drug Class

            16.4.2.2. By Route of Administration

            16.4.2.3. By Distribution Channel

    16.5. Germany

        16.5.1. Pricing Analysis

        16.5.2. Market Share Analysis, 2022

            16.5.2.1. By Drug Class

            16.5.2.2. By Route of Administration

            16.5.2.3. By Distribution Channel

    16.6. United kingdom

        16.6.1. Pricing Analysis

        16.6.2. Market Share Analysis, 2022

            16.6.2.1. By Drug Class

            16.6.2.2. By Route of Administration

            16.6.2.3. By Distribution Channel

    16.7. France

        16.7.1. Pricing Analysis

        16.7.2. Market Share Analysis, 2022

            16.7.2.1. By Drug Class

            16.7.2.2. By Route of Administration

            16.7.2.3. By Distribution Channel

    16.8. Spain

        16.8.1. Pricing Analysis

        16.8.2. Market Share Analysis, 2022

            16.8.2.1. By Drug Class

            16.8.2.2. By Route of Administration

            16.8.2.3. By Distribution Channel

    16.9. Italy

        16.9.1. Pricing Analysis

        16.9.2. Market Share Analysis, 2022

            16.9.2.1. By Drug Class

            16.9.2.2. By Route of Administration

            16.9.2.3. By Distribution Channel

    16.10. India

        16.10.1. Pricing Analysis

        16.10.2. Market Share Analysis, 2022

            16.10.2.1. By Drug Class

            16.10.2.2. By Route of Administration

            16.10.2.3. By Distribution Channel

    16.11. Malaysia

        16.11.1. Pricing Analysis

        16.11.2. Market Share Analysis, 2022

            16.11.2.1. By Drug Class

            16.11.2.2. By Route of Administration

            16.11.2.3. By Distribution Channel

    16.12. Singapore

        16.12.1. Pricing Analysis

        16.12.2. Market Share Analysis, 2022

            16.12.2.1. By Drug Class

            16.12.2.2. By Route of Administration

            16.12.2.3. By Distribution Channel

    16.13. Thailand

        16.13.1. Pricing Analysis

        16.13.2. Market Share Analysis, 2022

            16.13.2.1. By Drug Class

            16.13.2.2. By Route of Administration

            16.13.2.3. By Distribution Channel

    16.14. China

        16.14.1. Pricing Analysis

        16.14.2. Market Share Analysis, 2022

            16.14.2.1. By Drug Class

            16.14.2.2. By Route of Administration

            16.14.2.3. By Distribution Channel

    16.15. Japan

        16.15.1. Pricing Analysis

        16.15.2. Market Share Analysis, 2022

            16.15.2.1. By Drug Class

            16.15.2.2. By Route of Administration

            16.15.2.3. By Distribution Channel

    16.16. South Korea

        16.16.1. Pricing Analysis

        16.16.2. Market Share Analysis, 2022

            16.16.2.1. By Drug Class

            16.16.2.2. By Route of Administration

            16.16.2.3. By Distribution Channel

    16.17. Australia

        16.17.1. Pricing Analysis

        16.17.2. Market Share Analysis, 2022

            16.17.2.1. By Drug Class

            16.17.2.2. By Route of Administration

            16.17.2.3. By Distribution Channel

    16.18. New Zealand

        16.18.1. Pricing Analysis

        16.18.2. Market Share Analysis, 2022

            16.18.2.1. By Drug Class

            16.18.2.2. By Route of Administration

            16.18.2.3. By Distribution Channel

    16.19. GCC Countries

        16.19.1. Pricing Analysis

        16.19.2. Market Share Analysis, 2022

            16.19.2.1. By Drug Class

            16.19.2.2. By Route of Administration

            16.19.2.3. By Distribution Channel

    16.20. South Africa

        16.20.1. Pricing Analysis

        16.20.2. Market Share Analysis, 2022

            16.20.2.1. By Drug Class

            16.20.2.2. By Route of Administration

            16.20.2.3. By Distribution Channel

    16.21. Israel

        16.21.1. Pricing Analysis

        16.21.2. Market Share Analysis, 2022

            16.21.2.1. By Drug Class

            16.21.2.2. By Route of Administration

            16.21.2.3. By Distribution Channel

17. Market Structure Analysis

    17.1. Competition Dashboard

    17.2. Competition Benchmarking

    17.3. Market Share Analysis of Top Players

        17.3.1. By Regional

        17.3.2. By Drug Class

        17.3.3. By Route of Administration

        17.3.4. By Distribution Channel

18. Competition Analysis

    18.1. Competition Deep Dive

        18.1.1. Mallinckrodt Pharmaceuticals

            18.1.1.1. Overview

            18.1.1.2. Product Portfolio

            18.1.1.3. Profitability by Market Segments

            18.1.1.4. Sales Footprint

            18.1.1.5. Strategy Overview

                18.1.1.5.1. Marketing Strategy

        18.1.2. Salix Pharmaceuticals

            18.1.2.1. Overview

            18.1.2.2. Product Portfolio

            18.1.2.3. Profitability by Market Segments

            18.1.2.4. Sales Footprint

            18.1.2.5. Strategy Overview

                18.1.2.5.1. Marketing Strategy

        18.1.3. GlaxoSmithKline plc.

            18.1.3.1. Overview

            18.1.3.2. Product Portfolio

            18.1.3.3. Profitability by Market Segments

            18.1.3.4. Sales Footprint

            18.1.3.5. Strategy Overview

                18.1.3.5.1. Marketing Strategy

        18.1.4. Pfizer Inc.

            18.1.4.1. Overview

            18.1.4.2. Product Portfolio

            18.1.4.3. Profitability by Market Segments

            18.1.4.4. Sales Footprint

            18.1.4.5. Strategy Overview

                18.1.4.5.1. Marketing Strategy

        18.1.5. ASKA Pharmaceutical Co., Ltd.

            18.1.5.1. Overview

            18.1.5.2. Product Portfolio

            18.1.5.3. Profitability by Market Segments

            18.1.5.4. Sales Footprint

            18.1.5.5. Strategy Overview

                18.1.5.5.1. Marketing Strategy

        18.1.6. Bausch Health

            18.1.6.1. Overview

            18.1.6.2. Product Portfolio

            18.1.6.3. Profitability by Market Segments

            18.1.6.4. Sales Footprint

            18.1.6.5. Strategy Overview

                18.1.6.5.1. Marketing Strategy

        18.1.7. Johnson & Johnson Services, Inc.

            18.1.7.1. Overview

            18.1.7.2. Product Portfolio

            18.1.7.3. Profitability by Market Segments

            18.1.7.4. Sales Footprint

            18.1.7.5. Strategy Overview

                18.1.7.5.1. Marketing Strategy

        18.1.8. Janssen Global Services

            18.1.8.1. Overview

            18.1.8.2. Product Portfolio

            18.1.8.3. Profitability by Market Segments

            18.1.8.4. Sales Footprint

            18.1.8.5. Strategy Overview

                18.1.8.5.1. Marketing Strategy

        18.1.9. Takeda Pharmaceutical Company Limited

            18.1.9.1. Overview

            18.1.9.2. Product Portfolio

            18.1.9.3. Profitability by Market Segments

            18.1.9.4. Sales Footprint

            18.1.9.5. Strategy Overview

                18.1.9.5.1. Marketing Strategy

        18.1.10. Merck & Co., Inc.

            18.1.10.1. Overview

            18.1.10.2. Product Portfolio

            18.1.10.3. Profitability by Market Segments

            18.1.10.4. Sales Footprint

            18.1.10.5. Strategy Overview

                18.1.10.5.1. Marketing Strategy

19. Assumptions & Acronyms Used

20. Research Methodology

List of Tables

Table 1: Global Market Value (US$ Million) Forecast by Region, 2018 to 2033

Table 2: Global Market Value (US$ Million) Forecast by Drug Class, 2018 to 2033

Table 3: Global Market Value (US$ Million) Forecast by Route of Administration, 2018 to 2033

Table 4: Global Market Value (US$ Million) Forecast by Distribution Channel, 2018 to 2033

Table 5: North America Market Value (US$ Million) Forecast by Country, 2018 to 2033

Table 6: North America Market Value (US$ Million) Forecast by Drug Class, 2018 to 2033

Table 7: North America Market Value (US$ Million) Forecast by Route of Administration, 2018 to 2033

Table 8: North America Market Value (US$ Million) Forecast by Distribution Channel, 2018 to 2033

Table 9: Latin America Market Value (US$ Million) Forecast by Country, 2018 to 2033

Table 10: Latin America Market Value (US$ Million) Forecast by Drug Class, 2018 to 2033

Table 11: Latin America Market Value (US$ Million) Forecast by Route of Administration, 2018 to 2033

Table 12: Latin America Market Value (US$ Million) Forecast by Distribution Channel, 2018 to 2033

Table 13: Europe Market Value (US$ Million) Forecast by Country, 2018 to 2033

Table 14: Europe Market Value (US$ Million) Forecast by Drug Class, 2018 to 2033

Table 15: Europe Market Value (US$ Million) Forecast by Route of Administration, 2018 to 2033

Table 16: Europe Market Value (US$ Million) Forecast by Distribution Channel, 2018 to 2033

Table 17: South Asia Market Value (US$ Million) Forecast by Country, 2018 to 2033

Table 18: South Asia Market Value (US$ Million) Forecast by Drug Class, 2018 to 2033

Table 19: South Asia Market Value (US$ Million) Forecast by Route of Administration, 2018 to 2033

Table 20: South Asia Market Value (US$ Million) Forecast by Distribution Channel, 2018 to 2033

Table 21: East Asia Market Value (US$ Million) Forecast by Country, 2018 to 2033

Table 22: East Asia Market Value (US$ Million) Forecast by Drug Class, 2018 to 2033

Table 23: East Asia Market Value (US$ Million) Forecast by Route of Administration, 2018 to 2033

Table 24: East Asia Market Value (US$ Million) Forecast by Distribution Channel, 2018 to 2033

Table 25: Oceania Market Value (US$ Million) Forecast by Country, 2018 to 2033

Table 26: Oceania Market Value (US$ Million) Forecast by Drug Class, 2018 to 2033

Table 27: Oceania Market Value (US$ Million) Forecast by Route of Administration, 2018 to 2033

Table 28: Oceania Market Value (US$ Million) Forecast by Distribution Channel, 2018 to 2033

Table 29: MEA Market Value (US$ Million) Forecast by Country, 2018 to 2033

Table 30: MEA Market Value (US$ Million) Forecast by Drug Class, 2018 to 2033

Table 31: MEA Market Value (US$ Million) Forecast by Route of Administration, 2018 to 2033

Table 32: MEA Market Value (US$ Million) Forecast by Distribution Channel, 2018 to 2033

List of Charts

Figure 1: Global Market Value (US$ Million) by Drug Class, 2023 to 2033

Figure 2: Global Market Value (US$ Million) by Route of Administration, 2023 to 2033

Figure 3: Global Market Value (US$ Million) by Distribution Channel, 2023 to 2033

Figure 4: Global Market Value (US$ Million) by Region, 2023 to 2033

Figure 5: Global Market Value (US$ Million) Analysis by Region, 2018 to 2033

Figure 6: Global Market Value Share (%) and BPS Analysis by Region, 2023 to 2033

Figure 7: Global Market Y-o-Y Growth (%) Projections by Region, 2023 to 2033

Figure 8: Global Market Value (US$ Million) Analysis by Drug Class, 2018 to 2033

Figure 9: Global Market Value Share (%) and BPS Analysis by Drug Class, 2023 to 2033

Figure 10: Global Market Y-o-Y Growth (%) Projections by Drug Class, 2023 to 2033

Figure 11: Global Market Value (US$ Million) Analysis by Route of Administration, 2018 to 2033

Figure 12: Global Market Value Share (%) and BPS Analysis by Route of Administration, 2023 to 2033

Figure 13: Global Market Y-o-Y Growth (%) Projections by Route of Administration, 2023 to 2033

Figure 14: Global Market Value (US$ Million) Analysis by Distribution Channel, 2018 to 2033

Figure 15: Global Market Value Share (%) and BPS Analysis by Distribution Channel, 2023 to 2033

Figure 16: Global Market Y-o-Y Growth (%) Projections by Distribution Channel, 2023 to 2033

Figure 17: Global Market Attractiveness by Drug Class, 2023 to 2033

Figure 18: Global Market Attractiveness by Route of Administration, 2023 to 2033

Figure 19: Global Market Attractiveness by Distribution Channel, 2023 to 2033

Figure 20: Global Market Attractiveness by Region, 2023 to 2033

Figure 21: North America Market Value (US$ Million) by Drug Class, 2023 to 2033

Figure 22: North America Market Value (US$ Million) by Route of Administration, 2023 to 2033

Figure 23: North America Market Value (US$ Million) by Distribution Channel, 2023 to 2033

Figure 24: North America Market Value (US$ Million) by Country, 2023 to 2033

Figure 25: North America Market Value (US$ Million) Analysis by Country, 2018 to 2033

Figure 26: North America Market Value Share (%) and BPS Analysis by Country, 2023 to 2033

Figure 27: North America Market Y-o-Y Growth (%) Projections by Country, 2023 to 2033

Figure 28: North America Market Value (US$ Million) Analysis by Drug Class, 2018 to 2033

Figure 29: North America Market Value Share (%) and BPS Analysis by Drug Class, 2023 to 2033

Figure 30: North America Market Y-o-Y Growth (%) Projections by Drug Class, 2023 to 2033

Figure 31: North America Market Value (US$ Million) Analysis by Route of Administration, 2018 to 2033

Figure 32: North America Market Value Share (%) and BPS Analysis by Route of Administration, 2023 to 2033

Figure 33: North America Market Y-o-Y Growth (%) Projections by Route of Administration, 2023 to 2033

Figure 34: North America Market Value (US$ Million) Analysis by Distribution Channel, 2018 to 2033

Figure 35: North America Market Value Share (%) and BPS Analysis by Distribution Channel, 2023 to 2033

Figure 36: North America Market Y-o-Y Growth (%) Projections by Distribution Channel, 2023 to 2033

Figure 37: North America Market Attractiveness by Drug Class, 2023 to 2033

Figure 38: North America Market Attractiveness by Route of Administration, 2023 to 2033

Figure 39: North America Market Attractiveness by Distribution Channel, 2023 to 2033

Figure 40: North America Market Attractiveness by Country, 2023 to 2033

Figure 41: Latin America Market Value (US$ Million) by Drug Class, 2023 to 2033

Figure 42: Latin America Market Value (US$ Million) by Route of Administration, 2023 to 2033

Figure 43: Latin America Market Value (US$ Million) by Distribution Channel, 2023 to 2033

Figure 44: Latin America Market Value (US$ Million) by Country, 2023 to 2033

Figure 45: Latin America Market Value (US$ Million) Analysis by Country, 2018 to 2033

Figure 46: Latin America Market Value Share (%) and BPS Analysis by Country, 2023 to 2033

Figure 47: Latin America Market Y-o-Y Growth (%) Projections by Country, 2023 to 2033

Figure 48: Latin America Market Value (US$ Million) Analysis by Drug Class, 2018 to 2033

Figure 49: Latin America Market Value Share (%) and BPS Analysis by Drug Class, 2023 to 2033

Figure 50: Latin America Market Y-o-Y Growth (%) Projections by Drug Class, 2023 to 2033

Figure 51: Latin America Market Value (US$ Million) Analysis by Route of Administration, 2018 to 2033

Figure 52: Latin America Market Value Share (%) and BPS Analysis by Route of Administration, 2023 to 2033

Figure 53: Latin America Market Y-o-Y Growth (%) Projections by Route of Administration, 2023 to 2033

Figure 54: Latin America Market Value (US$ Million) Analysis by Distribution Channel, 2018 to 2033

Figure 55: Latin America Market Value Share (%) and BPS Analysis by Distribution Channel, 2023 to 2033

Figure 56: Latin America Market Y-o-Y Growth (%) Projections by Distribution Channel, 2023 to 2033

Figure 57: Latin America Market Attractiveness by Drug Class, 2023 to 2033

Figure 58: Latin America Market Attractiveness by Route of Administration, 2023 to 2033

Figure 59: Latin America Market Attractiveness by Distribution Channel, 2023 to 2033

Figure 60: Latin America Market Attractiveness by Country, 2023 to 2033

Figure 61: Europe Market Value (US$ Million) by Drug Class, 2023 to 2033

Figure 62: Europe Market Value (US$ Million) by Route of Administration, 2023 to 2033

Figure 63: Europe Market Value (US$ Million) by Distribution Channel, 2023 to 2033

Figure 64: Europe Market Value (US$ Million) by Country, 2023 to 2033

Figure 65: Europe Market Value (US$ Million) Analysis by Country, 2018 to 2033

Figure 66: Europe Market Value Share (%) and BPS Analysis by Country, 2023 to 2033

Figure 67: Europe Market Y-o-Y Growth (%) Projections by Country, 2023 to 2033

Figure 68: Europe Market Value (US$ Million) Analysis by Drug Class, 2018 to 2033

Figure 69: Europe Market Value Share (%) and BPS Analysis by Drug Class, 2023 to 2033

Figure 70: Europe Market Y-o-Y Growth (%) Projections by Drug Class, 2023 to 2033

Figure 71: Europe Market Value (US$ Million) Analysis by Route of Administration, 2018 to 2033

Figure 72: Europe Market Value Share (%) and BPS Analysis by Route of Administration, 2023 to 2033

Figure 73: Europe Market Y-o-Y Growth (%) Projections by Route of Administration, 2023 to 2033

Figure 74: Europe Market Value (US$ Million) Analysis by Distribution Channel, 2018 to 2033

Figure 75: Europe Market Value Share (%) and BPS Analysis by Distribution Channel, 2023 to 2033

Figure 76: Europe Market Y-o-Y Growth (%) Projections by Distribution Channel, 2023 to 2033

Figure 77: Europe Market Attractiveness by Drug Class, 2023 to 2033

Figure 78: Europe Market Attractiveness by Route of Administration, 2023 to 2033

Figure 79: Europe Market Attractiveness by Distribution Channel, 2023 to 2033

Figure 80: Europe Market Attractiveness by Country, 2023 to 2033

Figure 81: South Asia Market Value (US$ Million) by Drug Class, 2023 to 2033

Figure 82: South Asia Market Value (US$ Million) by Route of Administration, 2023 to 2033

Figure 83: South Asia Market Value (US$ Million) by Distribution Channel, 2023 to 2033

Figure 84: South Asia Market Value (US$ Million) by Country, 2023 to 2033

Figure 85: South Asia Market Value (US$ Million) Analysis by Country, 2018 to 2033

Figure 86: South Asia Market Value Share (%) and BPS Analysis by Country, 2023 to 2033

Figure 87: South Asia Market Y-o-Y Growth (%) Projections by Country, 2023 to 2033

Figure 88: South Asia Market Value (US$ Million) Analysis by Drug Class, 2018 to 2033

Figure 89: South Asia Market Value Share (%) and BPS Analysis by Drug Class, 2023 to 2033

Figure 90: South Asia Market Y-o-Y Growth (%) Projections by Drug Class, 2023 to 2033

Figure 91: South Asia Market Value (US$ Million) Analysis by Route of Administration, 2018 to 2033

Figure 92: South Asia Market Value Share (%) and BPS Analysis by Route of Administration, 2023 to 2033

Figure 93: South Asia Market Y-o-Y Growth (%) Projections by Route of Administration, 2023 to 2033

Figure 94: South Asia Market Value (US$ Million) Analysis by Distribution Channel, 2018 to 2033

Figure 95: South Asia Market Value Share (%) and BPS Analysis by Distribution Channel, 2023 to 2033

Figure 96: South Asia Market Y-o-Y Growth (%) Projections by Distribution Channel, 2023 to 2033

Figure 97: South Asia Market Attractiveness by Drug Class, 2023 to 2033

Figure 98: South Asia Market Attractiveness by Route of Administration, 2023 to 2033

Figure 99: South Asia Market Attractiveness by Distribution Channel, 2023 to 2033

Figure 100: South Asia Market Attractiveness by Country, 2023 to 2033

Figure 101: East Asia Market Value (US$ Million) by Drug Class, 2023 to 2033

Figure 102: East Asia Market Value (US$ Million) by Route of Administration, 2023 to 2033

Figure 103: East Asia Market Value (US$ Million) by Distribution Channel, 2023 to 2033

Figure 104: East Asia Market Value (US$ Million) by Country, 2023 to 2033

Figure 105: East Asia Market Value (US$ Million) Analysis by Country, 2018 to 2033

Figure 106: East Asia Market Value Share (%) and BPS Analysis by Country, 2023 to 2033

Figure 107: East Asia Market Y-o-Y Growth (%) Projections by Country, 2023 to 2033

Figure 108: East Asia Market Value (US$ Million) Analysis by Drug Class, 2018 to 2033

Figure 109: East Asia Market Value Share (%) and BPS Analysis by Drug Class, 2023 to 2033

Figure 110: East Asia Market Y-o-Y Growth (%) Projections by Drug Class, 2023 to 2033

Figure 111: East Asia Market Value (US$ Million) Analysis by Route of Administration, 2018 to 2033

Figure 112: East Asia Market Value Share (%) and BPS Analysis by Route of Administration, 2023 to 2033

Figure 113: East Asia Market Y-o-Y Growth (%) Projections by Route of Administration, 2023 to 2033

Figure 114: East Asia Market Value (US$ Million) Analysis by Distribution Channel, 2018 to 2033

Figure 115: East Asia Market Value Share (%) and BPS Analysis by Distribution Channel, 2023 to 2033

Figure 116: East Asia Market Y-o-Y Growth (%) Projections by Distribution Channel, 2023 to 2033

Figure 117: East Asia Market Attractiveness by Drug Class, 2023 to 2033

Figure 118: East Asia Market Attractiveness by Route of Administration, 2023 to 2033

Figure 119: East Asia Market Attractiveness by Distribution Channel, 2023 to 2033

Figure 120: East Asia Market Attractiveness by Country, 2023 to 2033

Figure 121: Oceania Market Value (US$ Million) by Drug Class, 2023 to 2033

Figure 122: Oceania Market Value (US$ Million) by Route of Administration, 2023 to 2033

Figure 123: Oceania Market Value (US$ Million) by Distribution Channel, 2023 to 2033

Figure 124: Oceania Market Value (US$ Million) by Country, 2023 to 2033

Figure 125: Oceania Market Value (US$ Million) Analysis by Country, 2018 to 2033

Figure 126: Oceania Market Value Share (%) and BPS Analysis by Country, 2023 to 2033

Figure 127: Oceania Market Y-o-Y Growth (%) Projections by Country, 2023 to 2033

Figure 128: Oceania Market Value (US$ Million) Analysis by Drug Class, 2018 to 2033

Figure 129: Oceania Market Value Share (%) and BPS Analysis by Drug Class, 2023 to 2033

Figure 130: Oceania Market Y-o-Y Growth (%) Projections by Drug Class, 2023 to 2033

Figure 131: Oceania Market Value (US$ Million) Analysis by Route of Administration, 2018 to 2033

Figure 132: Oceania Market Value Share (%) and BPS Analysis by Route of Administration, 2023 to 2033

Figure 133: Oceania Market Y-o-Y Growth (%) Projections by Route of Administration, 2023 to 2033

Figure 134: Oceania Market Value (US$ Million) Analysis by Distribution Channel, 2018 to 2033

Figure 135: Oceania Market Value Share (%) and BPS Analysis by Distribution Channel, 2023 to 2033

Figure 136: Oceania Market Y-o-Y Growth (%) Projections by Distribution Channel, 2023 to 2033

Figure 137: Oceania Market Attractiveness by Drug Class, 2023 to 2033

Figure 138: Oceania Market Attractiveness by Route of Administration, 2023 to 2033

Figure 139: Oceania Market Attractiveness by Distribution Channel, 2023 to 2033

Figure 140: Oceania Market Attractiveness by Country, 2023 to 2033

Figure 141: MEA Market Value (US$ Million) by Drug Class, 2023 to 2033

Figure 142: MEA Market Value (US$ Million) by Route of Administration, 2023 to 2033

Figure 143: MEA Market Value (US$ Million) by Distribution Channel, 2023 to 2033

Figure 144: MEA Market Value (US$ Million) by Country, 2023 to 2033

Figure 145: MEA Market Value (US$ Million) Analysis by Country, 2018 to 2033

Figure 146: MEA Market Value Share (%) and BPS Analysis by Country, 2023 to 2033

Figure 147: MEA Market Y-o-Y Growth (%) Projections by Country, 2023 to 2033

Figure 148: MEA Market Value (US$ Million) Analysis by Drug Class, 2018 to 2033

Figure 149: MEA Market Value Share (%) and BPS Analysis by Drug Class, 2023 to 2033

Figure 150: MEA Market Y-o-Y Growth (%) Projections by Drug Class, 2023 to 2033

Figure 151: MEA Market Value (US$ Million) Analysis by Route of Administration, 2018 to 2033

Figure 152: MEA Market Value Share (%) and BPS Analysis by Route of Administration, 2023 to 2033

Figure 153: MEA Market Y-o-Y Growth (%) Projections by Route of Administration, 2023 to 2033

Figure 154: MEA Market Value (US$ Million) Analysis by Distribution Channel, 2018 to 2033

Figure 155: MEA Market Value Share (%) and BPS Analysis by Distribution Channel, 2023 to 2033

Figure 156: MEA Market Y-o-Y Growth (%) Projections by Distribution Channel, 2023 to 2033

Figure 157: MEA Market Attractiveness by Drug Class, 2023 to 2033

Figure 158: MEA Market Attractiveness by Route of Administration, 2023 to 2033

Figure 159: MEA Market Attractiveness by Distribution Channel, 2023 to 2033

Figure 160: MEA Market Attractiveness by Country, 2023 to 2033

Recommendations

Healthcare

Cataract Surgery Device Market

Published : March 2024

Explore Healthcare Insights

View Reports

Post-Operative Cataract Surgery Inflammation Treatment Market