Postbiotic Feed Additives Market Size and Share Forecast Outlook 2025 to 2035

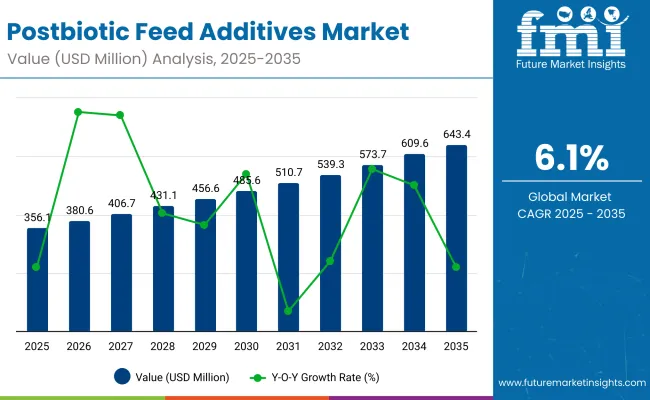
The Postbiotic Feed Additives Market is expected to record a valuation of USD 0.36 billion in 2025 and USD 0.64 billion in 2035, with an increase of USD 0.28 billion, which equals a growth of 77.9% over the decade. The overall expansion represents a CAGR of 6.1% and a near 1.8X increase in market size.
Quick Stats for Postbiotic Feed Additives Market

  • Postbiotic Feed Additives Market Value (2025): USD 0.36 billion
  • Postbiotic Feed Additives Market Forecast Value (2035): USD 0.64 billion
  • Postbiotic Feed Additives Market Forecast CAGR: 6.1%
  • Leading Segment in 2025: Inactivated Microbial Cells (17.8%)
  • Key Growth Regions: North America, Asia-Pacific, Europe
  • Top Key Players: Cargill, ADM, Evonik Industries, Kerry Group, Royal DSM-Firmenich, Novus International, Alltech, Adisseo, Lallemand Animal Nutrition, Arm & Hammer Animal and Food Production

Postbiotic Feed Additives Market

Postbiotic Feed Additives Market Key Takeaways

Metric Value
Market Estimated Value in (2025E) USD 0.3561 billion
Market Forecast Value in (2035F) USD 3.61 billion
Forecast CAGR (2025 to 2035) 6.2%

During the first five-year period from 2025 to 2030, the market increases from USD 0.36 billion to USD 0.49 billion, adding USD 0.13 billion, which accounts for 46.4% of the total decade growth. This phase records steady adoption in poultry and swine feed, driven by the need to replace antibiotic growth promoters, improve gut health, and optimize nutrient absorption. Inactivated microbial cells dominate this period as they account for nearly 18% of the total market, offering a stable and effective solution for feed formulations.

The second half from 2030 to 2035 contributes USD 0.15 billion, equal to 53.6% of total growth, as the market jumps from USD 0.49 billion to USD 0.64 billion. This acceleration is powered by increased integration of metabolite-based postbiotics, cell-free supernatants, and fermentation extracts into livestock diets. Aquaculture and ruminant applications rise significantly, while microbial-derived sources continue to dominate. Specialty blends that combine postbiotics with probiotics and organic acids create new opportunities, pushing adoption further. By the end of the decade, regional demand is led by North America (30%) and Europe (28%), supported by regulatory mandates and sustainable livestock production initiatives.

From 2020 to 2024, the Postbiotic Feed Additives Market expanded steadily, supported by the replacement of antibiotic growth promoters (AGPs) and rising demand for gut-health enhancers in poultry and swine. During this period, the competitive landscape was dominated by multinational feed additive suppliers controlling nearly 70-75% of revenues, with leaders such as Cargill, DSM-Firmenich, and Evonik focusing on large-scale microbial fermentation and cost-efficient formulations. Competitive differentiation relied on microbial strain diversity, coating and encapsulation efficiency, and integration into premixes, while plant- and yeast-derived solutions remained supplementary. Service-driven adoption, such as feed mill consulting or tailored on-farm inclusion programs, accounted for less than 10% of overall value.

Demand for postbiotics will expand to USD 0.36 billion in 2025, with the revenue mix shifting toward specialty blends combining postbiotics, probiotics, and organic acids. Traditional leaders face growing competition from innovators specializing in fermentation extracts, cell-free supernatants, and metabolite-based formulations. Major incumbents are pivoting to hybrid portfolios, integrating gut health, immunity, and performance-enhancement functionalities to maintain market relevance. Regional players in Asia-Pacific are also gaining share, particularly in poultry and aquaculture feed. Competitive advantage is moving away from single-function solutions toward ecosystem strength, species-specific efficacy, and recurring integration into feed formulations.

Why the Postbiotic Feed Additives Market is growing?

Advances in microbial fermentation and encapsulation technologies have improved the stability, functionality, and delivery of postbiotics, making them highly effective across diverse livestock feed applications. Inactivated microbial cells have gained strong adoption due to their proven role in improving gut health and immunity without the risks linked to live probiotics. Similarly, metabolite-based postbiotics, cell-free supernatants, and short-chain fatty acids are expanding their applications in nutrient absorption, pathogen control, and growth performance. These innovations align closely with the global ban on antibiotic growth promoters (AGPs), positioning postbiotics as sustainable alternatives.

Rising demand in poultry, swine, and aquaculture feed is fueling market growth as producers seek efficiency gains and compliance with animal health regulations. Postbiotics are increasingly being integrated into precision nutrition programs, where they support feed cost optimization and species-specific dietary requirements. Specialty blends that combine postbiotics with probiotics and organic acids are creating new opportunities, especially in premium feed formulations targeted at export-driven markets.

Segmental Analysis

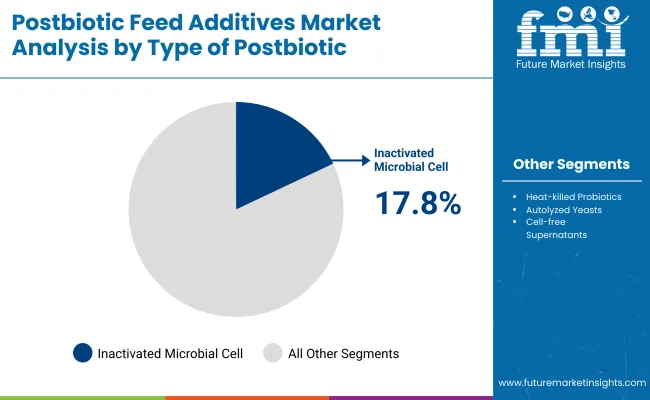
The Postbiotic Feed Additives Market is segmented by type, source, functionality, livestock type, delivery format, application method, sales channel, and region. By type, the market includes inactivated microbial cells, heat-killed probiotics, autolyzed yeasts, cell-free supernatants, metabolite-based postbiotics, short-chain fatty acids, organic acids, bacteriocins, enzymes and peptides, and fermentation extracts. Inactivated microbial cells dominate with 17.8% share in 2025, reflecting their effectiveness in poultry and swine feed for gut health and nutrient utilization.

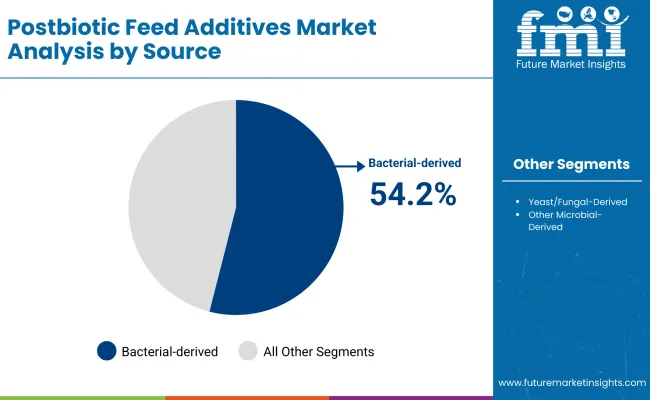
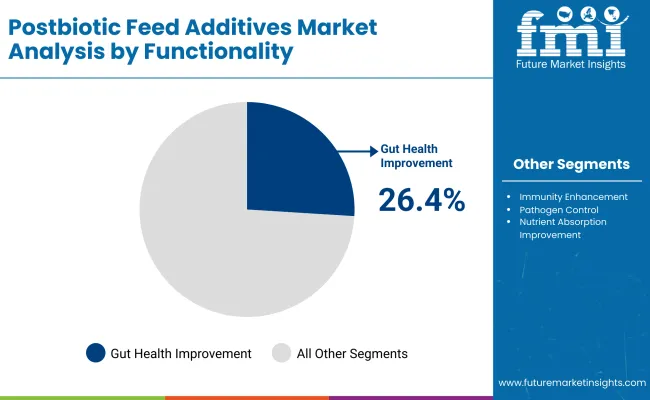
By source, bacterial-derived postbiotics hold the majority share at 54.2%, supported by efficient microbial fermentation platforms, while yeast and fungal-derived variants contribute 28.4%. Functionality segmentation highlights gut health improvement as the leading application with 26.4% share, followed by immunity enhancement and pathogen control, underlining the role of postbiotics in replacing antibiotic growth promoters.

Livestock adoption is led by poultry, supported by intensive production systems, with aquaculture emerging as a high-growth area in Asia-Pacific. Delivery formats span dry powders, encapsulated forms, and liquid concentrates, with encapsulation gaining importance for stability and targeted release. Feed inclusion remains the primary application method, though water-soluble additives are rising in aquaculture and poultry. Regionally, North America leads with 30% share, Europe follows at 28%, and Asia-Pacific emerges as the fastest-growing market with 37% share.
Insights into the Type Segment with Inactivated Microbial Cells Leading in Market Share

Postbiotic Feed Additives Market By Type

Type Segment Value Share (%)
Inactivated Microbial Cells 17.80%
Heat-killed Probiotics 14.60%
Autolyzed Yeasts 8.90%
Cell-free Supernatants 7.50%
Metabolite-based Postbiotics 12.80%
Short-chain Fatty Acids 9.40%
Organic Acids 8.10%
Bacteriocins 7.20%
Enzymes & Peptides 6.50%
Fermentation Extracts 7.20%

Inactivated microbial cells lead the market with a 17.8% share in 2025, followed by heat-killed probiotics and metabolite-based postbiotics as other prominent categories. This leadership is driven by their proven efficacy in enhancing gut health, immunity, and nutrient utilization across poultry and swine production, making them a preferred choice in large-scale feed formulations. The segment’s growth is also supported by technological advancements in microbial fermentation and encapsulation, which enhance stability and performance under diverse feed processing conditions. As demand for natural alternatives to antibiotic growth promoters accelerates, inactivated microbial cells remain central to postbiotic adoption. Multifunctional applications, cost-effectiveness, and compatibility with precision nutrition programs further strengthen their role as the backbone of the postbiotic feed additives market.
Insights into the Source Segment with Bacterial-derived Postbiotics Leading in Market Share

Postbiotic Feed Additives Market By Source

Source Segment Value Share (%)
Bacterial-derived 54.20%
Yeast/Fungal-derived 28.40%
Other Microbial-derived 17.40%

Bacterial-derived postbiotics lead the market with a 54.2% share in 2025, significantly outpacing yeast/fungal-derived and other microbial-derived categories. Their dominance is driven by scalability in fermentation processes, wide strain availability, and proven efficacy in enhancing gut health, nutrient absorption, and immunity across poultry, swine, and ruminant feed. Bacterial strains such as Lactobacillus and Bifidobacterium have established credibility in livestock nutrition, enabling consistent performance improvements and compliance with antibiotic reduction mandates.

The growth of this segment is further supported by technological advancements in microbial inactivation, which preserve beneficial metabolites while eliminating risks associated with live organisms. Cost efficiency and versatility in formulation make bacterial-derived postbiotics highly adaptable for both dry powder and encapsulated delivery formats. As global livestock producers shift toward sustainable, health-focused feed strategies, bacterial-derived solutions are expected to remain the cornerstone of postbiotic innovation and adoption.
Insights into the Functionality Segment with Gut Health Improvement Leading in Market Share

Postbiotic Feed Additives Market By Functionality

Segment Value Share (%)
Gut Health Improvement 26.40%
Immunity Enhancement 21.30%
Pathogen Control 18.50%
Nutrient Absorption Improvement 14.80%
Growth Performance Enhancement 12.60%
Stress Reduction (Heat, Transport) 6.40%

Gut health improvement leads the functionality segment with a 26.4% share in 2025, reflecting its critical role in optimizing livestock performance and reducing reliance on antibiotic growth promoters. This dominance is driven by the increasing need to maintain a balanced gut microbiota, enhance nutrient digestibility, and strengthen immunity, particularly in poultry and swine production. Producers prioritize gut health solutions as they directly improve feed conversion ratios and support overall animal welfare, aligning with global regulatory pressures for sustainable animal nutrition.

The segment’s leadership is reinforced by strong demand for bacterial-derived postbiotics, which provide metabolites and cell components that positively influence intestinal health. Complementary benefits such as improved pathogen resistance and reduced incidence of gastrointestinal disorders make gut health products indispensable in intensive farming systems. As precision nutrition strategies expand, gut health improvement postbiotics are expected to remain the backbone of feed formulations, ensuring consistent productivity and resilience across multiple livestock sectors.

What are the Drivers, Restraints, and Key Trends of the Postbiotic Feed Additives Market?

The Postbiotic Feed Additives Market is evolving under the dual forces of innovation and structural constraints. Scientific advancements are unlocking novel applications, while cost and scalability factors continue to reshape adoption priorities across global livestock and aquaculture nutrition systems.

Regulatory Shift Toward Antibiotic-Free Nutrition

Expansion in the Postbiotic Feed Additives Market is being propelled by stringent regulatory directives that mandate reduced antibiotic use in livestock production. Postbiotics are being positioned as compliant alternatives, offering reproducible benefits without the variability of probiotics or chemical additives. This shift is expected to elevate demand from poultry and swine sectors, where performance outcomes must be balanced with safety and sustainability compliance. As animal protein supply chains face closer scrutiny, regulatory momentum is anticipated to embed postbiotics as indispensable components in feed formulations, establishing a pathway for recurring, regulation-driven market growth.

Limited Standardization in Efficacy Validation

Adoption is being restricted by the absence of standardized methodologies for validating postbiotic efficacy across species and geographies. While promising outcomes are documented, inconsistency in trial design and lack of universally accepted biomarkers are constraining trust among integrators and feed formulators. This gap is expected to slow large-scale penetration, particularly in cost-sensitive markets, where performance guarantees are demanded before substitution of conventional additives. Unless harmonized validation frameworks are developed, product differentiation will remain fragmented, and consolidation opportunities will be delayed. Vendors capable of producing robust, evidence-backed trials are projected to secure early credibility and dominate in future procurement cycles.
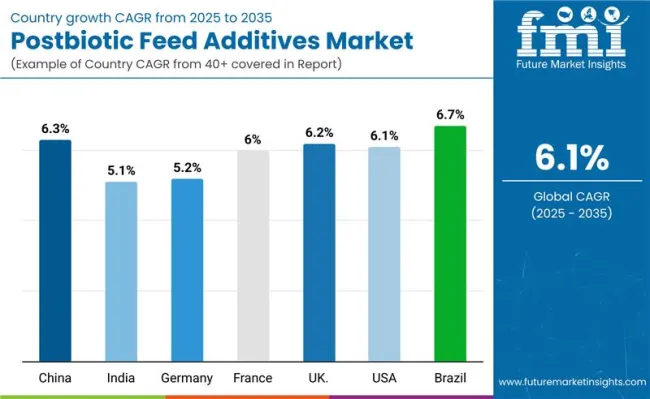
Analysis of Postbiotic Feed Additives Market by Key Countries

Country Wise Analysis Postbiotic Feed Additives Market

Countries CAGR
China 6.30%
India 5.16%
Germany 5.22%
France 6.06%
UK 6.22%
USA 5.19%
Brazil 6.72%

The global Postbiotic Feed Additives Market demonstrates notable regional variations in adoption, shaped by livestock production intensity, regulatory enforcement, and sustainability priorities. Asia-Pacific emerges as the fastest-growing region, led by China with a CAGR of 6.3% and India at 5.2%. Expansion is being fueled by large-scale poultry and aquaculture systems, government-backed initiatives for antibiotic-free animal nutrition, and investments in advanced feed formulations. In China, regulatory momentum to curb antibiotic usage has reinforced adoption of bacterial-derived postbiotics and fermentation extracts, while India’s growth reflects increased uptake by poultry integrators and tier-2 feed producers seeking export competitiveness and compliance with global residue standards.

Europe maintains a strong growth trajectory, anchored by Germany (5.2%), France (6.1%), and the UK (6.2%). Adoption is driven by stringent animal welfare policies, sustainability reporting requirements, and a mature ecosystem of multinational feed manufacturers embedding postbiotics into functional blends. Postbiotics are being increasingly positioned as premium additives for poultry and swine, aligned with the region’s leadership in sustainable agriculture.

North America represents 30% of global market share, supported by a consolidated livestock industry and early adoption of gut health solutions. Growth in the USA (5.1%) is service-oriented, focusing on tailored formulations, precision nutrition, and integration of encapsulated postbiotics into advanced feeding programs.
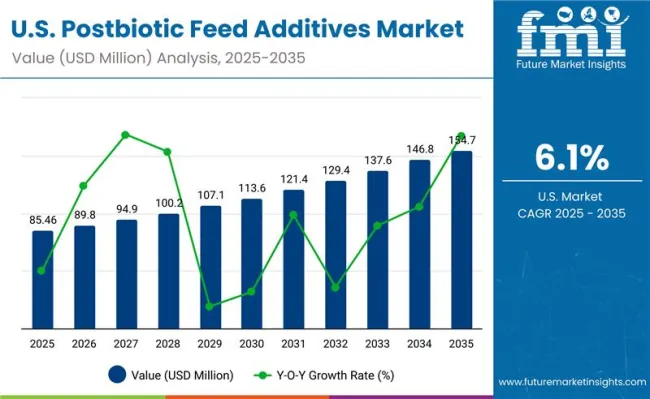
Sales Outlook for Postbiotic Feed Additives in the United States

Usa Postbiotic Feed Additives Market

Year USA Postbiotic Feed Additives Market (USD Million)
2025 85.46
2026 89.8
2027 94.9
2028 100.2
2029 107.1
2030 113.6
2031 121.4
2032 129.4
2033 137.6
2034 146.8
2035 154.7

The Postbiotic Feed Additives Market in the United States is projected to grow at a CAGR of 5.1% between 2025 and 2035, supported by the country’s advanced livestock sector and strong regulatory push toward antibiotic-free nutrition. Adoption has been reinforced by poultry and swine integrators seeking proven alternatives to antibiotic growth promoters, with inactivated microbial cells and bacterial-derived formulations gaining widespread traction. The USA dairy sector is also increasingly adopting postbiotics to improve nutrient absorption and enhance immunity in high-yielding cattle.

Poultry integrators are embedding postbiotics into feed formulations to optimize feed conversion and gut health, while swine producers are adopting metabolite-based solutions to reduce pathogen prevalence and improve herd resilience. Encapsulation technologies are being prioritized by feed manufacturers to ensure postbiotic stability during pelleting, creating opportunities for premium solutions. Additionally, tailored blends that combine postbiotics with probiotics and organic acids are attracting interest among large integrators aiming for multi-functional benefits. With sustained emphasis on animal health, regulatory compliance, and consumer demand for antibiotic-free meat, the USA market is positioned to remain a cornerstone for global postbiotic expansion.

Growth and Expansion Outlook for Postbiotic Feed Additives Market in the United Kingdom

The Postbiotic Feed Additives Market in the United Kingdom is projected to grow at a CAGR of 6.2% through 2035, supported by the country’s progressive policies on animal welfare and sustainability. Poultry and swine feed producers are actively adopting bacterial-derived and encapsulated postbiotics to improve gut health, nutrient absorption, and overall animal resilience. The shift is also influenced by the UK’s role as an exporter of high-quality animal protein, where antibiotic-free production standards are increasingly demanded. Universities and industry bodies are collaborating to validate the efficacy of postbiotics, ensuring credibility and accelerating adoption across integrators. Government-backed sustainability programs and innovation grants are reinforcing investment in advanced feed solutions, positioning the UK market as a leader in Europe.

  • Poultry and swine producers are embedding postbiotics into feed formulations for gut health improvement.
  • Research institutions are conducting trials to validate postbiotic efficacy and strengthen industry trust.
  • Export-driven protein producers are using postbiotics to meet antibiotic-free certification standards.

Growth and Expansion Outlook for India

The Postbiotic Feed Additives Market in India is forecast to expand at a CAGR of 5.2% through 2035, reflecting rapid adoption across poultry and aquaculture feed sectors. Rising regulatory emphasis on antibiotic-free production, combined with increasing consumer preference for safe animal protein, is accelerating market penetration. Poultry integrators are focusing on bacterial-derived and metabolite-based postbiotics to reduce pathogen prevalence and enhance feed efficiency, while aquaculture producers are adopting fermentation extracts and short-chain fatty acids to improve water stability and fish survival. Smaller feed mills in tier-2 and tier-3 cities are gradually integrating postbiotics as awareness of international export standards grows. Educational institutions are also including advanced animal nutrition practices in vocational training, embedding long-term familiarity with postbiotic technologies.

  • Poultry integrators are leveraging postbiotics for pathogen reduction and improved feed efficiency.
  • Aquaculture producers are adopting metabolite-based postbiotics to support survival and growth rates.
  • Tier-2 and tier-3 feed mills are incorporating postbiotics to align with global export standards.

Sales Outlook for China

The Postbiotic Feed Additives Market in China is expected to grow at a CAGR of 6.3%, the highest among major economies. This growth is underpinned by the country’s large-scale poultry and swine production systems, regulatory restrictions on antibiotic usage, and increasing investments in sustainable feed technologies. Bacterial-derived postbiotics dominate, supported by strong domestic production capacity and advanced fermentation technologies. Municipal programs focused on food safety and sustainability are incentivizing integrators to adopt postbiotics, while competitive pricing by local players is expanding adoption among smaller feed producers. Aquaculture has also emerged as a key driver, with encapsulated postbiotics being deployed to enhance gut health and improve yields in fish farming. The emphasis on export-quality meat production further reinforces China’s role as a growth engine in Asia-Pacific.

  • Large-scale poultry and swine systems are adopting bacterial-derived postbiotics under regulatory pressure.
  • Local producers are offering cost-effective postbiotics, enabling adoption among small and mid-scale feed mills.
  • Aquaculture feed formulations are increasingly incorporating encapsulated postbiotics to improve performance and sustainability.

In-depth Analysis of Postbiotic Feed Additives in Germany

Countries 2025
UK 20.33%
Germany 21.79%
Italy 10.56%
France 14.30%
Spain 10.37%
BNELUX 6.58%
Nordic 5.14%
Rest of Europe 11%
Countries 2035
UK 19.42%
Germany 20.37%
Italy 9.69%
France 14.62%
Spain 10.98%
BNELUX 5.56%
Nordic 5.93%
Rest of Europe 13%

The Postbiotic Feed Additives Market in Germany is projected to grow at a CAGR of 5.2% through 2035, supported by the country’s advanced livestock industry and stringent EU regulatory framework promoting antibiotic-free production. Poultry and swine producers are leading adopters, prioritizing bacterial-derived and encapsulated postbiotics to improve nutrient absorption, immunity, and feed conversion efficiency. Germany’s position as a hub for precision agriculture and high-quality protein production has reinforced its role in shaping standardized feed additive adoption across Europe. Integration of postbiotics into full-spectrum feed blends is being accelerated by multinational feed manufacturers operating in the country, supported by strong collaboration with research institutions to validate efficacy through controlled animal trials. Compliance with EU safety standards and sustainability reporting requirements further incentivizes large-scale adoption. Germany’s market is therefore poised to remain a key contributor to European growth, offering both scale and innovation leadership.
  • Poultry and swine producers are adopting encapsulated postbiotics to optimize feed efficiency and immunity.
  • Multinational feed companies are integrating bacterial-derived postbiotics into functional feed blends.
  • Research-driven validation trials are reinforcing postbiotic efficacy under EU compliance frameworks.

Growth Outlook for Postbiotic Feed Additives Market in Japan

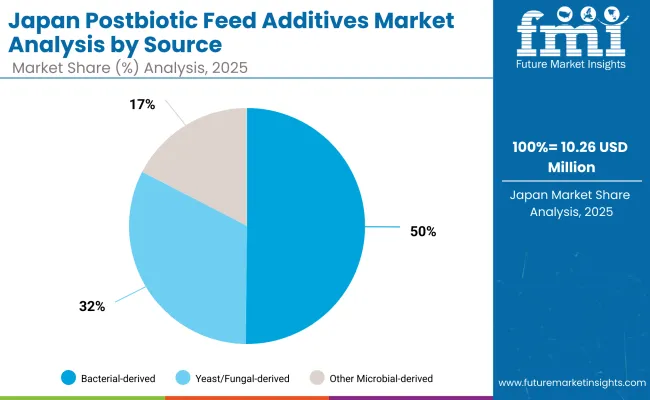
Postbiotic Feed Additives Market Japan

Source Segment Value Share (%)
Bacterial-derived 50.20%
Yeast/Fungal-derived 32.40%
Other Microbial-derived 17.40%

The Postbiotic Feed Additives Market in Japan is projected at USD 10.26 million in 2025, supported by its dominance in East Asia’s feed additive adoption. Bacterial-derived postbiotics, holding 50.20% share, are positioned as the backbone of the market, reflecting their reliability in enhancing gut health, nutrient absorption, and pathogen resistance across poultry and swine production. Yeast and fungal-derived postbiotics, at 32.40%, are being steadily adopted in aquaculture and ruminant nutrition, where functional blends are expected to improve performance and sustainability outcomes. Other microbial-derived solutions, though smaller at 17.40%, are expanding rapidly, driven by innovation in metabolite-based formulations that support stress reduction and immunity.

The Japanese market outlook is underpinned by increasing demand for antibiotic-free livestock systems and strong regulatory alignment with sustainable food production. Advanced fermentation technologies, combined with encapsulation methods, are projected to further improve stability and adoption rates. As animal nutrition frameworks transition toward precision feeding, integrated postbiotic solutions are expected to emerge as critical components of long-term productivity.
  • Market in Japan holds 2.9% share of the global market in 2025.
  • Bacterial-derived sources dominate at 50.20%, reflecting leadership in poultry and swine nutrition.
  • Growth is supported by innovation in microbial metabolites and regulatory emphasis on antibiotic-free protein.

Opportunity Analysis of South Korea Postbiotic Feed Additives Market

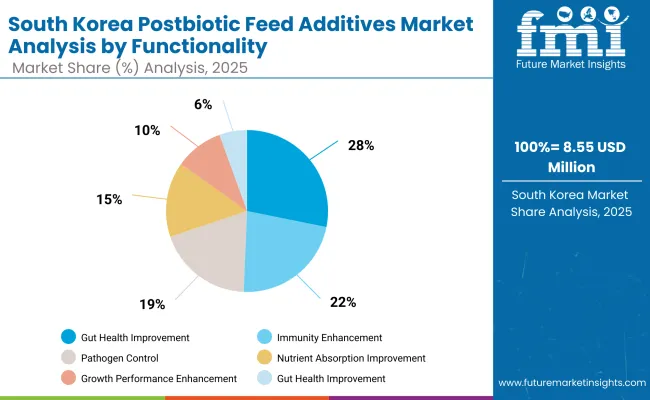
Postbiotic Feed Additives Market South Korea

Functionality Segment Value Share (%)
Gut Health Improvement 28.60%
Immunity Enhancement 22.80%
Pathogen Control 19.40%
Nutrient Absorption Improvement 15.20%
Growth Performance Enhancement 9.80%
Stress Reduction (Heat, Transport) 4.20%

The Postbiotic Feed Additives Market in South Korea is projected at USD 8.55 million in 2025, holding around 2.4% of the global market. Gut health improvement dominates with a 28.6% share, highlighting its critical role in enhancing digestive efficiency and overall livestock resilience in intensive production systems. Immunity enhancement follows at 22.8%, driven by the country’s transition toward antibiotic-free livestock farming and the growing importance of natural disease prevention. Pathogen control accounts for 19.4%, reflecting stringent biosecurity requirements in poultry and swine sectors. Nutrient absorption improvement, with 15.2%, is being supported by precision feeding strategies and innovations in metabolite-based formulations.

South Korea’s market outlook is shaped by high livestock productivity standards, increasing consumer demand for antibiotic-free meat, and strong government emphasis on food safety. With advancements in feed innovation and research-backed validation of postbiotics, their integration into full-spectrum functional feed blends is expected to accelerate. By 2035, South Korea is projected to emerge as a key adopter of postbiotic solutions aligned with sustainability and Industry 4.0 frameworks in agriculture.
  • Market in South Korea valued at USD 8.55 million in 2025, with 2.4% global share.
  • Gut health improvement dominates functionality with 28.6% share.
  • Growth is reinforced by immunity enhancement and biosecurity-focused pathogen control.

Competitive Landscape of the Postbiotic Feed Additives Market

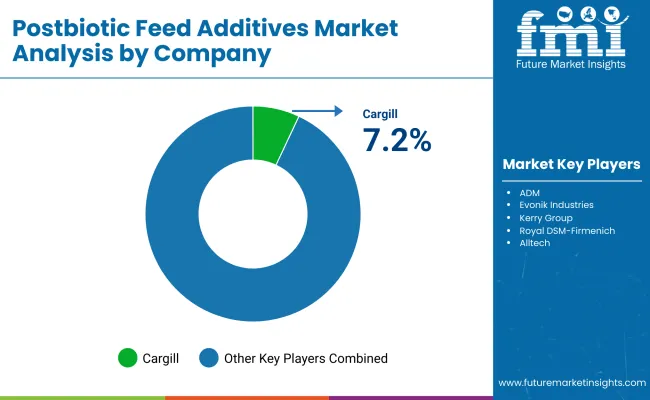
Postbiotic Feed Additives Market By Company

The Postbiotic Feed Additives Market is moderately fragmented, with global feed-additive leaders, mid-sized innovators, and regional specialists competing across multiple livestock and functional segments. Global leaders such as Cargill, ADM, and Royal DSM-Firmenich hold significant market presence, supported by large-scale fermentation capacity, advanced microbial platforms, and integrated distribution through premix and compound feed networks. Their strategies are increasingly oriented toward heat-stable postbiotic formulations, encapsulation technologies, and multifunctional blends designed to deliver gut health, immunity, and performance benefits in a single additive.

Established mid-sized players, including Evonik Industries, Kerry Group, Novus International, and Adisseo, cater to demand for species-specific and performance-driven solutions. These companies are accelerating adoption through metabolite-based postbiotics, short-chain fatty acid formulations, and encapsulated yeast derivatives, which provide stability across feed processing conditions. Their portfolios are aligned with poultry, swine, and aquaculture integrators that require precision nutrition and measurable return on investment.

Specialized providers such as Lallemand Animal Nutrition and Arm & Hammer Animal and Food Production focus on customized, application-specific postbiotic programs that target regional livestock challenges such as heat stress, transport stress, and localized pathogen pressure. Their strength lies in customization, advisory services, and regional adaptability rather than global scale.

Competitive differentiation is shifting away from single-strain, low-cost formulations toward integrated ecosystems of bacterial-, yeast-, and metabolite-derived solutions, often combined with probiotics and organic acids. Vendors are competing on scientific validation, sustainability credentials, and ability to deliver bundled programs that align with regulatory mandates for antibiotic-free livestock production.

Key Developments in Postbiotic Feed Additives Market

  • On March 5, 2024, Cargill expanded its fermentation facility in the United States to increase production of bacterial-derived postbiotics. The investment was aimed at supporting rising demand for heat-stable formulations in poultry and swine feed, while ensuring supply reliability for integrators transitioning away from antibiotic growth promoters.
  • On July 22, 2024, Royal DSM-Firmenich launched a metabolite-based postbiotic solution in Europe, designed to enhance nutrient absorption and gut health in monogastric animals. The product incorporated validated metabolite fractions and was marketed as part of DSM’s broader strategy to align with EU sustainability and antibiotic-free livestock mandates.

Scope of Report

Item Value
Quantitative Units USD 0.36 Billion
Type of Postbiotic Inactivated Microbial Cells, Heat-killed Probiotics (e.g., Lactobacillus, Bifidobacterium), Autolyzed Yeasts (e.g., Saccharomyces cerevisiae), Cell-free Supernatants, Metabolite-based Postbiotics, Short-chain Fatty Acids (Butyrate, Propionate), Organic Acids, Bacteriocins, Enzymes & Peptides, Fermentation Extracts
Source Bacterial-derived, Yeast/Fungal-derived, Other Microbial-derived
Functionality Gut Health Improvement, Immunity Enhancement, Pathogen Control, Nutrient Absorption Improvement, Growth Performance Enhancement, Stress Reduction (Heat, Transport)
Livestock Type Poultry, Swine, Ruminants (Dairy, Beef, Small Ruminants), Aquaculture, Pets
Delivery Format Dry Powder, Encapsulated Form, Liquid Concentrate
Application Method Feed Inclusion (Premix, Compound Feed), Water-soluble Additives
Sales Channel Direct to Integrators/Farms, Through Feed Manufacturers/Premix Companies, Distributors & Dealers
Regions Covered North America, Europe, Asia-Pacific, Latin America, Middle East & Africa
Countries Covered United States, Canada, Germany, France, United Kingdom, China, Japan, India, Brazil, South Africa
Key Companies Profiled Cargill, ADM, Evonik Industries, Kerry Group, Royal DSM- Firmenich, Novus International, Alltech, Adisseo, Lallemand Animal Nutrition, Arm & Hammer Animal and Food Production
Additional Attributes Dollar sales by type, source, functionality, livestock category, and delivery format; adoption trends in poultry, swine, aquaculture, and ruminants; encapsulation and heat-stability innovations; validation of gut health and immunity enhancement functions; regulatory drivers for antibiotic-free animal production; regional penetration analysis; product bundling with probiotics and organic acids.

Key Segments

By Type of Postbiotic:

  • Inactivated Microbial Cells
    • Heat-killed Probiotics (e.g., Lactobacillus, Bifidobacterium)
    • Autolyzed Yeasts (e.g., Saccharomyces cerevisiae)
  • Cell-free Supernatants
  • Metabolite-based Postbiotics
    • Short-chain Fatty Acids (e.g., Butyrate, Propionate)
    • Organic Acids
    • Bacteriocins
    • Enzymes & Peptides
  • Fermentation Extracts

By Source:

  • Bacterial-derived
  • Yeast/Fungal-derived
  • Other Microbial-derived

By Functionality:

  • Gut Health Improvement
  • Immunity Enhancement
  • Pathogen Control
  • Nutrient Absorption Improvement
  • Growth Performance Enhancement
  • Stress Reduction (Heat, Transport)

By Livestock Type:

  • Poultry
  • Swine
  • Ruminants (Dairy, Beef, Small Ruminants)
  • Aquaculture
  • Pets

By Delivery Format:

  • Dry Powder
  • Encapsulated Form
  • Liquid Concentrate

By Application Method:

  • Feed Inclusion (Premix, Compound Feed)
  • Water-soluble Additives

By Sales Channel:

  • Direct to Integrators / Farms
  • Through Feed Manufacturers / Premix Companies
  • Distributors & Dealers

By Region:

  • North America
  • Latin America
  • Europe
  • East Asia
  • South Asia & Pacific
  • Middle East and Africa

Table of Content

  1. Executive Summary
    • Global Market Outlook
    • Demand-side Trends
    • Supply-side Trends
    • Technology Roadmap Analysis
    • Analysis and Recommendations
  2. Market Overview
    • Market Coverage / Taxonomy
    • Market Definition / Scope / Limitations
  3. Market Background
    • Market Dynamics
      • Drivers
      • Restraints
      • Opportunity
      • Trends
    • Scenario Forecast
      • Demand in Optimistic Scenario
      • Demand in Likely Scenario
      • Demand in Conservative Scenario
    • Opportunity Map Analysis
    • Product Life Cycle Analysis
    • Supply Chain Analysis
    • Investment Feasibility Matrix
    • Value Chain Analysis
    • PESTLE and Porter’s Analysis
    • Regulatory Landscape
    • Regional Parent Market Outlook
    • Production and Consumption Statistics
    • Import and Export Statistics
  4. Global Market Analysis 2020 to 2024 and Forecast, 2025 to 2035
    • Historical Market Size Value (USD Million) Analysis, 2020 to 2024
    • Current and Future Market Size Value (USD Million) Projections, 2025 to 2035
      • Y-o-Y Growth Trend Analysis
      • Absolute $ Opportunity Analysis
  5. Global Market Pricing Analysis 2020 to 2024 and Forecast 2025 to 2035
  6. Global Market Analysis 2020 to 2024 and Forecast 2025 to 2035, By Type of Postbiotic
    • Introduction / Key Findings
    • Historical Market Size Value (USD Million) Analysis By Type of Postbiotic, 2020 to 2024
    • Current and Future Market Size Value (USD Million) Analysis and Forecast By Type of Postbiotic, 2025 to 2035
      • Inactivated Microbial Cells
        • Heat-killed Probiotics (e.g., Lactobacillus, Bifidobacterium)
        • Autolyzed Yeasts (e.g., Saccharomyces cerevisiae)
      • Cell-free Supernatants
      • Metabolite-based Postbiotics
        • Short-chain Fatty Acids (e.g., Butyrate, Propionate)
        • Organic Acids
        • Bacteriocins
        • Enzymes & Peptides
      • Fermentation Extracts
    • Y-o-Y Growth Trend Analysis By Type of Postbiotic, 2020 to 2024
    • Absolute $ Opportunity Analysis By Type of Postbiotic, 2025 to 2035
  7. Global Market Analysis 2020 to 2024 and Forecast 2025 to 2035, By Source
    • Introduction / Key Findings
    • Historical Market Size Value (USD Million) Analysis By Source, 2020 to 2024
    • Current and Future Market Size Value (USD Million) Analysis and Forecast By Source, 2025 to 2035
      • Bacterial-derived
      • Yeast/Fungal-derived
      • Other Microbial-derived
    • Y-o-Y Growth Trend Analysis By Source, 2020 to 2024
    • Absolute $ Opportunity Analysis By Source, 2025 to 2035
  8. Global Market Analysis 2020 to 2024 and Forecast 2025 to 2035, By Functionality
    • Introduction / Key Findings
    • Historical Market Size Value (USD Million) Analysis By Functionality, 2020 to 2024
    • Current and Future Market Size Value (USD Million) Analysis and Forecast By Functionality, 2025 to 2035
      • Gut Health Improvement
      • Immunity Enhancement
      • Pathogen Control
      • Nutrient Absorption Improvement
      • Growth Performance Enhancement
      • Stress Reduction (Heat, Transport)
    • Y-o-Y Growth Trend Analysis By Functionality, 2020 to 2024
    • Absolute $ Opportunity Analysis By Functionality, 2025 to 2035
  9. Global Market Analysis 2020 to 2024 and Forecast 2025 to 2035, By Livestock Type
    • Introduction / Key Findings
    • Historical Market Size Value (USD Million) Analysis By Livestock Type, 2020 to 2024
    • Current and Future Market Size Value (USD Million) Analysis and Forecast By Livestock Type, 2025 to 2035
      • Poultry
      • Swine
      • Ruminants (Dairy, Beef, Small Ruminants)
      • Aquaculture
      • Pets
    • Y-o-Y Growth Trend Analysis By Livestock Type, 2020 to 2024
    • Absolute $ Opportunity Analysis By Livestock Type, 2025 to 2035
  10. Global Market Analysis 2020 to 2024 and Forecast 2025 to 2035, By Delivery Format
    • Introduction / Key Findings
    • Historical Market Size Value (USD Million) Analysis By Delivery Format, 2020 to 2024
    • Current and Future Market Size Value (USD Million) Analysis and Forecast By Delivery Format, 2025 to 2035
      • Dry Powder
      • Encapsulated Form
      • Liquid Concentrate
    • Y-o-Y Growth Trend Analysis By Delivery Format, 2020 to 2024
    • Absolute $ Opportunity Analysis By Delivery Format, 2025 to 2035
  11. Global Market Analysis 2020 to 2024 and Forecast 2025 to 2035, By Application Method
    • Introduction / Key Findings
    • Historical Market Size Value (USD Million) Analysis By Application Method, 2020 to 2024
    • Current and Future Market Size Value (USD Million) Analysis and Forecast By Application Method, 2025 to 2035
      • Feed Inclusion (Premix, Compound Feed)
      • Water-soluble Additives
    • Y-o-Y Growth Trend Analysis By Application Method, 2020 to 2024
    • Absolute $ Opportunity Analysis By Application Method, 2025 to 2035
  12. Global Market Analysis 2020 to 2024 and Forecast 2025 to 2035, By Sales Channel
    • Introduction / Key Findings
    • Historical Market Size Value (USD Million) Analysis By Sales Channel, 2020 to 2024
    • Current and Future Market Size Value (USD Million) Analysis and Forecast By Sales Channel, 2025 to 2035
      • Direct to Integrators / Farms
      • Through Feed Manufacturers / Premix Companies
      • Distributors & Dealers
    • Y-o-Y Growth Trend Analysis By Sales Channel, 2020 to 2024
    • Absolute $ Opportunity Analysis By Sales Channel, 2025 to 2035
  13. Global Market Analysis 2020 to 2024 and Forecast 2025 to 2035, By Region
    • Introduction
    • Historical Market Size Value (USD Million) Analysis By Region, 2020 to 2024
    • Current Market Size Value (USD Million) Analysis and Forecast By Region, 2025 to 2035
      • North America
      • Latin America
      • Europe
      • East Asia
      • South Asia & Pacific
      • Middle East and Africa
    • Market Attractiveness Analysis By Region
  14. North America Market Analysis 2020 to 2024 and Forecast 2025 to 2035, By Country
    • Historical Market Size Value (USD Million) Trend Analysis By Market Taxonomy, 2020 to 2024
    • Market Size Value (USD Million) Forecast By Market Taxonomy, 2025 to 2035
      • By Country
        • USA
        • Canada
      • By Type of Postbiotic
      • By Source
      • By Functionality
      • By Livestock Type
      • By Delivery Format
      • By Application Method
      • By Sales Channel
    • Market Attractiveness Analysis
      • By Country
      • By Type of Postbiotic
      • By Source
      • By Functionality
      • By Livestock Type
      • By Delivery Format
      • By Application Method
      • By Sales Channel
    • Key Takeaways
  15. Latin America Market Analysis 2020 to 2024 and Forecast 2025 to 2035, By Country
    • Historical Market Size Value (USD Million) Trend Analysis By Market Taxonomy, 2020 to 2024
    • Market Size Value (USD Million) Forecast By Market Taxonomy, 2025 to 2035
      • By Country
        • Brazil
        • Mexico
        • Colombia
        • Rest of Latin America
      • By Type of Postbiotic
      • By Source
      • By Functionality
      • By Livestock Type
      • By Delivery Format
      • By Application Method
      • By Sales Channel
    • Market Attractiveness Analysis
      • By Country
      • By Type of Postbiotic
      • By Source
      • By Functionality
      • By Livestock Type
      • By Delivery Format
      • By Application Method
      • By Sales Channel
    • Key Takeaways
  16. Europe Market Analysis 2020 to 2024 and Forecast 2025 to 2035, By Country
    • Historical Market Size Value (USD Million) Trend Analysis By Market Taxonomy, 2020 to 2024
    • Market Size Value (USD Million) Forecast By Market Taxonomy, 2025 to 2035
      • By Country
        • Germany
        • UK
        • France
        • Italy
        • Spain
        • Belgium
        • Netherlands
        • Nordic
        • Switzerland
        • Russia
        • Poland
        • Rest of Europe
      • By Type of Postbiotic
      • By Source
      • By Functionality
      • By Livestock Type
      • By Delivery Format
      • By Application Method
      • By Sales Channel
    • Market Attractiveness Analysis
      • By Country
      • By Type of Postbiotic
      • By Source
      • By Functionality
      • By Livestock Type
      • By Delivery Format
      • By Application Method
      • By Sales Channel
    • Key Takeaways
  17. East Asia Market Analysis 2020 to 2024 and Forecast 2025 to 2035, By Country
    • Historical Market Size Value (USD Million) Trend Analysis By Market Taxonomy, 2020 to 2024
    • Market Size Value (USD Million) Forecast By Market Taxonomy, 2025 to 2035
      • By Country
        • China
        • Japan
        • South Korea
      • By Type of Postbiotic
      • By Source
      • By Functionality
      • By Livestock Type
      • By Delivery Format
      • By Application Method
      • By Sales Channel
    • Market Attractiveness Analysis
      • By Country
      • By Type of Postbiotic
      • By Source
      • By Functionality
      • By Livestock Type
      • By Delivery Format
      • By Application Method
      • By Sales Channel
    • Key Takeaways
  18. South Asia & Pacific Market Analysis 2020 to 2024 and Forecast 2025 to 2035, By Country
    • Historical Market Size Value (USD Million) Trend Analysis By Market Taxonomy, 2020 to 2024
    • Market Size Value (USD Million) Forecast By Market Taxonomy, 2025 to 2035
      • By Country
        • India
        • Thailand
        • Malaysia
        • Indonesia
        • Singapore
        • Vietnam
        • Australia
        • New Zealand
        • Rest of South Asia
      • By Type of Postbiotic
      • By Source
      • By Functionality
      • By Livestock Type
      • By Delivery Format
      • By Application Method
      • By Sales Channel
    • Market Attractiveness Analysis
      • By Country
      • By Type of Postbiotic
      • By Source
      • By Functionality
      • By Livestock Type
      • By Delivery Format
      • By Application Method
      • By Sales Channel
    • Key Takeaways
  19. Middle East and Africa Market Analysis 2020 to 2024 and Forecast 2025 to 2035, By Country
    • Historical Market Size Value (USD Million) Trend Analysis By Market Taxonomy, 2020 to 2024
    • Market Size Value (USD Million) Forecast By Market Taxonomy, 2025 to 2035
      • By Country
        • Turkey
        • UAE
        • Saudi Arabia
        • Israel
        • Other GCC Countries
        • North Africa
        • South Africa
      • By Type of Postbiotic
      • By Source
      • By Functionality
      • By Livestock Type
      • By Delivery Format
      • By Application Method
      • By Sales Channel
    • Market Attractiveness Analysis
      • By Country
      • By Type of Postbiotic
      • By Source
      • By Functionality
      • By Livestock Type
      • By Delivery Format
      • By Application Method
      • By Sales Channel
    • Key Takeaways
  20. Key Countries Market Analysis
    • USA
      • Pricing Analysis
      • Market Share Analysis, 2024
        • By Type of Postbiotic
        • By Source
        • By Functionality
        • By Livestock Type
        • By Delivery Format
        • By Application Method
        • By Sales Channel
    • Canada
      • Pricing Analysis
      • Market Share Analysis, 2024
        • By Type of Postbiotic
        • By Source
        • By Functionality
        • By Livestock Type
        • By Delivery Format
        • By Application Method
        • By Sales Channel
    • Brazil
      • Pricing Analysis
      • Market Share Analysis, 2024
        • By Type of Postbiotic
        • By Source
        • By Functionality
        • By Livestock Type
        • By Delivery Format
        • By Application Method
        • By Sales Channel
    • Mexico
      • Pricing Analysis
      • Market Share Analysis, 2024
        • By Type of Postbiotic
        • By Source
        • By Functionality
        • By Livestock Type
        • By Delivery Format
        • By Application Method
        • By Sales Channel
    • Colombia
      • Pricing Analysis
      • Market Share Analysis, 2024
        • By Type of Postbiotic
        • By Source
        • By Functionality
        • By Livestock Type
        • By Delivery Format
        • By Application Method
        • By Sales Channel
    • Rest of Latin America
      • Pricing Analysis
      • Market Share Analysis, 2024
        • By Type of Postbiotic
        • By Source
        • By Functionality
        • By Livestock Type
        • By Delivery Format
        • By Application Method
        • By Sales Channel
    • Germany
      • Pricing Analysis
      • Market Share Analysis, 2024
        • By Type of Postbiotic
        • By Source
        • By Functionality
        • By Livestock Type
        • By Delivery Format
        • By Application Method
        • By Sales Channel
    • UK
      • Pricing Analysis
      • Market Share Analysis, 2024
        • By Type of Postbiotic
        • By Source
        • By Functionality
        • By Livestock Type
        • By Delivery Format
        • By Application Method
        • By Sales Channel
    • France
      • Pricing Analysis
      • Market Share Analysis, 2024
        • By Type of Postbiotic
        • By Source
        • By Functionality
        • By Livestock Type
        • By Delivery Format
        • By Application Method
        • By Sales Channel
    • Italy
      • Pricing Analysis
      • Market Share Analysis, 2024
        • By Type of Postbiotic
        • By Source
        • By Functionality
        • By Livestock Type
        • By Delivery Format
        • By Application Method
        • By Sales Channel
    • Spain
      • Pricing Analysis
      • Market Share Analysis, 2024
        • By Type of Postbiotic
        • By Source
        • By Functionality
        • By Livestock Type
        • By Delivery Format
        • By Application Method
        • By Sales Channel
    • Belgium
      • Pricing Analysis
      • Market Share Analysis, 2024
        • By Type of Postbiotic
        • By Source
        • By Functionality
        • By Livestock Type
        • By Delivery Format
        • By Application Method
        • By Sales Channel
    • Netherlands
      • Pricing Analysis
      • Market Share Analysis, 2024
        • By Type of Postbiotic
        • By Source
        • By Functionality
        • By Livestock Type
        • By Delivery Format
        • By Application Method
        • By Sales Channel
    • Nordic
      • Pricing Analysis
      • Market Share Analysis, 2024
        • By Type of Postbiotic
        • By Source
        • By Functionality
        • By Livestock Type
        • By Delivery Format
        • By Application Method
        • By Sales Channel
    • Switzerland
      • Pricing Analysis
      • Market Share Analysis, 2024
        • By Type of Postbiotic
        • By Source
        • By Functionality
        • By Livestock Type
        • By Delivery Format
        • By Application Method
        • By Sales Channel
    • Russia
      • Pricing Analysis
      • Market Share Analysis, 2024
        • By Type of Postbiotic
        • By Source
        • By Functionality
        • By Livestock Type
        • By Delivery Format
        • By Application Method
        • By Sales Channel
    • Poland
      • Pricing Analysis
      • Market Share Analysis, 2024
        • By Type of Postbiotic
        • By Source
        • By Functionality
        • By Livestock Type
        • By Delivery Format
        • By Application Method
        • By Sales Channel
    • Rest of Europe
      • Pricing Analysis
      • Market Share Analysis, 2024
        • By Type of Postbiotic
        • By Source
        • By Functionality
        • By Livestock Type
        • By Delivery Format
        • By Application Method
        • By Sales Channel
    • China
      • Pricing Analysis
      • Market Share Analysis, 2024
        • By Type of Postbiotic
        • By Source
        • By Functionality
        • By Livestock Type
        • By Delivery Format
        • By Application Method
        • By Sales Channel
    • Japan
      • Pricing Analysis
      • Market Share Analysis, 2024
        • By Type of Postbiotic
        • By Source
        • By Functionality
        • By Livestock Type
        • By Delivery Format
        • By Application Method
        • By Sales Channel
    • South Korea
      • Pricing Analysis
      • Market Share Analysis, 2024
        • By Type of Postbiotic
        • By Source
        • By Functionality
        • By Livestock Type
        • By Delivery Format
        • By Application Method
        • By Sales Channel
    • India
      • Pricing Analysis
      • Market Share Analysis, 2024
        • By Type of Postbiotic
        • By Source
        • By Functionality
        • By Livestock Type
        • By Delivery Format
        • By Application Method
        • By Sales Channel
    • Thailand
      • Pricing Analysis
      • Market Share Analysis, 2024
        • By Type of Postbiotic
        • By Source
        • By Functionality
        • By Livestock Type
        • By Delivery Format
        • By Application Method
        • By Sales Channel
    • Malaysia
      • Pricing Analysis
      • Market Share Analysis, 2024
        • By Type of Postbiotic
        • By Source
        • By Functionality
        • By Livestock Type
        • By Delivery Format
        • By Application Method
        • By Sales Channel
    • Indonesia
      • Pricing Analysis
      • Market Share Analysis, 2024
        • By Type of Postbiotic
        • By Source
        • By Functionality
        • By Livestock Type
        • By Delivery Format
        • By Application Method
        • By Sales Channel
    • Singapore
      • Pricing Analysis
      • Market Share Analysis, 2024
        • By Type of Postbiotic
        • By Source
        • By Functionality
        • By Livestock Type
        • By Delivery Format
        • By Application Method
        • By Sales Channel
    • Vietnam
      • Pricing Analysis
      • Market Share Analysis, 2024
        • By Type of Postbiotic
        • By Source
        • By Functionality
        • By Livestock Type
        • By Delivery Format
        • By Application Method
        • By Sales Channel
    • Australia
      • Pricing Analysis
      • Market Share Analysis, 2024
        • By Type of Postbiotic
        • By Source
        • By Functionality
        • By Livestock Type
        • By Delivery Format
        • By Application Method
        • By Sales Channel
    • New Zealand
      • Pricing Analysis
      • Market Share Analysis, 2024
        • By Type of Postbiotic
        • By Source
        • By Functionality
        • By Livestock Type
        • By Delivery Format
        • By Application Method
        • By Sales Channel
    • Rest of South Asia
      • Pricing Analysis
      • Market Share Analysis, 2024
        • By Type of Postbiotic
        • By Source
        • By Functionality
        • By Livestock Type
        • By Delivery Format
        • By Application Method
        • By Sales Channel
  21. Market Structure Analysis
    • Competition Dashboard
    • Competition Benchmarking
    • Market Share Analysis of Top Players
      • By Regional
      • By Type of Postbiotic
      • By Source
      • By Functionality
      • By Livestock Type
      • By Delivery Format
      • By Application Method
      • By Sales Channel
  22. Competition Analysis
    • Competition Deep Dive
      • Cargill
        • Overview
        • Product Portfolio
        • Profitability by Market Segments (Product/Age /Sales Channel/Region)
        • Sales Footprint
        • Strategy Overview
        • ADM
        • Evonik Industries
        • Kerry Group
        • Royal DSM-Firmenich
        • Novus International
        • Alltech
        • Adisseo
        • Lallemand Animal Nutrition
        • Arm & Hammer Animal and Food Production
        • Others
    • Assumptions & Acronyms Used
    • Research Methodology

List of Tables

  • Table 1: Global Market Value (USD Million) Forecast by Region, 2020-2035
  • Table 2: Global Market Value (USD Million) Forecast by Type of Postbiotic, 2020-2035
  • Table 3: Global Market Value (USD Million) Forecast by Source, 2020-2035
  • Table 4: Global Market Value (USD Million) Forecast by Functionality, 2020-2035
  • Table 5: Global Market Value (USD Million) Forecast by Livestock Type, 2020-2035
  • Table 6: Global Market Value (USD Million) Forecast by Delivery Format, 2020-2035
  • Table 7: Global Market Value (USD Million) Forecast by Application Method, 2020-2035
  • Table 8: Global Market Value (USD Million) Forecast by Sales Channel, 2020-2035
  • Table 9: North America Market Value (USD Million) Forecast by Country, 2020-2035
  • Table 10: North America Market Value (USD Million) Forecast by Type of Postbiotic, 2020-2035
  • Table 11: North America Market Value (USD Million) Forecast by Source, 2020-2035
  • Table 12: North America Market Value (USD Million) Forecast by Functionality, 2020-2035
  • Table 13: North America Market Value (USD Million) Forecast by Livestock Type, 2020-2035
  • Table 14: North America Market Value (USD Million) Forecast by Delivery Format, 2020-2035
  • Table 15: North America Market Value (USD Million) Forecast by Application Method, 2020-2035
  • Table 16: North America Market Value (USD Million) Forecast by Sales Channel, 2020-2035
  • Table 17: Latin America Market Value (USD Million) Forecast by Country, 2020-2035
  • Table 18: Latin America Market Value (USD Million) Forecast by Type of Postbiotic, 2020-2035
  • Table 19: Latin America Market Value (USD Million) Forecast by Source, 2020-2035
  • Table 20: Latin America Market Value (USD Million) Forecast by Functionality, 2020-2035
  • Table 21: Latin America Market Value (USD Million) Forecast by Livestock Type, 2020-2035
  • Table 22: Latin America Market Value (USD Million) Forecast by Delivery Format, 2020-2035
  • Table 23: Latin America Market Value (USD Million) Forecast by Application Method, 2020-2035
  • Table 24: Latin America Market Value (USD Million) Forecast by Sales Channel, 2020-2035
  • Table 25: Europe Market Value (USD Million) Forecast by Country, 2020-2035
  • Table 26: Europe Market Value (USD Million) Forecast by Type of Postbiotic, 2020-2035
  • Table 27: Europe Market Value (USD Million) Forecast by Source, 2020-2035
  • Table 28: Europe Market Value (USD Million) Forecast by Functionality, 2020-2035
  • Table 29: Europe Market Value (USD Million) Forecast by Livestock Type, 2020-2035
  • Table 30: Europe Market Value (USD Million) Forecast by Delivery Format, 2020-2035
  • Table 31: Europe Market Value (USD Million) Forecast by Application Method, 2020-2035
  • Table 32: Europe Market Value (USD Million) Forecast by Sales Channel, 2020-2035
  • Table 33: East Asia Market Value (USD Million) Forecast by Country, 2020-2035
  • Table 34: East Asia Market Value (USD Million) Forecast by Type of Postbiotic, 2020-2035
  • Table 35: East Asia Market Value (USD Million) Forecast by Source, 2020-2035
  • Table 36: East Asia Market Value (USD Million) Forecast by Functionality, 2020-2035
  • Table 37: East Asia Market Value (USD Million) Forecast by Livestock Type, 2020-2035
  • Table 38: East Asia Market Value (USD Million) Forecast by Delivery Format, 2020-2035
  • Table 39: East Asia Market Value (USD Million) Forecast by Application Method, 2020-2035
  • Table 40: East Asia Market Value (USD Million) Forecast by Sales Channel, 2020-2035
  • Table 41: South Asia & Pacific Market Value (USD Million) Forecast by Country, 2020-2035
  • Table 42: South Asia & Pacific Market Value (USD Million) Forecast by Type of Postbiotic, 2020-2035
  • Table 43: South Asia & Pacific Market Value (USD Million) Forecast by Source, 2020-2035
  • Table 44: South Asia & Pacific Market Value (USD Million) Forecast by Functionality, 2020-2035
  • Table 45: South Asia & Pacific Market Value (USD Million) Forecast by Livestock Type, 2020-2035
  • Table 46: South Asia & Pacific Market Value (USD Million) Forecast by Delivery Format, 2020-2035
  • Table 47: South Asia & Pacific Market Value (USD Million) Forecast by Application Method, 2020-2035
  • Table 48: South Asia & Pacific Market Value (USD Million) Forecast by Sales Channel, 2020-2035
  • Table 49: Middle East and Africa Market Value (USD Million) Forecast by Country, 2020-2035
  • Table 50: Middle East and Africa Market Value (USD Million) Forecast by Type of Postbiotic, 2020-2035
  • Table 51: Middle East and Africa Market Value (USD Million) Forecast by Source, 2020-2035
  • Table 52: Middle East and Africa Market Value (USD Million) Forecast by Functionality, 2020-2035
  • Table 53: Middle East and Africa Market Value (USD Million) Forecast by Livestock Type, 2020-2035
  • Table 54: Middle East and Africa Market Value (USD Million) Forecast by Delivery Format, 2020-2035
  • Table 55: Middle East and Africa Market Value (USD Million) Forecast by Application Method, 2020-2035
  • Table 56: Middle East and Africa Market Value (USD Million) Forecast by Sales Channel, 2020-2035

List of Figures

  • Figure 1: Global Market Pricing Analysis
  • Figure 2: Global Market Value (USD Million) Forecast 2020-2035
  • Figure 3: Global Market Value Share and BPS Analysis by Type of Postbiotic, 2025 and 2035
  • Figure 4: Global Market Y-o-Y Growth Comparison by Type of Postbiotic, 2025-2035
  • Figure 5: Global Market Attractiveness Analysis by Type of Postbiotic
  • Figure 6: Global Market Value Share and BPS Analysis by Source, 2025 and 2035
  • Figure 7: Global Market Y-o-Y Growth Comparison by Source, 2025-2035
  • Figure 8: Global Market Attractiveness Analysis by Source
  • Figure 9: Global Market Value Share and BPS Analysis by Functionality, 2025 and 2035
  • Figure 10: Global Market Y-o-Y Growth Comparison by Functionality, 2025-2035
  • Figure 11: Global Market Attractiveness Analysis by Functionality
  • Figure 12: Global Market Value Share and BPS Analysis by Livestock Type, 2025 and 2035
  • Figure 13: Global Market Y-o-Y Growth Comparison by Livestock Type, 2025-2035
  • Figure 14: Global Market Attractiveness Analysis by Livestock Type
  • Figure 15: Global Market Value Share and BPS Analysis by Delivery Format, 2025 and 2035
  • Figure 16: Global Market Y-o-Y Growth Comparison by Delivery Format, 2025-2035
  • Figure 17: Global Market Attractiveness Analysis by Delivery Format
  • Figure 18: Global Market Value Share and BPS Analysis by Application Method, 2025 and 2035
  • Figure 19: Global Market Y-o-Y Growth Comparison by Application Method, 2025-2035
  • Figure 20: Global Market Attractiveness Analysis by Application Method
  • Figure 21: Global Market Value Share and BPS Analysis by Sales Channel, 2025 and 2035
  • Figure 22: Global Market Y-o-Y Growth Comparison by Sales Channel, 2025-2035
  • Figure 23: Global Market Attractiveness Analysis by Sales Channel
  • Figure 24: Global Market Value (USD Million) Share and BPS Analysis by Region, 2025 and 2035
  • Figure 25: Global Market Y-o-Y Growth Comparison by Region, 2025-2035
  • Figure 26: Global Market Attractiveness Analysis by Region
  • Figure 27: North America Market Incremental $ Opportunity, 2025-2035
  • Figure 28: Latin America Market Incremental $ Opportunity, 2025-2035
  • Figure 29: Europe Market Incremental $ Opportunity, 2025-2035
  • Figure 30: East Asia Market Incremental $ Opportunity, 2025-2035
  • Figure 31: South Asia & Pacific Market Incremental $ Opportunity, 2025-2035
  • Figure 32: Middle East and Africa Market Incremental $ Opportunity, 2025-2035
  • Figure 33: North America Market Value Share and BPS Analysis by Country, 2025 and 2035
  • Figure 34: North America Market Value Share and BPS Analysis by Type of Postbiotic, 2025 and 2035
  • Figure 35: North America Market Y-o-Y Growth Comparison by Type of Postbiotic, 2025-2035
  • Figure 36: North America Market Attractiveness Analysis by Type of Postbiotic
  • Figure 37: North America Market Value Share and BPS Analysis by Source, 2025 and 2035
  • Figure 38: North America Market Y-o-Y Growth Comparison by Source, 2025-2035
  • Figure 39: North America Market Attractiveness Analysis by Source
  • Figure 40: North America Market Value Share and BPS Analysis by Functionality, 2025 and 2035
  • Figure 41: North America Market Y-o-Y Growth Comparison by Functionality, 2025-2035
  • Figure 42: North America Market Attractiveness Analysis by Functionality
  • Figure 43: North America Market Value Share and BPS Analysis by Livestock Type, 2025 and 2035
  • Figure 44: North America Market Y-o-Y Growth Comparison by Livestock Type, 2025-2035
  • Figure 45: North America Market Attractiveness Analysis by Livestock Type
  • Figure 46: North America Market Value Share and BPS Analysis by Delivery Format, 2025 and 2035
  • Figure 47: North America Market Y-o-Y Growth Comparison by Delivery Format, 2025-2035
  • Figure 48: North America Market Attractiveness Analysis by Delivery Format
  • Figure 49: North America Market Value Share and BPS Analysis by Application Method, 2025 and 2035
  • Figure 50: North America Market Y-o-Y Growth Comparison by Application Method, 2025-2035
  • Figure 51: North America Market Attractiveness Analysis by Application Method
  • Figure 52: North America Market Value Share and BPS Analysis by Sales Channel, 2025 and 2035
  • Figure 53: North America Market Y-o-Y Growth Comparison by Sales Channel, 2025-2035
  • Figure 54: North America Market Attractiveness Analysis by Sales Channel
  • Figure 55: Latin America Market Value Share and BPS Analysis by Country, 2025 and 2035
  • Figure 56: Latin America Market Value Share and BPS Analysis by Type of Postbiotic, 2025 and 2035
  • Figure 57: Latin America Market Y-o-Y Growth Comparison by Type of Postbiotic, 2025-2035
  • Figure 58: Latin America Market Attractiveness Analysis by Type of Postbiotic
  • Figure 59: Latin America Market Value Share and BPS Analysis by Source, 2025 and 2035
  • Figure 60: Latin America Market Y-o-Y Growth Comparison by Source, 2025-2035
  • Figure 61: Latin America Market Attractiveness Analysis by Source
  • Figure 62: Latin America Market Value Share and BPS Analysis by Functionality, 2025 and 2035
  • Figure 63: Latin America Market Y-o-Y Growth Comparison by Functionality, 2025-2035
  • Figure 64: Latin America Market Attractiveness Analysis by Functionality
  • Figure 65: Latin America Market Value Share and BPS Analysis by Livestock Type, 2025 and 2035
  • Figure 66: Latin America Market Y-o-Y Growth Comparison by Livestock Type, 2025-2035
  • Figure 67: Latin America Market Attractiveness Analysis by Livestock Type
  • Figure 68: Latin America Market Value Share and BPS Analysis by Delivery Format, 2025 and 2035
  • Figure 69: Latin America Market Y-o-Y Growth Comparison by Delivery Format, 2025-2035
  • Figure 70: Latin America Market Attractiveness Analysis by Delivery Format
  • Figure 71: Latin America Market Value Share and BPS Analysis by Application Method, 2025 and 2035
  • Figure 72: Latin America Market Y-o-Y Growth Comparison by Application Method, 2025-2035
  • Figure 73: Latin America Market Attractiveness Analysis by Application Method
  • Figure 74: Latin America Market Value Share and BPS Analysis by Sales Channel, 2025 and 2035
  • Figure 75: Latin America Market Y-o-Y Growth Comparison by Sales Channel, 2025-2035
  • Figure 76: Latin America Market Attractiveness Analysis by Sales Channel
  • Figure 77: Europe Market Value Share and BPS Analysis by Country, 2025 and 2035
  • Figure 78: Europe Market Value Share and BPS Analysis by Type of Postbiotic, 2025 and 2035
  • Figure 79: Europe Market Y-o-Y Growth Comparison by Type of Postbiotic, 2025-2035
  • Figure 80: Europe Market Attractiveness Analysis by Type of Postbiotic
  • Figure 81: Europe Market Value Share and BPS Analysis by Source, 2025 and 2035
  • Figure 82: Europe Market Y-o-Y Growth Comparison by Source, 2025-2035
  • Figure 83: Europe Market Attractiveness Analysis by Source
  • Figure 84: Europe Market Value Share and BPS Analysis by Functionality, 2025 and 2035
  • Figure 85: Europe Market Y-o-Y Growth Comparison by Functionality, 2025-2035
  • Figure 86: Europe Market Attractiveness Analysis by Functionality
  • Figure 87: Europe Market Value Share and BPS Analysis by Livestock Type, 2025 and 2035
  • Figure 88: Europe Market Y-o-Y Growth Comparison by Livestock Type, 2025-2035
  • Figure 89: Europe Market Attractiveness Analysis by Livestock Type
  • Figure 90: Europe Market Value Share and BPS Analysis by Delivery Format, 2025 and 2035
  • Figure 91: Europe Market Y-o-Y Growth Comparison by Delivery Format, 2025-2035
  • Figure 92: Europe Market Attractiveness Analysis by Delivery Format
  • Figure 93: Europe Market Value Share and BPS Analysis by Application Method, 2025 and 2035
  • Figure 94: Europe Market Y-o-Y Growth Comparison by Application Method, 2025-2035
  • Figure 95: Europe Market Attractiveness Analysis by Application Method
  • Figure 96: Europe Market Value Share and BPS Analysis by Sales Channel, 2025 and 2035
  • Figure 97: Europe Market Y-o-Y Growth Comparison by Sales Channel, 2025-2035
  • Figure 98: Europe Market Attractiveness Analysis by Sales Channel
  • Figure 99: East Asia Market Value Share and BPS Analysis by Country, 2025 and 2035
  • Figure 100: East Asia Market Value Share and BPS Analysis by Type of Postbiotic, 2025 and 2035
  • Figure 101: East Asia Market Y-o-Y Growth Comparison by Type of Postbiotic, 2025-2035
  • Figure 102: East Asia Market Attractiveness Analysis by Type of Postbiotic
  • Figure 103: East Asia Market Value Share and BPS Analysis by Source, 2025 and 2035
  • Figure 104: East Asia Market Y-o-Y Growth Comparison by Source, 2025-2035
  • Figure 105: East Asia Market Attractiveness Analysis by Source
  • Figure 106: East Asia Market Value Share and BPS Analysis by Functionality, 2025 and 2035
  • Figure 107: East Asia Market Y-o-Y Growth Comparison by Functionality, 2025-2035
  • Figure 108: East Asia Market Attractiveness Analysis by Functionality
  • Figure 109: East Asia Market Value Share and BPS Analysis by Livestock Type, 2025 and 2035
  • Figure 110: East Asia Market Y-o-Y Growth Comparison by Livestock Type, 2025-2035
  • Figure 111: East Asia Market Attractiveness Analysis by Livestock Type
  • Figure 112: East Asia Market Value Share and BPS Analysis by Delivery Format, 2025 and 2035
  • Figure 113: East Asia Market Y-o-Y Growth Comparison by Delivery Format, 2025-2035
  • Figure 114: East Asia Market Attractiveness Analysis by Delivery Format
  • Figure 115: East Asia Market Value Share and BPS Analysis by Application Method, 2025 and 2035
  • Figure 116: East Asia Market Y-o-Y Growth Comparison by Application Method, 2025-2035
  • Figure 117: East Asia Market Attractiveness Analysis by Application Method
  • Figure 118: East Asia Market Value Share and BPS Analysis by Sales Channel, 2025 and 2035
  • Figure 119: East Asia Market Y-o-Y Growth Comparison by Sales Channel, 2025-2035
  • Figure 120: East Asia Market Attractiveness Analysis by Sales Channel
  • Figure 121: South Asia & Pacific Market Value Share and BPS Analysis by Country, 2025 and 2035
  • Figure 122: South Asia & Pacific Market Value Share and BPS Analysis by Type of Postbiotic, 2025 and 2035
  • Figure 123: South Asia & Pacific Market Y-o-Y Growth Comparison by Type of Postbiotic, 2025-2035
  • Figure 124: South Asia & Pacific Market Attractiveness Analysis by Type of Postbiotic
  • Figure 125: South Asia & Pacific Market Value Share and BPS Analysis by Source, 2025 and 2035
  • Figure 126: South Asia & Pacific Market Y-o-Y Growth Comparison by Source, 2025-2035
  • Figure 127: South Asia & Pacific Market Attractiveness Analysis by Source
  • Figure 128: South Asia & Pacific Market Value Share and BPS Analysis by Functionality, 2025 and 2035
  • Figure 129: South Asia & Pacific Market Y-o-Y Growth Comparison by Functionality, 2025-2035
  • Figure 130: South Asia & Pacific Market Attractiveness Analysis by Functionality
  • Figure 131: South Asia & Pacific Market Value Share and BPS Analysis by Livestock Type, 2025 and 2035
  • Figure 132: South Asia & Pacific Market Y-o-Y Growth Comparison by Livestock Type, 2025-2035
  • Figure 133: South Asia & Pacific Market Attractiveness Analysis by Livestock Type
  • Figure 134: South Asia & Pacific Market Value Share and BPS Analysis by Delivery Format, 2025 and 2035
  • Figure 135: South Asia & Pacific Market Y-o-Y Growth Comparison by Delivery Format, 2025-2035
  • Figure 136: South Asia & Pacific Market Attractiveness Analysis by Delivery Format
  • Figure 137: South Asia & Pacific Market Value Share and BPS Analysis by Application Method, 2025 and 2035
  • Figure 138: South Asia & Pacific Market Y-o-Y Growth Comparison by Application Method, 2025-2035
  • Figure 139: South Asia & Pacific Market Attractiveness Analysis by Application Method
  • Figure 140: South Asia & Pacific Market Value Share and BPS Analysis by Sales Channel, 2025 and 2035
  • Figure 141: South Asia & Pacific Market Y-o-Y Growth Comparison by Sales Channel, 2025-2035
  • Figure 142: South Asia & Pacific Market Attractiveness Analysis by Sales Channel
  • Figure 143: Middle East and Africa Market Value Share and BPS Analysis by Country, 2025 and 2035
  • Figure 144: Middle East and Africa Market Value Share and BPS Analysis by Type of Postbiotic, 2025 and 2035
  • Figure 145: Middle East and Africa Market Y-o-Y Growth Comparison by Type of Postbiotic, 2025-2035
  • Figure 146: Middle East and Africa Market Attractiveness Analysis by Type of Postbiotic
  • Figure 147: Middle East and Africa Market Value Share and BPS Analysis by Source, 2025 and 2035
  • Figure 148: Middle East and Africa Market Y-o-Y Growth Comparison by Source, 2025-2035
  • Figure 149: Middle East and Africa Market Attractiveness Analysis by Source
  • Figure 150: Middle East and Africa Market Value Share and BPS Analysis by Functionality, 2025 and 2035
  • Figure 151: Middle East and Africa Market Y-o-Y Growth Comparison by Functionality, 2025-2035
  • Figure 152: Middle East and Africa Market Attractiveness Analysis by Functionality
  • Figure 153: Middle East and Africa Market Value Share and BPS Analysis by Livestock Type, 2025 and 2035
  • Figure 154: Middle East and Africa Market Y-o-Y Growth Comparison by Livestock Type, 2025-2035
  • Figure 155: Middle East and Africa Market Attractiveness Analysis by Livestock Type
  • Figure 156: Middle East and Africa Market Value Share and BPS Analysis by Delivery Format, 2025 and 2035
  • Figure 157: Middle East and Africa Market Y-o-Y Growth Comparison by Delivery Format, 2025-2035
  • Figure 158: Middle East and Africa Market Attractiveness Analysis by Delivery Format
  • Figure 159: Middle East and Africa Market Value Share and BPS Analysis by Application Method, 2025 and 2035
  • Figure 160: Middle East and Africa Market Y-o-Y Growth Comparison by Application Method, 2025-2035
  • Figure 161: Middle East and Africa Market Attractiveness Analysis by Application Method
  • Figure 162: Middle East and Africa Market Value Share and BPS Analysis by Sales Channel, 2025 and 2035
  • Figure 163: Middle East and Africa Market Y-o-Y Growth Comparison by Sales Channel, 2025-2035
  • Figure 164: Middle East and Africa Market Attractiveness Analysis by Sales Channel
  • Figure 165: Global Market - Tier Structure Analysis
  • Figure 166: Global Market - Company Share Analysis

Frequently Asked Questions

How big is the Postbiotic Feed Additives Market in 2025?

The global Postbiotic Feed Additives Market is estimated at USD 0.36 billion (USD 356.1 million) in 2025.

What will be the size of the Postbiotic Feed Additives Market in 2035?

The market size is projected to reach USD 0.64 billion (USD 643.4 million) by 2035.

How much will the Postbiotic Feed Additives Market grow between 2025 and 2035?

The market is expected to expand at a 6.1% CAGR during 2025-2035.

What are the key product types in the Postbiotic Feed Additives Market?

Key product types include Inactivated Microbial Cells (17.8% share in 2025), Heat-killed Probiotics (14.6%), and Metabolite-based Postbiotics (12.8%), along with Autolyzed Yeasts, Cell-free Supernatants, SCFAs, Organic Acids, Bacteriocins, Enzymes & Peptides, and Fermentation Extracts.

Which functionality contributes the most in the Postbiotic Feed Additives Market in 2025?

Gut Health Improvement is the leading functionality, accounting for 26.4% share in 2025, followed by Immunity Enhancement (21.3%) and Pathogen Control (18.5%).

Explore Similar Insights

Future Market Insights

Postbiotic Feed Additives Market