EU postbiotic supplements industry is likely to reach from USD 4.0 million in 2025 to USD 12.8 million by 2035, advancing at a robust CAGR of 12.3%. The capsules & tablets segment is expected to lead sales with a 46.0% share in 2025, while the drug stores distribution channel is anticipated to account for 67.0% of the sales segment.
Future Market Insights, celebrated for global coverage of consumer dietary preferences and ingredient behavior, states that the industry size is expected to grow by nearly 3.2X during the same period, supported by the increasing awareness of gut-health benefits beyond probiotics, growing scientific validation of metabolite-based supplementation, and developing applications across digestive health, immune support, and metabolic wellness throughout European healthcare markets.
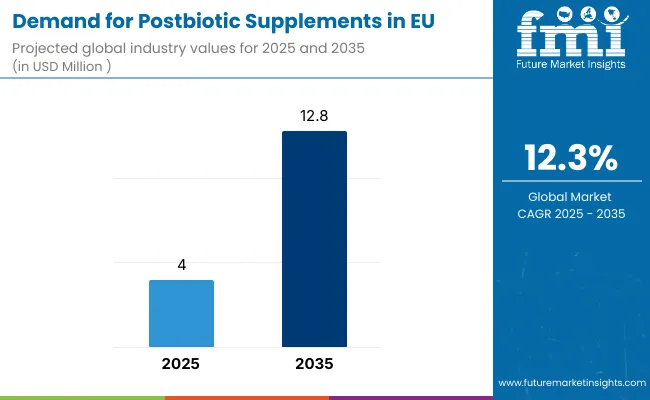
Between 2025 and 2030, EU postbiotic supplements demand is projected to expand from USD 4.0 million to USD 7.1 million, resulting in a value increase of USD 3.1 million, which represents 35.2% of the total forecast growth for the decade. This phase of development will be shaped by rising consumer education about postbiotics as the next evolution in microbiome health, increasing clinical evidence supporting metabolite-based interventions, and growing adoption among healthcare practitioners recognizing postbiotics' stability advantages over live probiotics. Manufacturers are expanding their product portfolios to address the evolving demand for scientifically-validated postbiotic formulations with standardized metabolite profiles, heat-stable compositions, and targeted health benefits supporting specific wellness outcomes.
From 2030 to 2035, sales are forecast to grow from USD 7.1 million to USD 12.8 million, adding another USD 5.7 million, which constitutes 64.8% of the overall ten-year expansion. This period is expected to be characterized by mainstream consumer acceptance of postbiotics as essential gut health supplements, integration of postbiotic ingredients in functional foods and beverages, and development of condition-specific formulations targeting digestive disorders, immune dysfunction, and metabolic health. The growing emphasis on precision nutrition and increasing understanding of metabolite-microbiome interactions will drive demand for advanced postbiotic products that deliver predictable health outcomes with superior safety profiles compared to traditional probiotics.
Between 2020 and 2025, EU postbiotic supplements sales experienced steady expansion at a CAGR of 12.6%, growing from USD 2.2 million to USD 4.0 million. This period was driven by pioneering research demonstrating postbiotic efficacy, early adopter interest among health-conscious consumers, and growing recognition that microbial metabolites rather than live bacteria may deliver many probiotic benefits. The industry developed as supplement manufacturers and biotechnology companies recognized the commercial potential of heat-killed bacteria, fermentation metabolites, and cell wall components. Product innovations, clinical validation studies, and educational initiatives began establishing scientific credibility and consumer awareness for postbiotic supplementation.
Industry expansion is being supported by the rapid advancement in microbiome science across European research institutions and the corresponding demand for next-generation gut health solutions that overcome traditional probiotic limitations including stability challenges, colonization uncertainty, and manufacturing complexity. Modern consumers increasingly understand that beneficial effects of probiotics often derive from their metabolites rather than live bacteria, driving demand for postbiotic products that deliver consistent bioactive compounds without viability concerns, standardized therapeutic molecules with batch-to-batch consistency, and enhanced safety profiles suitable for immunocompromised populations unable to consume live microorganisms.
The growing body of mechanistic research elucidating postbiotic modes of action, including short-chain fatty acid production, antimicrobial peptide activity, and immune modulation pathways, is driving demand for scientifically-substantiated postbiotic supplements from manufacturers with appropriate research credentials and quality standards. Regulatory authorities are increasingly recognizing postbiotics as distinct supplement category requiring specific guidelines for characterization, safety assessment, and efficacy substantiation to ensure consumer protection and product quality. Scientific publications and clinical trials are providing evidence supporting postbiotic benefits in gut barrier function, inflammatory regulation, and pathogen inhibition, requiring specialized production methods and analytical protocols for metabolite identification, potency standardization, and stability optimization throughout shelf life.
Sales are segmented by product form, distribution channel, and country. By product form, demand is divided into soft-gel & chews, capsules & tablets, and powder & granules. Based on distribution channel, sales are categorized into drug stores, health & beauty stores, supermarkets & hypermarkets, and online retailing. Regionally, demand is focused on Germany, France, Italy, Spain, the Netherlands, and the Rest of Europe.
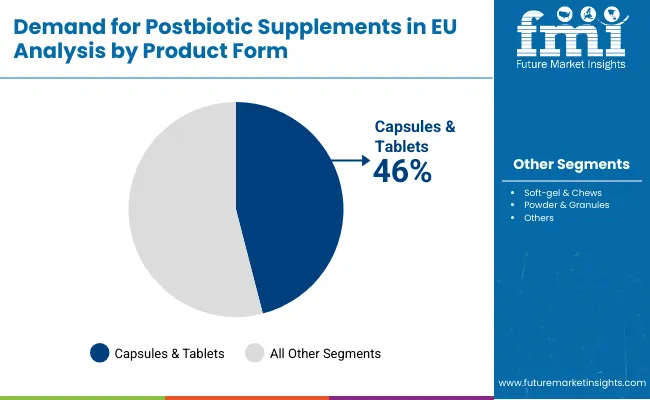
The capsules & tablets segment is projected to account for 46.0% of EU postbiotic supplements sales in 2025, declining slightly to 42.0% by 2035, establishing itself as the preferred format across pharmaceutical and nutraceutical channels. This commanding position is fundamentally supported by capsules' superior protection of sensitive metabolites, convenient dosing for daily supplementation, and established consumer familiarity from traditional supplement consumption. The capsule format delivers exceptional versatility, providing manufacturers with reliable encapsulation technologies that preserve postbiotic activity, enable targeted intestinal delivery, and facilitate combination formulations essential for comprehensive gut health protocols.
This segment benefits from advanced encapsulation technologies including enteric coating, delayed-release mechanisms, and moisture-barrier systems that maintain postbiotic stability throughout distribution and storage. The capsules & tablets offer advantages in precise dosing standardization, quality control implementation, and regulatory compliance, supported by established pharmaceutical manufacturing infrastructure that ensures consistent product quality and therapeutic efficacy.
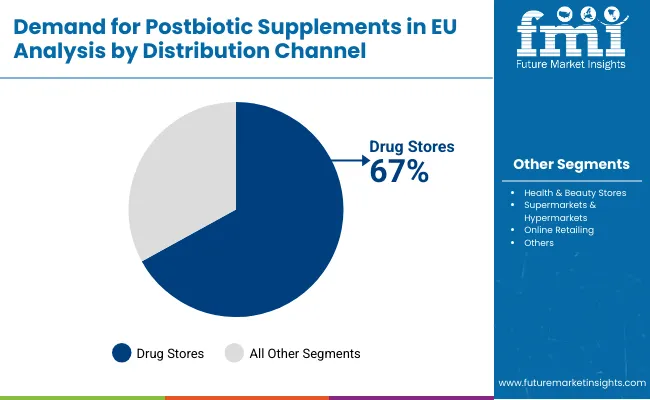
Drug stores (pharmacies) are positioned to represent 67.0% of total postbiotic supplements demand across European operations in 2025, moderating to 59.0% by 2035, reflecting the channel's dominance as the primary access point for health supplements requiring professional guidance. This considerable share directly demonstrates that drug stores represent the trusted distribution channel, with consumers preferring pharmacy purchases for novel supplement categories where pharmacist consultation provides valuable education, product selection assistance, and safety assurance for emerging ingredients like postbiotics.
European pharmacies increasingly position postbiotics within comprehensive gut health categories, driving demand through professional recommendation systems emphasizing evidence-based products, quality certification from reputable manufacturers, and integration with conventional digestive health treatments. The segment benefits from pharmacist education programs sponsored by manufacturers, scientific literature distribution supporting product credibility, and point-of-sale materials explaining postbiotic mechanisms and benefits to curious consumers.
EU postbiotic supplements sales are advancing rapidly due to increasing scientific validation of metabolite-based therapeutics, growing consumer awareness of microbiome health importance, and rising demand for stable alternatives to probiotics. The industry faces challenges, including limited consumer understanding of postbiotic concepts requiring extensive education, higher production costs for standardized metabolite preparations, and regulatory uncertainties regarding health claims and category definitions. Continued innovation in production technologies and clinical validation remains central to industry development.
The rapidly accelerating development of metabolite standardization technologies is fundamentally transforming postbiotic supplements from variable fermentation products to precisely characterized therapeutic preparations, enabling consistent potency previously unattainable through traditional fermentation approaches. Advanced analytical platforms featuring mass spectrometry, metabolomics profiling, and bioactivity assays allow manufacturers to create postbiotic products with defined metabolite compositions, verified biological activity, and batch-to-batch consistency comparable to pharmaceutical standards. These standardization innovations prove particularly transformative for clinical applications, healthcare practitioner adoption, and regulatory approval processes, where reproducible composition directly determines therapeutic reliability.
Major postbiotic manufacturers invest heavily in analytical method development, metabolite library establishment, and quality control systems, recognizing that standardization represents breakthrough solutions for efficacy variability challenges limiting category expansion. Manufacturers collaborate with analytical laboratories, research institutions, and regulatory consultants to develop validated methods that characterize postbiotic composition while maintaining commercial viability and scalability supporting market growth.
Modern postbiotic producers systematically implement precision fermentation technologies, including controlled bioreactor systems, optimized growth media, and targeted metabolite production that deliver specific bioactive compounds, enhanced therapeutic potency, and reduced production costs compared to traditional fermentation methods. Strategic integration of precision fermentation enables manufacturers to produce designer postbiotics with tailored metabolite profiles where specificity directly determines health benefits and clinical applications. These production improvements prove essential for pharmaceutical development, as drug companies demand consistent composition, validated production processes, and scalable manufacturing supporting commercial requirements.
Companies implement extensive fermentation optimization programs, strain selection protocols targeting specific metabolite production, and downstream processing innovations maximizing yield and purity, including filtration technologies, concentration methods, and stabilization processes. Manufacturers leverage precision fermentation advantages in scientific communications, highlighting controlled production environments, sustainability benefits through reduced resource consumption, and quality advantages positioning precision-fermented postbiotics as superior alternatives to traditional preparations.
European supplement manufacturers increasingly develop condition-specific postbiotic formulations targeting particular health conditions through tailored metabolite combinations, synergistic ingredient additions, and clinically-validated protocols that differentiate products through therapeutic specificity. This specialization trend enables manufacturers to command premium pricing through targeted efficacy claims, create defensible market positions through proprietary formulations, and build brand loyalty among consumers seeking solutions for specific health concerns. Condition-specific development proves particularly important for healthcare practitioner channels where evidence-based protocols drive recommendation patterns and patient outcomes determine continued usage.
The development of targeted postbiotic systems, including formulations for irritable bowel syndrome, immune support protocols, and metabolic health combinations expands manufacturers' abilities to address diverse consumer needs delivering measurable health improvements without broad-spectrum approaches. Brands collaborate with clinical researchers, healthcare practitioners, and patient organizations to develop formulations balancing therapeutic efficacy with safety profiles, supporting medical positioning and professional endorsement while maintaining supplement regulatory status.
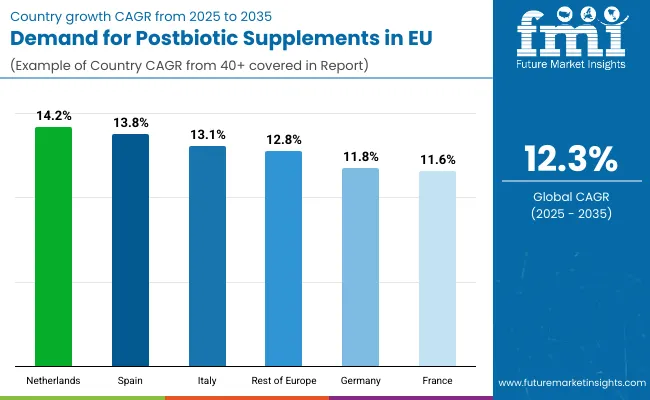
EU postbiotic supplements sales are projected to grow from USD 4.0 million in 2025 to USD 12.8 million by 2035, registering a robust CAGR of 12.3% over the forecast period. The Netherlands is expected to demonstrate the strongest growth trajectory with a 14.2% CAGR, supported by innovative biotechnology sector, advanced microbiome research infrastructure, and early adoption of novel supplement categories. Spain follows with 13.8% CAGR, attributed to rapidly expanding wellness market and increasing health consciousness driving supplement adoption.
Germany maintains the largest share at 37.5% in 2025, driven by established pharmaceutical infrastructure and strong practitioner channels, while growing at 11.8% CAGR. France follows with 37.5% share and 11.6% CAGR growth reflecting market maturity. Italy demonstrates 13.1% CAGR, benefiting from growing wellness culture and pharmacy channel strength.
| Country | CAGR % (2025-2035) |
|---|---|
| Netherlands | 14.2% |
| Spain | 13.8% |
| Italy | 13.1% |
| Rest of Europe | 12.8% |
| Germany | 11.8% |
| France | 11.6% |
EU postbiotic supplements sales demonstrate differentiated growth trajectories across major European economies, with emerging markets significantly outpacing established ones through 2035, driven by varying market maturity levels, healthcare system dynamics, and consumer education stages. Netherlands shows exceptional growth from USD 0.2 million in 2025 to USD 0.7 million by 2035 at 14.2% CAGR. Spain expands rapidly from USD 0.2 million to USD 0.7 million at 13.8% CAGR. Italy records strong growth from USD 0.3 million to USD 1.1 million at 13.1% CAGR. Rest of Europe demonstrates USD 0.3 million to USD 1.1 million at 12.8% CAGR. Germany shows steady expansion from USD 1.5 million to USD 4.6 million at 11.8% CAGR. France maintains consistent growth from USD 1.5 million to USD 4.6 million at 11.6% CAGR. Overall, sales show varied regional development reflecting different healthcare practitioner adoption rates, consumer education levels, and distribution channel evolution across European countries.
Revenue from postbiotic supplements in Germany is projected to exhibit steady growth with a CAGR of 11.8% through 2035, driven by exceptionally well-developed pharmaceutical distribution networks, comprehensive healthcare practitioner education programs, and strong consumer trust in pharmacy-recommended supplements throughout the country. Germany's sophisticated understanding of microbiome science and internationally recognized leadership in biotechnology research are creating substantial demand for evidence-based postbiotic products across therapeutic applications.
Major pharmacy chains, including DocMorris, Europa Apotheek, and traditional Apotheken networks, systematically expand postbiotic selections, often positioning them prominently within digestive health categories and supporting sales through pharmacist education and recommendation protocols. German demand benefits from high healthcare expenditure, substantial insurance coverage for preventive health products, and cultural acceptance of supplement usage that naturally supports postbiotic adoption across mainstream consumers seeking digestive wellness solutions.
The relatively moderate growth rate reflects Germany's mature supplement market where established probiotic usage creates both opportunity and competition for postbiotic positioning, requiring extensive education to differentiate metabolite-based benefits from traditional live bacteria supplements.
Growth drivers:
Revenue from postbiotic supplements in France is expanding at a CAGR of 11.6%, supported by strong pharmacy distribution networks, growing microbiome awareness among healthcare professionals, and increasing consumer sophistication regarding gut health supplementation. France's centralized healthcare system and pharmacy-centric supplement distribution create unique market dynamics favoring professionally-endorsed products with scientific substantiation like postbiotics.
Major pharmacy cooperatives, including Groupement Pharmaceutique de l'Union Européenne and Alliance Healthcare France, facilitate postbiotic distribution through comprehensive pharmacy networks reaching urban and rural populations. French sales particularly benefit from medical community engagement, with gastroenterologists and general practitioners increasingly recognizing postbiotic benefits for patients unable to tolerate live probiotics. Consumer education initiatives through pharmacy consultations and health magazines significantly enhance understanding of postbiotic mechanisms and advantages over traditional probiotics.
The moderate growth rate reflects France's established probiotic market requiring careful positioning to differentiate postbiotics while avoiding confusion with existing gut health supplements consumers already understand and utilize regularly.
Success factors:
Revenue from postbiotic supplements in Italy is growing at a robust CAGR of 13.1%, fundamentally driven by expanding wellness consciousness, strong pharmacy tradition supporting supplement recommendations, and growing integration of gut health into holistic wellness approaches. Italy's evolving healthcare landscape increasingly emphasizes preventive nutrition, creating favorable conditions for innovative supplement categories addressing fundamental health through microbiome optimization.
Major Italian pharmacy chains, including Farmacia Loreto Gallo, Hippocrates Holding, and independent farmacias, actively promote postbiotic supplements through professional consultation services and educational initiatives explaining metabolite benefits. Italian sales particularly benefit from Mediterranean diet culture emphasizing fermented foods, creating natural consumer receptivity to fermentation-derived health products. The country's growing sports nutrition sector also drives postbiotic adoption for performance and recovery applications beyond traditional digestive health positioning.
Development factors:
Demand for postbiotic supplements in Spain is projected to grow at an impressive CAGR of 13.8%, substantially supported by rapidly evolving health consciousness, expanding distribution beyond traditional pharmacies, and increasing consumer education about microbiome health importance. Spanish market transformation from traditional medicine toward preventive supplementation positions postbiotics as aligned with contemporary wellness trends, particularly among younger demographics embracing scientific nutrition approaches.
Major Spanish retailers, including El Corte Inglés pharmacy sections, Farmacias Trébol network, and emerging online platforms like PromoFarma, systematically introduce postbiotic offerings with competitive pricing and consumer education supporting category development. Spain's growing fitness culture and increasing inflammatory bowel disease prevalence drive specific postbiotic applications for gut health restoration and maintenance. The country's relatively low baseline enables rapid growth as consumer awareness increases and distribution expands beyond specialized channels.
Growth enablers:
Demand for postbiotic supplements in the Netherlands is expanding at a leading CAGR of 14.2%, fundamentally driven by exceptional microbiome research capabilities, progressive regulatory environment for novel ingredients, and sophisticated consumer base with high scientific literacy regarding gut health. Dutch companies demonstrate particular strength in fermentation technology and metabolite characterization, positioning the Netherlands as European innovation hub for advanced postbiotic development.
Netherlands sales significantly benefit from world-class research institutions, including Wageningen University's microbiome research center and TNO's gut health programs, conducting cutting-edge postbiotic studies advancing scientific understanding. Dutch consumers' early adoption tendencies and willingness to try innovative health products support rapid market penetration for next-generation postbiotic formulations, particularly those featuring validated metabolite profiles or novel delivery systems. The country's leadership in precision fermentation and biotechnology creates unique advantages for local postbiotic producers developing proprietary strains and production methods.
Innovation drivers:
Revenue from postbiotic supplements in Rest of Europe is expanding at 12.8% CAGR, representing diverse smaller markets including Belgium, Austria, Scandinavian countries, and Eastern European nations experiencing varied development stages. These markets collectively demonstrate growing potential as consumer education increases, distribution channels develop, and regulatory frameworks clarify supporting postbiotic commercialization across previously underserved regions.
Emerging European markets benefit from increasing health consciousness, expanding modern retail infrastructure, and growing access to international supplement brands introducing postbiotic products. Nordic countries particularly show strong adoption potential given high health awareness and supplement usage rates, while Eastern European markets represent longer-term opportunities as economic development enables premium supplement purchases.
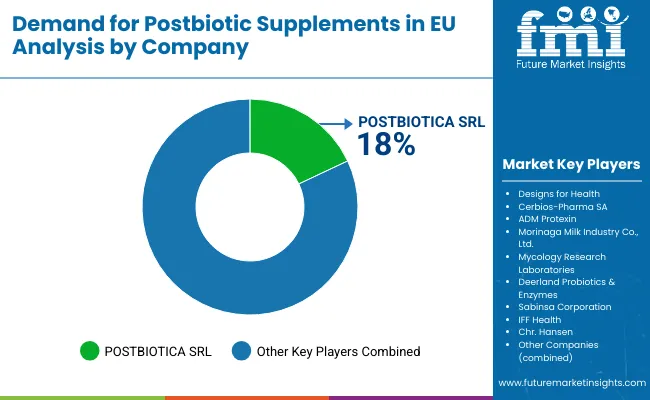
EU postbiotic supplements sales are defined by competition among specialized postbiotic companies, established probiotic manufacturers, and emerging biotechnology firms. Companies are investing in metabolite characterization, clinical validation, production optimization, and educational initiatives to deliver high-quality, scientifically-substantiated, and commercially viable postbiotic solutions. Strategic partnerships with research institutions, healthcare practitioners, and distribution networks emphasizing scientific credibility and professional endorsement are central to strengthening competitive position.
Major participants include POSTBIOTICA SRL with an estimated 18.0% share, leveraging its specialized focus on postbiotic development, European headquarters location, and comprehensive research program through proprietary technology platforms. POSTBIOTICA benefits from first-mover advantages, scientific publication record, and established relationships with European distributors supporting market penetration.
Designs for Health holds approximately 12.0% share, emphasizing practitioner channel expertise, evidence-based formulation approach, and professional education programs supporting healthcare provider engagement. Designs for Health's success in developing clinically-oriented postbiotic products with detailed protocols creates strong positioning among healthcare practitioners, supported by educational resources and scientific substantiation materials.
Other companies collectively hold 70.0% share, reflecting the nascent nature of European postbiotic supplements sales, where numerous specialized manufacturers, probiotic companies expanding into postbiotics, ingredient suppliers developing proprietary metabolites, and emerging startups serve specific applications, distribution channels, and consumer segments. This competitive environment provides opportunities for differentiation through unique metabolite profiles, condition-specific formulations, innovative delivery systems, and scientific validation supporting therapeutic positioning.
| Item | Value |
|---|---|
| Quantitative Units | USD 12.8 million |
| Product Form | Soft-gel & Chews, Capsules & Tablets, Powder & Granules |
| Distribution Channel | Drug Stores, Health & Beauty Stores, Supermarkets & Hypermarkets, Online Retailing |
| Countries Covered | Germany, France, Italy, Spain, the Netherlands, and the Rest of Europe |
| Key Companies Profiled | POSTBIOTICA SRL, Designs for Health, Specialized manufacturers |
| Additional Attributes | Dollar sales by product form and distribution channel; regional demand trends across major European economies; competitive landscape analysis with specialized postbiotic companies and established supplement manufacturers; consumer preferences for various delivery formats; integration with microbiome science and metabolite research; innovations in fermentation technology and standardization; adoption across pharmacy and practitioner channels; regulatory framework evolution for postbiotic categorization; educational initiatives and market development strategies; penetration analysis for emerging supplement category |
Product Form
The global demand for postbiotic supplements in EU is estimated to be valued at USD 4.0 million in 2025.
The market size for the demand for postbiotic supplements in EU is projected to reach USD 12.8 million by 2035.
The demand for postbiotic supplements in EU is expected to grow at a 12.3% CAGR between 2025 and 2035.
The key product types in demand for postbiotic supplements in EU are capsules & tablets, soft-gel & chews and powder & granules.
In terms of distribution channel, drug stores segment to command 67.0% share in the demand for postbiotic supplements in EU in 2025.


Our Research Products

The "Full Research Suite" delivers actionable market intel, deep dives on markets or technologies, so clients act faster, cut risk, and unlock growth.

The Leaderboard benchmarks and ranks top vendors, classifying them as Established Leaders, Leading Challengers, or Disruptors & Challengers.

Locates where complements amplify value and substitutes erode it, forecasting net impact by horizon

We deliver granular, decision-grade intel: market sizing, 5-year forecasts, pricing, adoption, usage, revenue, and operational KPIs—plus competitor tracking, regulation, and value chains—across 60 countries broadly.

Spot the shifts before they hit your P&L. We track inflection points, adoption curves, pricing moves, and ecosystem plays to show where demand is heading, why it is changing, and what to do next across high-growth markets and disruptive tech

Real-time reads of user behavior. We track shifting priorities, perceptions of today’s and next-gen services, and provider experience, then pace how fast tech moves from trial to adoption, blending buyer, consumer, and channel inputs with social signals (#WhySwitch, #UX).

Partner with our analyst team to build a custom report designed around your business priorities. From analysing market trends to assessing competitors or crafting bespoke datasets, we tailor insights to your needs.
Supplier Intelligence
Discovery & Profiling
Capacity & Footprint
Performance & Risk
Compliance & Governance
Commercial Readiness
Who Supplies Whom
Scorecards & Shortlists
Playbooks & Docs
Category Intelligence
Definition & Scope
Demand & Use Cases
Cost Drivers
Market Structure
Supply Chain Map
Trade & Policy
Operating Norms
Deliverables
Buyer Intelligence
Account Basics
Spend & Scope
Procurement Model
Vendor Requirements
Terms & Policies
Entry Strategy
Pain Points & Triggers
Outputs
Pricing Analysis
Benchmarks
Trends
Should-Cost
Indexation
Landed Cost
Commercial Terms
Deliverables
Brand Analysis
Positioning & Value Prop
Share & Presence
Customer Evidence
Go-to-Market
Digital & Reputation
Compliance & Trust
KPIs & Gaps
Outputs
Full Research Suite comprises of:
Market outlook & trends analysis
Interviews & case studies
Strategic recommendations
Vendor profiles & capabilities analysis
5-year forecasts
8 regions and 60+ country-level data splits
Market segment data splits
12 months of continuous data updates
DELIVERED AS:
PDF EXCEL ONLINE
Europe Postbiotic Pet Food Market Insights – Growth, Innovations & Forecast 2025-2035
Postbiotic Supplements Market Analysis - Size, Share, and Forecast Outlook 2025 to 2035
EU Longevity Supplements Sales Analysis Size and Share Forecast Outlook 2025 to 2035
Comprehensive Analysis of Europe Pet Food Supplements Market by Nature, Form, Pet Type and Distribution Channel through 2035
Western Europe Dietary Supplements Market Analysis by Ingredients, Form, Application, and Country Through 2025 to 2035
Demand for Dietary Supplements in EU Size and Share Forecast Outlook 2025 to 2035
Demand for Calcium Supplements in EU Size and Share Forecast Outlook 2025 to 2035
Demand for Fertility Supplements in EU Size and Share Forecast Outlook 2025 to 2035
Demand for Probiotic Supplements in EU Size and Share Forecast Outlook 2025 to 2035
Demand for Postnatal Health Supplements in EU Size and Share Forecast Outlook 2025 to 2035
Europe Radiotherapy Patient Positioning Market Size and Share Forecast Outlook 2025 to 2035
Europe Polyvinyl Alcohol Industry Analysis Size and Share Forecast Outlook 2025 to 2035
Europe Cruise Market Forecast and Outlook 2025 to 2035
Europium Market Forecast and Outlook 2025 to 2035
Eucommia Leaf Extract Market Size and Share Forecast Outlook 2025 to 2035
Europe Massage Therapy Service Market Size and Share Forecast Outlook 2025 to 2035
Europe Cement Market Analysis Size and Share Forecast Outlook 2025 to 2035
European Union Tourism Industry Size and Share Forecast Outlook 2025 to 2035
Europe Injection Molding Machines Market Size and Share Forecast Outlook 2025 to 2035
Europe Injection Moulders Market Size and Share Forecast Outlook 2025 to 2035

Thank you!
You will receive an email from our Business Development Manager. Please be sure to check your SPAM/JUNK folder too.
Chat With
MaRIA