Methodology

Pressurized Water Reactor System Market Forecast and Outlook 2025 to 2035

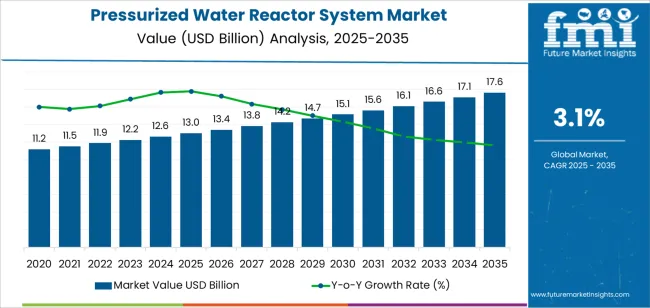
The global pressurized water reactor (PWR) system market is valued at USD 13.0 billion in 2025 and is projected to reach USD 17.6 billion by 2035, expanding at a CAGR of 3.1%. This increase represents an absolute dollar opportunity of USD 4.6 billion over the forecast period. Based on annualized variance modeling, the Growth Rate Volatility Index (GRVI) for the 2025 to 2035 period is 0.17, reflecting a low-volatility growth curve driven by steady investment in nuclear infrastructure modernization and controlled reactor fleet expansion across key regions.

Market stability is reinforced by long project lifecycles, government-backed funding mechanisms, and consistent maintenance demand from operational reactors. The transition toward advanced PWR designs featuring enhanced thermal efficiency, improved safety systems, and digital monitoring integration continues to support predictable capital flow and moderate technological turnover.

Asia Pacific, led by China, India, and South Korea, remains the most dynamic region in terms of reactor construction and capacity additions. Europe and North America sustain moderate replacement and refurbishment activity, focusing on extending reactor lifespans and meeting carbon reduction targets. Through 2035, regulatory harmonization, component localization, and safety standardization will preserve structural growth consistency, maintaining low GRVI levels and ensuring stable expansion across the global PWR system market.
Quick Stats for the Pressurized Water Reactor System Market

  • Pressurized Water Reactor System Market Value (2025): USD 13.0 billion
  • Pressurized Water Reactor System Market Forecast Value (2035): USD 17.6 billion
  • Pressurized Water Reactor System Market Forecast CAGR (2025 to 2035): 3.1%
  • Leading Type in Pressurized Water Reactor System Market: Small & Medium Type
  • Key Growth Regions: Asia Pacific, Europe, and North America
  • Top Players: Westinghouse Electric, GE, MHI, B&W, Framatome, Siemens, Rosatom, CNNC, KHNP, Holtec International

Pressurized Water Reactor System Market Market Value Analysis

What is the Growth Forecast for the Pressurized Water Reactor System Market Market through 2035?

Between 2025 and 2030, the Pressurized Water Reactor (PWR) System Market is anticipated to grow from USD 13.0 billion to USD 15.1 billion, marking an accelerated growth phase of 16.2% over five years. This acceleration reflects the renewed global interest in nuclear power as a reliable low-carbon energy source. Governments and utilities are increasing investments in reactor modernization, safety enhancement, and next-generation pressurized water reactor designs. The transition toward small modular reactors (SMRs) and the extension of existing reactor lifespans are driving early-cycle growth. Additionally, advancements in digital monitoring, fuel efficiency, and reactor cooling systems are reinforcing the technology’s role in achieving long-term decarbonization targets.

From 2030 to 2035, the market is expected to expand from USD 15.1 billion to USD 17.6 billion, representing a slight deceleration in growth at 16.6% over the subsequent period. This deceleration corresponds with the market’s entry into a maturity phase, where large-scale infrastructure projects stabilize and new installations are offset by longer approval cycles and stringent regulatory frameworks. However, the demand for safer, more efficient reactors will persist, supported by advancements in reactor materials, passive safety systems, and nuclear waste minimization. Strategic collaborations between reactor technology developers, governments, and energy utilities will continue to sustain innovation, ensuring stable, long-term market performance.

Pressurized Water Reactor System Market Key Takeaways

Metric Value
Market Value (2025) USD 13.0 billion
Market Forecast Value (2035) USD 17.6 billion
Forecast CAGR (2025 to 2035) 3.1%

Why Is the Pressurized Water Reactor System Market Gaining Momentum in the Evolving Global Energy Landscape?

The pressurized water reactor (PWR) system market is gaining momentum as nations pursue stable, low-emission power generation amid rising global electricity demand. PWR technology, which uses high-pressure water as both coolant and moderator, remains the most widely adopted nuclear reactor design due to its operational reliability, thermal efficiency, and established safety record. Countries expanding nuclear infrastructure-including China, India, and the United States continue investing in large-scale and small modular PWR units to diversify energy portfolios and reduce dependence on fossil fuels. System suppliers focus on refining core design, corrosion-resistant materials, and digital control integration to enhance long-term efficiency and safety margins.

Market development is supported by government-led nuclear modernization programs and international collaboration in reactor lifecycle management. Upgrades to existing facilities, including replacement of pressure vessels, steam generators, and control rod mechanisms, sustain aftermarket demand. Growing attention to fuel-cycle optimization and waste minimization also stimulates innovation in reactor coolant chemistry and material science. Despite persistent public scrutiny and regulatory complexity, the market benefits from policy frameworks linking nuclear energy to decarbonization objectives. Technological advances in modular construction, remote diagnostics, and accident-tolerant fuel systems reinforce the continued viability of pressurized water reactors as a critical component of future energy infrastructure worldwide.

How Are Reactor Configurations and End-use Applications Structuring the Global Pressurized Water Reactor System Market?

The pressurized water reactor (PWR) system market is segmented by classification, application, and region. By classification, the market is divided into small and medium type and large type reactors. Based on application, it is categorized into nuclear power plants, ships, and others. Regionally, the market is segmented into North America, Europe, East Asia, South Asia, Latin America, and the Middle East & Africa. These segments capture reactor scale differentiation, end-use deployment, and regional infrastructure trends shaping global nuclear technology adoption and power generation strategies.
What Drives the Dominance of Small and Medium Type Reactors in the Market?

Pressurized Water Reactor System Market Analysis By Classification

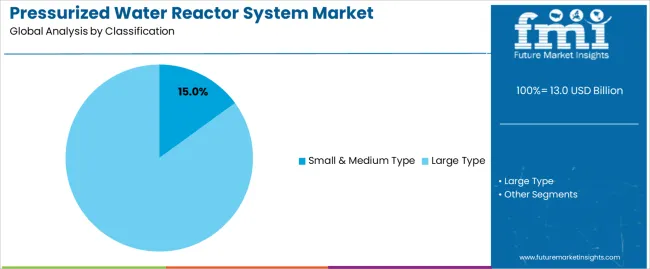
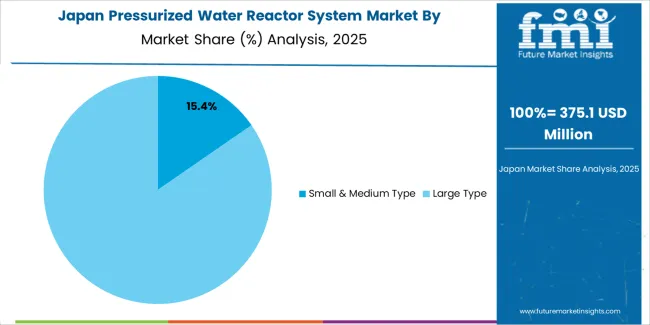
The small and medium type segment accounts for approximately 15.0% of the global pressurized water reactor system market in 2025, maintaining a key position in reactor development and deployment. This segment’s importance lies in its operational flexibility, modular construction, and suitability for decentralized power generation. Small and medium reactors (SMRs) offer advantages in scalability, safety, and siting flexibility, enabling installation in regions with limited grid capacity or high seismic activity.

The segment is supported by continued research into compact reactor designs emphasizing enhanced passive safety systems and reduced capital expenditure. These reactors are increasingly favored for their potential integration into hybrid energy systems combining nuclear and renewable sources. Governments and energy operators in East Asia, North America, and Europe are actively investing in pilot SMR projects to diversify national energy portfolios. The segment also benefits from reduced construction timelines and simplified maintenance procedures, improving economic feasibility for smaller-scale utilities. The growing emphasis on modular, low-carbon energy infrastructure continues to reinforce the strategic relevance of small and medium type PWR systems within the global nuclear technology market landscape.
Why Do Nuclear Power Plants Represent the Largest Application Area for PWR Systems?

Pressurized Water Reactor System Market Analysis By Application

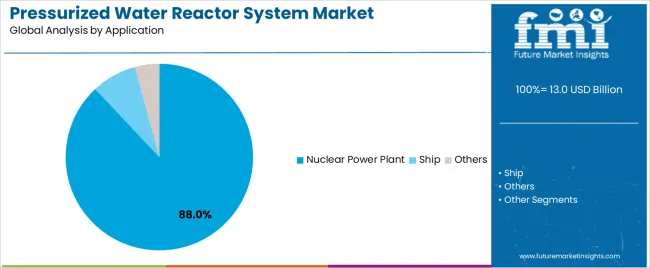
The nuclear power plant segment represents about 88.0% of the total pressurized water reactor system market in 2025, making it the dominant application category. This leadership reflects the role of PWR technology as the cornerstone of global civilian nuclear power generation. Pressurized water reactors provide high thermal efficiency, reliable operation, and stable control characteristics, making them the preferred choice for base-load electricity production in large-scale power facilities.

The segment’s expansion is driven by ongoing demand for low-carbon energy and modernization of existing reactor fleets in countries with established nuclear programs. PWR systems are employed in the majority of operational nuclear power stations across North America, Europe, Russia, and East Asia, supported by standardized safety frameworks and proven performance history. Recent technological developments focus on fuel efficiency optimization, reactor lifetime extension, and digital control integration. Emerging economies continue to invest in PWR infrastructure to address rising energy consumption while meeting emission reduction commitments. The nuclear power plant segment remains the core of the global PWR market, underpinning energy stability and security across industrialized and developing regions pursuing sustainable base-load generation capacity.

What are the Key Trends, Drivers, and Restraints in the Pressurized Water Reactor System Market?

The pressurized water reactor (PWR) system market is advancing as nuclear energy re-emerges as a critical component of global low-carbon power strategies. PWR systems remain the dominant reactor type worldwide and are being adopted both in new builds and in upgrades to existing plants. Expansion is supported by strong energy-security goals, heightened demand for baseload power, and progressive regulatory frameworks favouring clean technologies. The market is tempered by high capital expenditures, lengthy licensing processes, and concerns over nuclear safety and waste management. Suppliers and utilities are moving towards modular designs, digital monitoring systems, and standardised global platforms to reduce cost and timeline risk.

What regulatory and infrastructure-investment factors are spurring PWR system deployment?

Governments and utilities are increasingly investing in PWR systems as part of their energy transition strategies and efforts to ensure reliable, carbon-free baseload power. The USP for system providers in this context is “fully integrated turn-key PWR solutions with modularisation and global certification pathways that shorten licensing time and minimise up-front risk” helping utilities meet policy targets and secure financing. As nuclear power is recognised for low-emission output and long-term operation, these investments drive demand for mature PWR technologies across regions including Europe, Asia-Pacific and Middle East.

What technical and cost-related challenges restrict faster growth in the PWR market?

Despite strong driver momentum, PWR system deployment is constrained by several factors. Large initial capital investment, complex engineering scope and extended construction timelines increase financial risk for utilities and investors. Public concern over safety, waste disposal and decommissioning cost further limits project risk-appetite. For equipment providers and EPC contractors, a meaningful USP is “pre-approved digital engineering packages and pre-qualified supplier frameworks that reduce project schedule over-run and cost escalation” thereby helping clients mitigate these adoption barriers in new or retrofit PWR programmes.

Which technological and market-design trends are defining the future of PWR systems?

The PWR market is moving toward standardised modular reactors, advanced fuel cycles, digital twin operations and remote monitoring to improve competitiveness and safety performance. Suppliers are developing integral and factory-built PWR modules to reduce on-site construction time and improve scalability. A key USP for emerging-technology providers is “factory-produced integral PWR modules with proven licensing basis and digital operations platform for lifecycle cost reduction”, enabling utilities to deploy nuclear capacity more flexibly and with lower through-life risk. As capital flows shift toward emerging economies and retrofit markets, these trends are expected to shape global PWR dynamics.
What is the Analysis of the Pressurized Water Reactor System Market by Key Country?

Pressurized Water Reactor System Market Cagr Analysis By Country

Country CAGR (%)
China 4.2%
India 3.9%
Germany 3.6%
Brazil 3.3%
USA 2.9%
UK 2.6%
Japan 2.3%

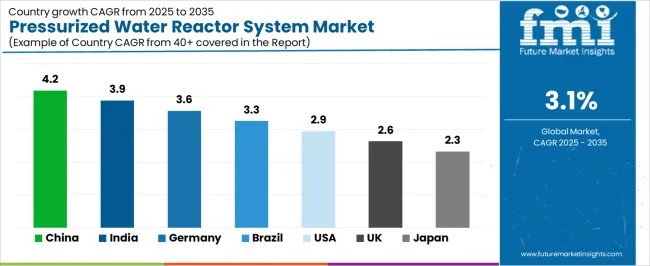
The pressurized water reactor system market is expanding steadily across major economies, with China leading at a 4.2% CAGR through 2035, driven by ongoing nuclear capacity additions, state-supported reactor development programs, and advanced safety technology integration. India follows at 3.9%, supported by nuclear expansion projects, public-private collaboration, and the adoption of next-generation reactor components. Germany grows at 3.6%, reflecting modernization in nuclear technology research despite energy diversification trends. Brazil records 3.3%, benefitting from energy infrastructure enhancement and increased focus on nuclear efficiency. The USA, at 2.9%, remains a stable market focused on reactor upgrades and maintenance, while the UK (2.6%) and Japan (2.3%) show gradual recovery in nuclear investment, emphasizing safety compliance and sustainable reactor operation frameworks.

How Is Nuclear Infrastructure Expansion Supporting Market Growth in China?

China is showing sustained development in the pressurized water reactor system market, projected to grow at a CAGR of 4.2% through 2035. Expanding national energy infrastructure and strong government focus on low-carbon electricity generation are driving new reactor construction. Domestic technology integration, supported by indigenous reactor designs such as Hualong One, enhances self-sufficiency in core components. Continuous safety upgrades, advanced fuel cycle management, and modernization of cooling systems reinforce the country’s capacity for efficient and reliable nuclear power generation.

  • Expansion of nuclear facilities sustains long-term equipment demand.
  • Indigenous design development improves domestic capability.
  • Focus on safety modernization enhances operational reliability.
  • National energy transition policies drive nuclear investment.

Why Is Energy Diversification Strengthening Market Potential in India?

India is witnessing steady progress in the pressurized water reactor system market, increasing at a CAGR of 3.9%, supported by the government’s push toward nuclear energy as a sustainable power source. Development of pressurized heavy water and light water reactor projects is reinforcing the country’s nuclear infrastructure. Collaborations with international suppliers enhance technology transfer and reactor safety performance. Rising electricity demand and decarbonization targets are encouraging further investment in advanced nuclear systems across key industrial states.
  • Nuclear energy diversification reduces dependence on fossil fuels.
  • Technology partnerships improve system efficiency and design.
  • National power demand supports steady infrastructure growth.
  • Investment in advanced reactors sustains long-term development.

How Does Technological Precision Sustain Market Competitiveness in Germany?

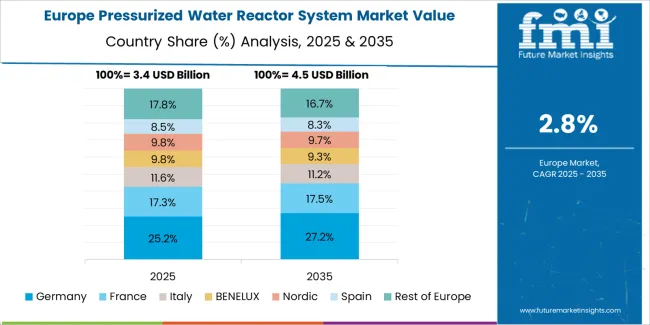
Pressurized Water Reactor System Market Europe Country Market Share Analysis, 2025 & 2035

Across Germany, the pressurized water reactor system market is advancing at a CAGR of 3.6%, driven by decommissioning projects, nuclear safety research, and engineering consultancy services. Although the country has phased out active nuclear generation, expertise in reactor component testing and safety simulation remains globally relevant. German firms continue to support international PWR system upgrades through engineering design and control technology. Ongoing participation in global nuclear safety programs maintains the country’s influence in reactor technology development.

  • Engineering expertise sustains international technical collaboration.
  • Focus on reactor safety systems ensures innovation continuity.
  • Decommissioning projects provide steady market engagement.
  • Simulation research supports global safety and modernization efforts.

Why Is Power Infrastructure Modernization Encouraging Market Development in Brazil?

Brazil is recording moderate progress in the pressurized water reactor system market, expected to grow at a CAGR of 3.3% through 2035. Expansion of the Angra nuclear complex and associated modernization programs continue to drive equipment and component procurement. Partnerships with global engineering firms support reactor operation efficiency and safety compliance. Domestic policy emphasis on low-carbon power generation sustains long-term investment in nuclear energy infrastructure, despite a gradual pace of new project development.
  • Modernization of nuclear plants sustains component demand.
  • Partnerships enhance technology and safety framework integration.
  • Low-carbon policies reinforce nuclear development initiatives.
  • Engineering upgrades improve operational performance and safety.

How Do Technology Upgrades Support Market Expansion in the United States?

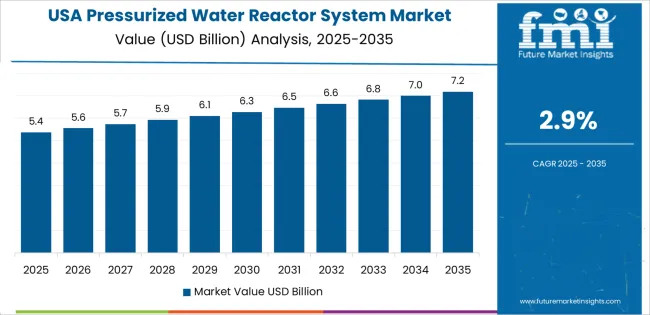
Pressurized Water Reactor System Market Country Value Analysis

In the United States, the pressurized water reactor system market is growing at a CAGR of 2.9%, supported by the modernization of existing reactors and investment in small modular reactor (SMR) programs. Utility companies are prioritizing digital control systems, advanced fuel assemblies, and long-life reactor components. Federal initiatives promoting nuclear safety and carbon-free energy reinforce steady investment in system upgrades. Ongoing research into accident-tolerant fuels and thermal management solutions supports future operational efficiency.

  • Modernization of existing reactors ensures stable demand.
  • Development of SMR technology drives long-term innovation.
  • Safety and efficiency upgrades enhance operational lifespan.
  • Government support reinforces carbon-free energy goals.

Why Is Research Integration Sustaining Market Activity in the United Kingdom?

Across the United Kingdom, the pressurized water reactor system market is advancing at a CAGR of 2.6%, supported by investments in reactor life-extension projects and nuclear research programs. Modernization of existing PWR facilities and planning for new reactors under government-backed energy security initiatives are sustaining market participation. Collaboration between engineering consultancies, universities, and reactor operators fosters technological refinement. Emphasis on low-emission energy diversification continues to strengthen long-term commitment to nuclear infrastructure.
  • Life-extension projects sustain demand for component systems.
  • Collaboration strengthens reactor design and operational innovation.
  • Research investment supports safety and energy efficiency.
  • Energy diversification promotes sustained nuclear development.

How Does Engineering Discipline Maintain Market Stability in Japan?

Pressurized Water Reactor System Market Japan Market Share Analysis By Classification

Japan is experiencing gradual recovery in the pressurized water reactor system market, projected to rise at a CAGR of 2.3% through 2035. Restart of select nuclear facilities following rigorous safety evaluations has renewed demand for inspection, control, and containment systems. Domestic manufacturers are emphasizing seismic-resistant designs, advanced cooling systems, and digital monitoring integration. Continued government oversight and public safety initiatives ensure that modernization efforts proceed steadily across operational and maintenance projects.
  • Reactor restarts renew demand for key system components.
  • Seismic-resistant technology enhances plant safety standards.
  • Modernization of cooling and monitoring systems drives upgrades.
  • Regulatory oversight maintains operational reliability and transparency.

How Competitive Is the Global Pressurized Water Reactor System Market and What Defines Its Strategic Landscape?

Pressurized Water Reactor System Market Analysis By Company

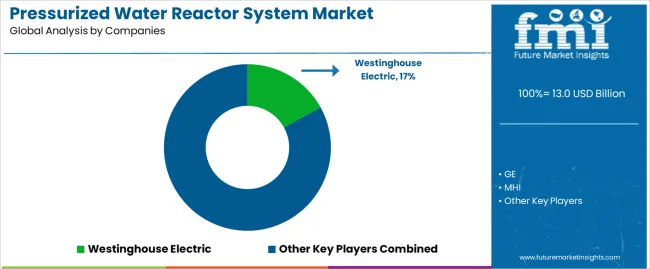
The global pressurized water reactor (PWR) system market is characterized by high entry barriers and a limited number of specialized nuclear technology providers with global operational reach. Westinghouse Electric leads the market with an estimated 17% share, supported by its AP1000 reactor design and long-term partnerships with utilities worldwide. GE, MHI, and Babcock & Wilcox (B&W) maintain strong positions through decades of engineering experience and system integration capabilities across both new build and refurbishment projects. Framatome and Siemens contribute advanced fuel cycle and instrumentation systems, emphasizing safety modernization and lifecycle efficiency. BBR and Atommash focus on heavy component manufacturing, including pressure vessels and reactor internals, supporting large-scale nuclear infrastructure programs across Europe and Asia.

Purolite and Rolls-Royce enhance competitiveness through specialized water chemistry and control system solutions. Toshiba and KHNP play key roles in regional deployment, integrating proven reactor technologies with localized engineering expertise. Rosatom and CNNC dominate government-backed nuclear expansion initiatives in Eurasia and China, respectively, delivering standardized reactor designs with domestic manufacturing capability. Shanghai Electric and Doosan contribute to reactor component production and export collaboration under joint venture frameworks. Holtec International strengthens global competitiveness through modular reactor innovation and decommissioning expertise. Competition within this market is defined by safety compliance, project financing capacity, and technology licensing agreements. Strategic differentiation increasingly depends on modularization, passive safety design, and digital reactor monitoring integration for next-generation PWR development and modernization.

Key Players in the Pressurized Water Reactor System Market

  • Westinghouse Electric
  • GE
  • MHI
  • B&W
  • Framatome
  • Siemens
  • BBR
  • Atommash
  • Purolite
  • Rolls-Royce
  • Toshiba
  • KHNP
  • Rosatom
  • CNNC
  • Shanghai Electric
  • Doosan
  • Holtec International

Pressurized Water Reactor System Market Report Scope

Items Values
Quantitative Units (2025) USD billion
Type (Classification) Small & Medium Type, Large Type
Application Nuclear Power Plant, Ship, Others
Regions Covered North America, Europe, East Asia, South Asia, Latin America, Middle East & Africa, Eastern Europe
Countries Covered China, India, USA, Germany, Brazil, UK, Japan, and 40+ countries
Key Companies Profiled Westinghouse Electric, GE, MHI, Babcock & Wilcox (B&W), Framatome, Siemens, BBR, Atommash, Purolite, Rolls-Royce, Toshiba, KHNP, Rosatom, CNNC, Shanghai Electric, Doosan, Holtec International
Additional Attributes Dollar sales by reactor type and application; regional adoption and modernization trends across major nuclear markets; competitive landscape covering OEMs, component suppliers, and lifecycle service providers.

Pressurized Water Reactor System Market by Segments

Classification:

  • Small & Medium Type
  • Large Type

Application:

  • Nuclear Power Plant
  • Ship
  • Others

Region:

  • East Asia
    • China
    • Japan
    • South Korea
    • Taiwan
    • Rest of East Asia
  • Europe
    • Germany
    • UK
    • France
    • Italy
    • Spain
    • Switzerland
    • Nordic
    • BENELUX
    • Rest of Europe
  • North America
    • USA
    • Canada
    • Mexico
  • South Asia
    • India
    • Pakistan
    • Bangladesh
    • Rest of South Asia
  • Latin America
    • Brazil
    • Argentina
    • Chile
    • Rest of Latin America
  • Middle East & Africa
    • Kingdom of Saudi Arabia
    • Other GCC Countries
    • Turkey
    • South Africa
    • Other African Union
    • Rest of Middle East & Africa
  • Eastern Europe
    • Russia
    • Poland
    • Czech Republic
    • Rest of Eastern Europe

Frequently Asked Questions

How big is the pressurized water reactor system market in 2025?

The global pressurized water reactor system market is estimated to be valued at USD 13.0 billion in 2025.

What will be the size of pressurized water reactor system market in 2035?

The market size for the pressurized water reactor system market is projected to reach USD 17.6 billion by 2035.

How much will be the pressurized water reactor system market growth between 2025 and 2035?

The pressurized water reactor system market is expected to grow at a 3.1% CAGR between 2025 and 2035.

What are the key product types in the pressurized water reactor system market?

The key product types in pressurized water reactor system market are small & medium type and large type.

Which application segment to contribute significant share in the pressurized water reactor system market in 2025?

In terms of application, nuclear power plant segment to command 88.0% share in the pressurized water reactor system market in 2025.

Table of Content

  1. Executive Summary
    • Global Market Outlook
    • Demand to side Trends
    • Supply to side Trends
    • Technology Roadmap Analysis
    • Analysis and Recommendations
  2. Market Overview
    • Market Coverage / Taxonomy
    • Market Definition / Scope / Limitations
  3. Market Background
    • Market Dynamics
      • Drivers
      • Restraints
      • Opportunity
      • Trends
    • Scenario Forecast
      • Demand in Optimistic Scenario
      • Demand in Likely Scenario
      • Demand in Conservative Scenario
    • Opportunity Map Analysis
    • Product Life Cycle Analysis
    • Supply Chain Analysis
    • Investment Feasibility Matrix
    • Value Chain Analysis
    • PESTLE and Porter’s Analysis
    • Regulatory Landscape
    • Regional Parent Market Outlook
    • Production and Consumption Statistics
    • Import and Export Statistics
  4. Global Market Analysis 2020 to 2024 and Forecast, 2025 to 2035
    • Historical Market Size Value (USD Million) Analysis, 2020 to 2024
    • Current and Future Market Size Value (USD Million) Projections, 2025 to 2035
      • Y to o to Y Growth Trend Analysis
      • Absolute $ Opportunity Analysis
  5. Global Market Pricing Analysis 2020 to 2024 and Forecast 2025 to 2035
  6. Global Market Analysis 2020 to 2024 and Forecast 2025 to 2035, By Classification
    • Introduction / Key Findings
    • Historical Market Size Value (USD Million) Analysis By Classification , 2020 to 2024
    • Current and Future Market Size Value (USD Million) Analysis and Forecast By Classification , 2025 to 2035
      • Small & Medium Type
      • Large Type
    • Y to o to Y Growth Trend Analysis By Classification , 2020 to 2024
    • Absolute $ Opportunity Analysis By Classification , 2025 to 2035
  7. Global Market Analysis 2020 to 2024 and Forecast 2025 to 2035, By Application
    • Introduction / Key Findings
    • Historical Market Size Value (USD Million) Analysis By Application, 2020 to 2024
    • Current and Future Market Size Value (USD Million) Analysis and Forecast By Application, 2025 to 2035
      • Nuclear Power Plant
      • Ship
      • Others
    • Y to o to Y Growth Trend Analysis By Application, 2020 to 2024
    • Absolute $ Opportunity Analysis By Application, 2025 to 2035
  8. Global Market Analysis 2020 to 2024 and Forecast 2025 to 2035, By Region
    • Introduction
    • Historical Market Size Value (USD Million) Analysis By Region, 2020 to 2024
    • Current Market Size Value (USD Million) Analysis and Forecast By Region, 2025 to 2035
      • North America
      • Latin America
      • Western Europe
      • Eastern Europe
      • East Asia
      • South Asia and Pacific
      • Middle East & Africa
    • Market Attractiveness Analysis By Region
  9. North America Market Analysis 2020 to 2024 and Forecast 2025 to 2035, By Country
    • Historical Market Size Value (USD Million) Trend Analysis By Market Taxonomy, 2020 to 2024
    • Market Size Value (USD Million) Forecast By Market Taxonomy, 2025 to 2035
      • By Country
        • USA
        • Canada
        • Mexico
      • By Classification
      • By Application
    • Market Attractiveness Analysis
      • By Country
      • By Classification
      • By Application
    • Key Takeaways
  10. Latin America Market Analysis 2020 to 2024 and Forecast 2025 to 2035, By Country
    • Historical Market Size Value (USD Million) Trend Analysis By Market Taxonomy, 2020 to 2024
    • Market Size Value (USD Million) Forecast By Market Taxonomy, 2025 to 2035
      • By Country
        • Brazil
        • Chile
        • Rest of Latin America
      • By Classification
      • By Application
    • Market Attractiveness Analysis
      • By Country
      • By Classification
      • By Application
    • Key Takeaways
  11. Western Europe Market Analysis 2020 to 2024 and Forecast 2025 to 2035, By Country
    • Historical Market Size Value (USD Million) Trend Analysis By Market Taxonomy, 2020 to 2024
    • Market Size Value (USD Million) Forecast By Market Taxonomy, 2025 to 2035
      • By Country
        • Germany
        • UK
        • Italy
        • Spain
        • France
        • Nordic
        • BENELUX
        • Rest of Western Europe
      • By Classification
      • By Application
    • Market Attractiveness Analysis
      • By Country
      • By Classification
      • By Application
    • Key Takeaways
  12. Eastern Europe Market Analysis 2020 to 2024 and Forecast 2025 to 2035, By Country
    • Historical Market Size Value (USD Million) Trend Analysis By Market Taxonomy, 2020 to 2024
    • Market Size Value (USD Million) Forecast By Market Taxonomy, 2025 to 2035
      • By Country
        • Russia
        • Poland
        • Hungary
        • Balkan & Baltic
        • Rest of Eastern Europe
      • By Classification
      • By Application
    • Market Attractiveness Analysis
      • By Country
      • By Classification
      • By Application
    • Key Takeaways
  13. East Asia Market Analysis 2020 to 2024 and Forecast 2025 to 2035, By Country
    • Historical Market Size Value (USD Million) Trend Analysis By Market Taxonomy, 2020 to 2024
    • Market Size Value (USD Million) Forecast By Market Taxonomy, 2025 to 2035
      • By Country
        • China
        • Japan
        • South Korea
      • By Classification
      • By Application
    • Market Attractiveness Analysis
      • By Country
      • By Classification
      • By Application
    • Key Takeaways
  14. South Asia and Pacific Market Analysis 2020 to 2024 and Forecast 2025 to 2035, By Country
    • Historical Market Size Value (USD Million) Trend Analysis By Market Taxonomy, 2020 to 2024
    • Market Size Value (USD Million) Forecast By Market Taxonomy, 2025 to 2035
      • By Country
        • India
        • ASEAN
        • Australia & New Zealand
        • Rest of South Asia and Pacific
      • By Classification
      • By Application
    • Market Attractiveness Analysis
      • By Country
      • By Classification
      • By Application
    • Key Takeaways
  15. Middle East & Africa Market Analysis 2020 to 2024 and Forecast 2025 to 2035, By Country
    • Historical Market Size Value (USD Million) Trend Analysis By Market Taxonomy, 2020 to 2024
    • Market Size Value (USD Million) Forecast By Market Taxonomy, 2025 to 2035
      • By Country
        • Kingdom of Saudi Arabia
        • Other GCC Countries
        • Turkiye
        • South Africa
        • Other African Union
        • Rest of Middle East & Africa
      • By Classification
      • By Application
    • Market Attractiveness Analysis
      • By Country
      • By Classification
      • By Application
    • Key Takeaways
  16. Key Countries Market Analysis
    • USA
      • Pricing Analysis
      • Market Share Analysis, 2024
        • By Classification
        • By Application
    • Canada
      • Pricing Analysis
      • Market Share Analysis, 2024
        • By Classification
        • By Application
    • Mexico
      • Pricing Analysis
      • Market Share Analysis, 2024
        • By Classification
        • By Application
    • Brazil
      • Pricing Analysis
      • Market Share Analysis, 2024
        • By Classification
        • By Application
    • Chile
      • Pricing Analysis
      • Market Share Analysis, 2024
        • By Classification
        • By Application
    • Germany
      • Pricing Analysis
      • Market Share Analysis, 2024
        • By Classification
        • By Application
    • UK
      • Pricing Analysis
      • Market Share Analysis, 2024
        • By Classification
        • By Application
    • Italy
      • Pricing Analysis
      • Market Share Analysis, 2024
        • By Classification
        • By Application
    • Spain
      • Pricing Analysis
      • Market Share Analysis, 2024
        • By Classification
        • By Application
    • France
      • Pricing Analysis
      • Market Share Analysis, 2024
        • By Classification
        • By Application
    • India
      • Pricing Analysis
      • Market Share Analysis, 2024
        • By Classification
        • By Application
    • ASEAN
      • Pricing Analysis
      • Market Share Analysis, 2024
        • By Classification
        • By Application
    • Australia & New Zealand
      • Pricing Analysis
      • Market Share Analysis, 2024
        • By Classification
        • By Application
    • China
      • Pricing Analysis
      • Market Share Analysis, 2024
        • By Classification
        • By Application
    • Japan
      • Pricing Analysis
      • Market Share Analysis, 2024
        • By Classification
        • By Application
    • South Korea
      • Pricing Analysis
      • Market Share Analysis, 2024
        • By Classification
        • By Application
    • Russia
      • Pricing Analysis
      • Market Share Analysis, 2024
        • By Classification
        • By Application
    • Poland
      • Pricing Analysis
      • Market Share Analysis, 2024
        • By Classification
        • By Application
    • Hungary
      • Pricing Analysis
      • Market Share Analysis, 2024
        • By Classification
        • By Application
    • Kingdom of Saudi Arabia
      • Pricing Analysis
      • Market Share Analysis, 2024
        • By Classification
        • By Application
    • Turkiye
      • Pricing Analysis
      • Market Share Analysis, 2024
        • By Classification
        • By Application
    • South Africa
      • Pricing Analysis
      • Market Share Analysis, 2024
        • By Classification
        • By Application
  17. Market Structure Analysis
    • Competition Dashboard
    • Competition Benchmarking
    • Market Share Analysis of Top Players
      • By Regional
      • By Classification
      • By Application
  18. Competition Analysis
    • Competition Deep Dive
      • Westinghouse Electric
        • Overview
        • Product Portfolio
        • Profitability by Market Segments (Product/Age /Sales Channel/Region)
        • Sales Footprint
        • Strategy Overview
          • Marketing Strategy
          • Product Strategy
          • Channel Strategy
      • GE
      • MHI
      • B&W
      • Framatome
      • Siemens
      • BBR
      • Atommash
      • Purolite
      • Rolls-Royce
      • Toshiba
      • KHNP
      • Rosatom
      • CNNC
      • Shanghai Electric
      • Doosan
      • Holtec International
  19. Assumptions & Acronyms Used
  20. Research Methodology

List of Tables

  • Table 1: Global Market Value (USD Million) Forecast by Region, 2020 to 2035
  • Table 2: Global Market Value (USD Million) Forecast by Classification , 2020 to 2035
  • Table 3: Global Market Value (USD Million) Forecast by Application, 2020 to 2035
  • Table 4: North America Market Value (USD Million) Forecast by Country, 2020 to 2035
  • Table 5: North America Market Value (USD Million) Forecast by Classification , 2020 to 2035
  • Table 6: North America Market Value (USD Million) Forecast by Application, 2020 to 2035
  • Table 7: Latin America Market Value (USD Million) Forecast by Country, 2020 to 2035
  • Table 8: Latin America Market Value (USD Million) Forecast by Classification , 2020 to 2035
  • Table 9: Latin America Market Value (USD Million) Forecast by Application, 2020 to 2035
  • Table 10: Western Europe Market Value (USD Million) Forecast by Country, 2020 to 2035
  • Table 11: Western Europe Market Value (USD Million) Forecast by Classification , 2020 to 2035
  • Table 12: Western Europe Market Value (USD Million) Forecast by Application, 2020 to 2035
  • Table 13: Eastern Europe Market Value (USD Million) Forecast by Country, 2020 to 2035
  • Table 14: Eastern Europe Market Value (USD Million) Forecast by Classification , 2020 to 2035
  • Table 15: Eastern Europe Market Value (USD Million) Forecast by Application, 2020 to 2035
  • Table 16: East Asia Market Value (USD Million) Forecast by Country, 2020 to 2035
  • Table 17: East Asia Market Value (USD Million) Forecast by Classification , 2020 to 2035
  • Table 18: East Asia Market Value (USD Million) Forecast by Application, 2020 to 2035
  • Table 19: South Asia and Pacific Market Value (USD Million) Forecast by Country, 2020 to 2035
  • Table 20: South Asia and Pacific Market Value (USD Million) Forecast by Classification , 2020 to 2035
  • Table 21: South Asia and Pacific Market Value (USD Million) Forecast by Application, 2020 to 2035
  • Table 22: Middle East & Africa Market Value (USD Million) Forecast by Country, 2020 to 2035
  • Table 23: Middle East & Africa Market Value (USD Million) Forecast by Classification , 2020 to 2035
  • Table 24: Middle East & Africa Market Value (USD Million) Forecast by Application, 2020 to 2035

List of Figures

  • Figure 1: Global Market Pricing Analysis
  • Figure 2: Global Market Value (USD Million) Forecast 2020-2035
  • Figure 3: Global Market Value Share and BPS Analysis by Classification , 2025 and 2035
  • Figure 4: Global Market Y-o-Y Growth Comparison by Classification , 2025-2035
  • Figure 5: Global Market Attractiveness Analysis by Classification
  • Figure 6: Global Market Value Share and BPS Analysis by Application, 2025 and 2035
  • Figure 7: Global Market Y-o-Y Growth Comparison by Application, 2025-2035
  • Figure 8: Global Market Attractiveness Analysis by Application
  • Figure 9: Global Market Value (USD Million) Share and BPS Analysis by Region, 2025 and 2035
  • Figure 10: Global Market Y-o-Y Growth Comparison by Region, 2025-2035
  • Figure 11: Global Market Attractiveness Analysis by Region
  • Figure 12: North America Market Incremental Dollar Opportunity, 2025-2035
  • Figure 13: Latin America Market Incremental Dollar Opportunity, 2025-2035
  • Figure 14: Western Europe Market Incremental Dollar Opportunity, 2025-2035
  • Figure 15: Eastern Europe Market Incremental Dollar Opportunity, 2025-2035
  • Figure 16: East Asia Market Incremental Dollar Opportunity, 2025-2035
  • Figure 17: South Asia and Pacific Market Incremental Dollar Opportunity, 2025-2035
  • Figure 18: Middle East & Africa Market Incremental Dollar Opportunity, 2025-2035
  • Figure 19: North America Market Value Share and BPS Analysis by Country, 2025 and 2035
  • Figure 20: North America Market Value Share and BPS Analysis by Classification , 2025 and 2035
  • Figure 21: North America Market Y-o-Y Growth Comparison by Classification , 2025-2035
  • Figure 22: North America Market Attractiveness Analysis by Classification
  • Figure 23: North America Market Value Share and BPS Analysis by Application, 2025 and 2035
  • Figure 24: North America Market Y-o-Y Growth Comparison by Application, 2025-2035
  • Figure 25: North America Market Attractiveness Analysis by Application
  • Figure 26: Latin America Market Value Share and BPS Analysis by Country, 2025 and 2035
  • Figure 27: Latin America Market Value Share and BPS Analysis by Classification , 2025 and 2035
  • Figure 28: Latin America Market Y-o-Y Growth Comparison by Classification , 2025-2035
  • Figure 29: Latin America Market Attractiveness Analysis by Classification
  • Figure 30: Latin America Market Value Share and BPS Analysis by Application, 2025 and 2035
  • Figure 31: Latin America Market Y-o-Y Growth Comparison by Application, 2025-2035
  • Figure 32: Latin America Market Attractiveness Analysis by Application
  • Figure 33: Western Europe Market Value Share and BPS Analysis by Country, 2025 and 2035
  • Figure 34: Western Europe Market Value Share and BPS Analysis by Classification , 2025 and 2035
  • Figure 35: Western Europe Market Y-o-Y Growth Comparison by Classification , 2025-2035
  • Figure 36: Western Europe Market Attractiveness Analysis by Classification
  • Figure 37: Western Europe Market Value Share and BPS Analysis by Application, 2025 and 2035
  • Figure 38: Western Europe Market Y-o-Y Growth Comparison by Application, 2025-2035
  • Figure 39: Western Europe Market Attractiveness Analysis by Application
  • Figure 40: Eastern Europe Market Value Share and BPS Analysis by Country, 2025 and 2035
  • Figure 41: Eastern Europe Market Value Share and BPS Analysis by Classification , 2025 and 2035
  • Figure 42: Eastern Europe Market Y-o-Y Growth Comparison by Classification , 2025-2035
  • Figure 43: Eastern Europe Market Attractiveness Analysis by Classification
  • Figure 44: Eastern Europe Market Value Share and BPS Analysis by Application, 2025 and 2035
  • Figure 45: Eastern Europe Market Y-o-Y Growth Comparison by Application, 2025-2035
  • Figure 46: Eastern Europe Market Attractiveness Analysis by Application
  • Figure 47: East Asia Market Value Share and BPS Analysis by Country, 2025 and 2035
  • Figure 48: East Asia Market Value Share and BPS Analysis by Classification , 2025 and 2035
  • Figure 49: East Asia Market Y-o-Y Growth Comparison by Classification , 2025-2035
  • Figure 50: East Asia Market Attractiveness Analysis by Classification
  • Figure 51: East Asia Market Value Share and BPS Analysis by Application, 2025 and 2035
  • Figure 52: East Asia Market Y-o-Y Growth Comparison by Application, 2025-2035
  • Figure 53: East Asia Market Attractiveness Analysis by Application
  • Figure 54: South Asia and Pacific Market Value Share and BPS Analysis by Country, 2025 and 2035
  • Figure 55: South Asia and Pacific Market Value Share and BPS Analysis by Classification , 2025 and 2035
  • Figure 56: South Asia and Pacific Market Y-o-Y Growth Comparison by Classification , 2025-2035
  • Figure 57: South Asia and Pacific Market Attractiveness Analysis by Classification
  • Figure 58: South Asia and Pacific Market Value Share and BPS Analysis by Application, 2025 and 2035
  • Figure 59: South Asia and Pacific Market Y-o-Y Growth Comparison by Application, 2025-2035
  • Figure 60: South Asia and Pacific Market Attractiveness Analysis by Application
  • Figure 61: Middle East & Africa Market Value Share and BPS Analysis by Country, 2025 and 2035
  • Figure 62: Middle East & Africa Market Value Share and BPS Analysis by Classification , 2025 and 2035
  • Figure 63: Middle East & Africa Market Y-o-Y Growth Comparison by Classification , 2025-2035
  • Figure 64: Middle East & Africa Market Attractiveness Analysis by Classification
  • Figure 65: Middle East & Africa Market Value Share and BPS Analysis by Application, 2025 and 2035
  • Figure 66: Middle East & Africa Market Y-o-Y Growth Comparison by Application, 2025-2035
  • Figure 67: Middle East & Africa Market Attractiveness Analysis by Application
  • Figure 68: Global Market - Tier Structure Analysis
  • Figure 69: Global Market - Company Share Analysis
Dashboard
Dashboard
Dashboard
Dashboard
Dashboard
Dashboard

Our Research Products

Full Research Suite

The "Full Research Suite" delivers actionable market intel, deep dives on markets or technologies, so clients act faster, cut risk, and unlock growth.

Competitor Leaderboard Report

The Leaderboard benchmarks and ranks top vendors, classifying them as Established Leaders, Leading Challengers, or Disruptors & Challengers.

Future Leaders Index

Locates where complements amplify value and substitutes erode it, forecasting net impact by horizon

Market Data & Forecasts

We deliver granular, decision-grade intel: market sizing, 5-year forecasts, pricing, adoption, usage, revenue, and operational KPIs—plus competitor tracking, regulation, and value chains—across 60 countries broadly.

Market Focus Report

Spot the shifts before they hit your P&L. We track inflection points, adoption curves, pricing moves, and ecosystem plays to show where demand is heading, why it is changing, and what to do next across high-growth markets and disruptive tech

Survey Report

Real-time reads of user behavior. We track shifting priorities, perceptions of today’s and next-gen services, and provider experience, then pace how fast tech moves from trial to adoption, blending buyer, consumer, and channel inputs with social signals (#WhySwitch, #UX).

Bespoke Reports

Partner with our analyst team to build a custom report designed around your business priorities. From analysing market trends to assessing competitors or crafting bespoke datasets, we tailor insights to your needs.

Supplier Intelligence

Discovery & Profiling

Capacity & Footprint

Performance & Risk

Compliance & Governance

Commercial Readiness

Who Supplies Whom

Scorecards & Shortlists

Playbooks & Docs

Category Intelligence

Definition & Scope

Demand & Use Cases

Cost Drivers

Market Structure

Supply Chain Map

Trade & Policy

Operating Norms

Deliverables

Buyer Intelligence

Account Basics

Spend & Scope

Procurement Model

Vendor Requirements

Terms & Policies

Entry Strategy

Pain Points & Triggers

Outputs

Pricing Analysis

Benchmarks

Trends

Should-Cost

Indexation

Landed Cost

Commercial Terms

Deliverables

Brand Analysis

Positioning & Value Prop

Share & Presence

Customer Evidence

Go-to-Market

Digital & Reputation

Compliance & Trust

KPIs & Gaps

Outputs

Full Research Suite comprises of:

Market outlook & trends analysis

Market outlook & trends analysis

Interviews & case studies

Interviews & case studies

Strategic recommendations

Strategic recommendations

Vendor profiles & capabilities analysis

Vendor profiles & capabilities analysis

5-year forecasts

5-year forecasts

8 regions and 60+ country-level data splits

8 regions and 60+ country-level data splits

Market segment data splits

Market segment data splits

12 months of continuous data updates

12 months of continuous data updates

DELIVERED AS:

PDF EXCEL ONLINE

Full Research Suite


$5000

$7500

$10000

Buy Report Now
Similar Industry Reports

Similar Industry Reports

Pressurized Metal Containers Market

Pressurized Metal Containers Market

Pressurized Wine Filter System Market

Pressurized Wine Filter System Market Size and Share Forecast Outlook 2025 to 2035

Water Vapor Permeability Analyzers Market

Water Vapor Permeability Analyzers Market Size and Share Forecast Outlook 2025 to 2035

Water and Waste Water Treatment Chemical Market

Water and Waste Water Treatment Chemical Market Size and Share Forecast Outlook 2025 to 2035

Water-cooled Walk-in Temperature & Humidity Chamber Market

Water-cooled Walk-in Temperature & Humidity Chamber Market Size and Share Forecast Outlook 2025 to 2035

Waterless Bathing Solution Market

Waterless Bathing Solution Market Size and Share Forecast Outlook 2025 to 2035

Waterborne UV Curable Resin Market

Waterborne UV Curable Resin Market Size and Share Forecast Outlook 2025 to 2035

Water Treatment Chemical Market

Water Treatment Chemical Market Size and Share Forecast Outlook 2025 to 2035

Water Adventure Tourism Market

Water Adventure Tourism Market Forecast and Outlook 2025 to 2035

Water Packaging Market

Water Packaging Market Forecast and Outlook 2025 to 2035

Water Soluble Bag Market

Water Soluble Bag Market Size and Share Forecast Outlook 2025 to 2035

Water Leak Sensors Market

Water Leak Sensors Market Size and Share Forecast Outlook 2025 to 2035

Water-soluble Packaging Market

Water-soluble Packaging Market Size and Share Forecast Outlook 2025 to 2035

Water and Wastewater Treatment Equipment Market

Water and Wastewater Treatment Equipment Market Size and Share Forecast Outlook 2025 to 2035

Water Treatment Market

Water Treatment Market Size and Share Forecast Outlook 2025 to 2035

Water Underfloor Heating Thermostat Market

Water Underfloor Heating Thermostat Market Size and Share Forecast Outlook 2025 to 2035

Water Activity Meter Market

Water Activity Meter Market Size and Share Forecast Outlook 2025 to 2035

Water Leakage Tester Market

Water Leakage Tester Market Size and Share Forecast Outlook 2025 to 2035

Waterstops Market
Waterstops Market

Waterstops Market Size and Share Forecast Outlook 2025 to 2035

Water-miscible Metalworking Oil Market

Water-miscible Metalworking Oil Market Size and Share Forecast Outlook 2025 to 2035

Future Market Insights

Pressurized Water Reactor System Market

Chat With MaRIA

Chat With

MaRIA

Hi There, I am MaRIA, Your Market Research Intelligence Assistant. How may I help you?