Pressurized Wine Filter System Market Outlook (2023 to 2033)

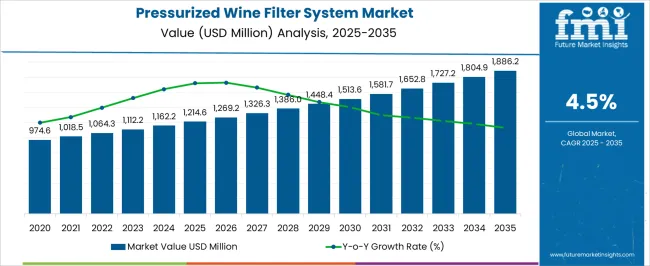
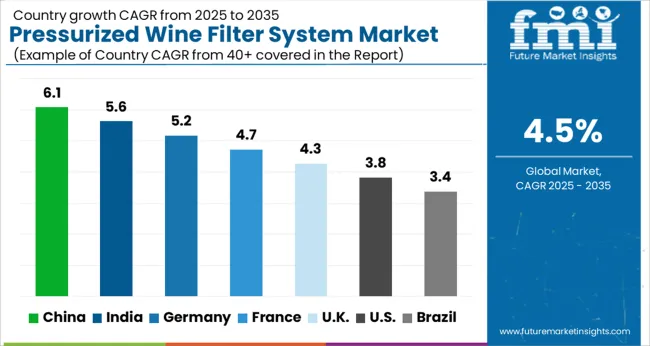
The global pressurized wine filter system market size reached US$ 1,064.3 Million in 2022 and it is expected to touch a valuation of US$ 1,112.2 Million in 2023. Furthermore, with rising demand for high-quality wine worldwide, the overall demand for pressurized wine filter systems is poised to rise at 4.5% CAGR between 2023 and 2033, totaling a market valuation of US$ 1,727.2 Million in 2033.

Pressurized wine filter systems are new wine filtration systems that are revolutionizing the way wine is filtered and processed. These systems use a unique pressurized filtration process that removes sediment and impurities from the wine without stripping away any flavor or aroma.

Pressurized wine filtering systems filter wine by forcing it through wine filter pads under pressure. The pressure can be applied through motorized pulps or manually through hand pumps. These systems are being increasingly employed across almost all wineries.

Although pressurized systems are more expensive than other filtration systems, they are capable of performing much finer filtrations if necessary and do so at a higher rate of speed.

Growing consumer demand for high-quality wine along with increasing focus of wine manufacturers to produce better tasting and healthier wine is expected to generate huge demand for pressurized wine systems during the forecast period.

Similarly, the growing popularity of premium wines and the increasing number of wineries globally are expected to boost sales of pressurized wine filter systems during the next ten years.

Leading manufacturers of pressurized wine filter systems are continuously innovating to develop highly efficient wine filtration systems with cost-effective and user-friendly features. This will further boost the global market over the next decade.

Attribute Key Insights
Pressurized Wine Filter System Market Estimated Value (2023) US$ 1,112.2 Million
Projected Market Value (2033) US$ 1,727.2 Million
Value-based CAGR (2023 to 2033) 4.5%
Global Market Share of USA, Germany, Japan, and Australia 63.6%

Don't pay for what you don't need

Customize your report by selecting specific countries or regions and save 30%!

2018 to 2022 Global Pressurized Wine Filter System Market Outlook Compared to 2023 to 2033 Forecast

The global market for pressurized wine filter systems is expected to grow at 4.5% CAGR between 2023 and 2033 in comparison to 4.7% CAGR registered during the historical period from 2018 to 2022.

The increasing popularity of wine and the growing number of people who are interested in trying new wines are some of the key factors expected to drive the global pressurized wine filter system market forward.

Similarly, the rising number of wineries across the world is generating high demand for pressurized wine filter systems and the trend is expected to continue during the projection period.

In addition, advances in technology have made these systems more affordable and easier to use, which has also contributed to their growing popularity. The development and popularity of these cost-effective wine filtration systems will eventually expand the global market over the next decade.

Pressurized Wine Filter System Market

Market-o-nomics - Highlighting the Key Trends

A number of influential factors have been identified that are expected to spur growth in the global pressurized wine filter system market during the projection period (2023 to 2033). Besides the proliferating aspects prevailing in the market, the analysts at FMI have also analyzed the restraining elements, lucrative opportunities, and upcoming threats that can somehow influence pressurized wine filter system sales.

The drivers, restraints, opportunities, and threats (DROTs) identified are as follows:

DRIVERS

  • Growing demand for filtered wine across the globe is driving the global pressurized wine filter systems industry forward.
  • The rising number of wineries worldwide is expected to generate high demand for pressurized wine filter systems during the forecast period.
  • Increasing awareness about the benefits of pressurized wine filter systems over other wine filtration systems will further boost sales.

RESTRAINTS

  • The use of alternative wine filtration technologies is limiting market expansion.
  • The high cost of advanced pressurized wine filtration systems is also negatively influencing the market.

OPPORTUNITIES

  • Rising focus of end users on increasing their production capacities while also ensuring the high quality of their products will create lucrative growth prospects for the pressurized wine filter system industry.
  • Advancements in pressurized wine filter systems coupled with the introduction of cost-effective products in the market will further elevate demand over the next ten years.

THREATS

  • The rising popularity of non-alcoholic beverages is expected to limit the growth of the global market.
  • Growing health concerns regarding excessive wine consumption along with the formation of various agencies that focus on alcohol addiction are likely to limit market expansion during the forecast period.
Nandini Roy Choudhury

Principal Consultant

Talk to Analyst

Find your sweet spots for generating winning opportunities in this market.

Country-wise Insights

How is the Pressurized Wine Filter System Industry Evolving in the USA?

Increasing Number of Wineries Boosting Sales in the USA

The USA currently accounts for 31.3% of the global market and it is likely to surpass a valuation of US$ 348.1 Million in 2023. The pressurized wine filter system market in the USA is constantly evolving. New products are constantly being introduced and older products are being updated.

One of the most recent developments in the market is the introduction of newer and more efficient models. These models are designed to filter out sediment and impurities more effectively than older models. This makes them ideal for use in wine-making, as they can help to improve the quality of the finished product.

Similarly, an increasing number of wineries across the country is consistently rising and the trend is expected to continue during the forecast period. For instance, according to the USA Bureau of Labor Statistics, the total number of wineries in the USA reached over 5024 in 2020. This will continue to generate high demand for pressurized wine filter systems.

How Will the Market for Pressurized Wine Filter Systems Grow in the UK?

Growing Demand for High-Quality Wine Driving the UK Market

The UK pressurized wine filter system market is poised to grow at 6.1% CAGR between 2023 and 2033. This can be attributed to the rising demand for high-quality wine, the surge in wine export, and the availability of relatively inexpensive and highly efficient pressurized wine filter systems.

Similarly, a growing number of start-ups offering wine in the UK will boost sales of pressurized wine filter systems during the forecast period. These businesses are often looking for producing high-quality wine while saving costs. As a result, they are employing advanced wine filtration systems.

Why is China Emerging as a Lucrative Market for Pressurized Wine Filter Systems?

Availability of Cost-Efficient Pressurized Wine Filter Systems Expanding the China Market

The overall market for pressurized wine filter systems in China is expected to grow at 5.9% CAGR during the next ten years (2023 to 2033). Growth in the market is driven by rising wine consumption, easy availability of cost-efficient wine filtration systems, and favorable government support.

In recent years, Chinese manufacturers have been able to provide pressurized wine filter systems at a lower price than their competitors, making them very competitive in the market. Moreover, China's vast population means that there is a large potential market for pressurized wine filter systems, which provides an incentive for manufacturers to invest in this technology.

How is Germany's Pressurized Wine Filter System Market Shaping?

Innovations in Wine Filtration Systems to Boost the German Market

As per FMI, Germany is set to hold around 24.5% share of the global pressurized wine filter system industry by 2023. Furthermore, with rising wine consumption and innovation in wine filtration systems, Germany’s market is expected to reach a valuation of US$ 272.5 Million by 2023.

Germany has long been known for its engineering and manufacturing prowess. As a result, the country has become a leader in the development of new wine technologies.

German manufacturers have developed innovative pressurized wine filter systems that can remove impurities from wine without affecting its taste or aroma. These systems use a series of filters to remove sediment, colorants, and other undesirables from wine, leaving behind only the purest essence of the drink. This results in a cleaner, more flavourful wine that can be enjoyed by all.

Category-wise Insights

Which are the Leading Segments in the Global Pressurized Wine Filter System Market?

Red Wine to Generate the Highest Revenues Through 2033

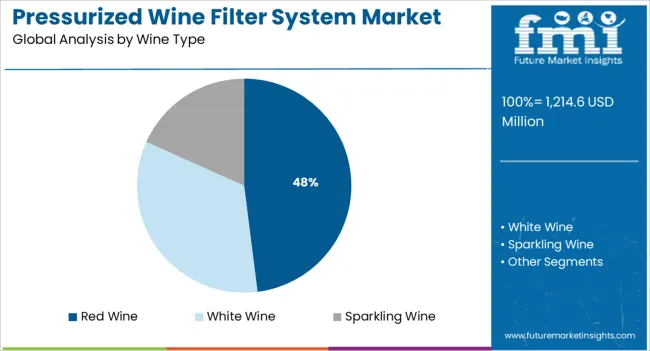
Based on wine type, the red wine segment will continue to dominate the global market during the forecast period owing to the rising consumption of red wine across the world due to its various health benefits.

Red wine has several health benefits, including lowering blood sugar levels and lessening the effects of colds and congestion. It is the most popular type of wine among corporations and millennials.

Winemakers generally use pressurized wine filter systems to make the red clear without adding stabilizers. Thus, increasing production and consumption of this wine type (red wine) will eventually generate high demand for pressurized wine filter systems over the next ten years.

End Users Prefer Counter-top Structured Pressurized Wine Filter Systems

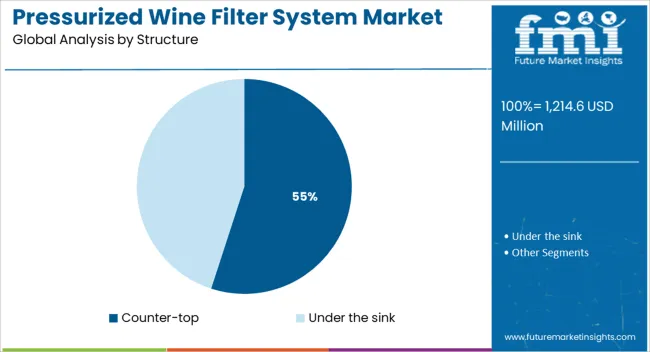
As per FMI, sales of counter-top pressurized wine filter systems are likely to outpace those of under-the-sink type, owing to the rising end-user preference for these systems due to their compact and space-saving features.

Counter-top models of pressurized wine filter systems are a great choice for those who want a compact and easy-to-use unit. These filters are designed to be used on the countertop, so they take up less space than other types of wine filter systems. They are also easy to set up and use.

Another advantage of countertop models is that they are usually less expensive than other types of filters. This makes them a great option for those who are on a budget.

The ability of Cartridge Filters to Increase Filtration Efficiency Encouraging Their Adoption

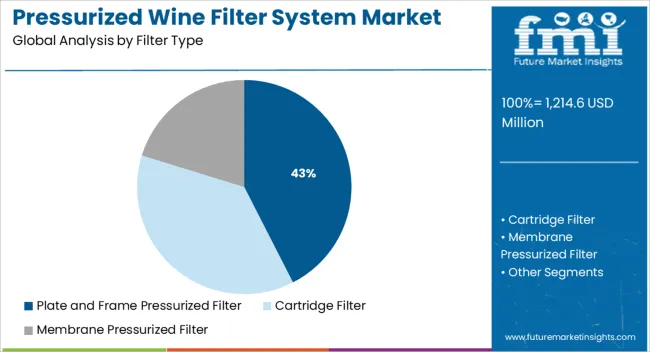
Based on filter type, demand for cartilage filters will grow at a significant pace during the next ten years owing to their ability to increase efficiency in pressurized wine filter systems.

Cartridge filters are more efficient than other types of filters because they have a smaller surface area. This means that they can remove more impurities from the wine while allowing less oxygen to enter the bottle. As a result, cartridge filters help preserve the flavor and quality of wine for longer periods of time.
Get the data you need at a Fraction of the cost

Personalize your report by choosing insights you need
and save 40%!

Competitive Landscape

As the wine industry continues to grow, so does the competitive landscape of pressurized wine filter systems. As a result, leading players are focused on continuously upgrading their product portfolios. They are launching upgraded wine filtration systems with unique features and benefits. Further, they are adopting strategies such as partnerships, mergers, facility expansions, and collaborations to gain a competitive edge in the market. For instance,

In January 2018, Parker Hannifin, created a new division, Parker Bioscience Filtration Division. The new division designs, supplies, and delivers whole systems for pharmaceutical and biopharmaceutical manufacturing, and provides filtration solutions for the global food and beverage industry.

Recently, Eaton expanded its range of BECO pre- and membrane filter cartridges that offer the perfect combination of pre-filtration and final filtration for full-bodied, bright, and stable wines and sparkling wines.

Pressurized Wine Filter System Industry Report Scope

Attribute Details
Estimated Market Size (2023) US$ 1,112.2 Million
Projected Market Size (2033) US$ 1,727.2 Million
Anticipated Growth Rate (2023 to 2033) 4.5% CAGR
Forecast Period 2023 to 2033
Historical Data Available for 2018 to 2022
Market Analysis US$ Million for Value and Units for Volume
Key Regions Covered
  • North America
  • Latin America
  • Europe
  • Asia Pacific
  • Oceania
  • Middle East and Africa (MEA)
Key Countries Covered
  • USA
  • Canada
  • Mexico
  • Germany
  • UK
  • France
  • Italy
  • Spain
  • China
  • Japan
  • India
  • South Korea
  • Australia
  • Brazil
  • Argentina
  • South Africa
  • UAE
Key Segments Covered
  • Filter Type
  • Wine Type
  • Structure
  • Region
Key Companies Profiled
  • Vintner's Cellar
  • The Winery
  • Cellar Master
  • PALL Corporation
  • 3M Company
  • Parker Hannifin Corporation
  • LD Carlson Co.
  • Wine Guardian
  • Nantong Hailan Filtration Tech Co., Ltd
  • Sartorius (India) Private Limited
  • VLS Technologies
Report Coverage Company Share Analysis, Drivers, Restraints, Opportunities and Threats Analysis, Market Dynamics and Challenges, Strategic Growth Initiatives, Market Forecast, Competitive Landscape,

Pressurized Wine Filter System Industry by Category

By Filter Type:

  • Plate and Frame Pressurized Filter
  • Cartridge Filter
  • Membrane Pressurized Filters

By Wine Type:

  • Red Wine
  • White Wine
  • Sparkling Wine

By Structure:

  • Counter-top
  • Under the sink

By Region:

  • North America
  • Latin America
  • Europe
  • Asia Pacific
  • Oceania
  • Middle East and Africa (MEA)

Frequently Asked Questions

How big is the global pressurized wine filter system market?

The global market for pressurized wine filter systems is estimated to reach nearly US$ 1,112.2 Million in 2023.

At what rate will the demand for pressurized wine filter systems grow between 2023 and 2033?

As per FMI, the overall demand for pressurized wine filter systems is expected to rise at a CAGR of 4.5% between 2023 and 2033.

What is the projected valuation for the pressurized wine filter system market by 2033?

The global pressurized wine filter system industry is forecast to surpass a valuation of US$ 1,727.2 Million by 2033.

Which are the major countries driving the demand for pressurized wine filter systems?

The USA, UK, China, and Germany are the major countries driving the demand for pressurized wine filter systems.

How big is the market for pressurized wine filter systems in Japan?

By 2023, Japan’s pressurized wine filter system industry is expected to total a valuation of US$ 52.3 Million.

What is the growth projection for the Australia Market?

By the year 2023, Australia will account for 3.1% of the global market of pressurized wine filter systems with a market value of US$ 53.5 Million.

At what rate will the demand for pressurized wine filter systems grow in China?

Demand for pressurized wine filter systems in China is likely to grow at 5.9% CAGR between 2023 and 2033.

How will growth unfold in India’s pressurized wine filter system market?

The overall market for pressurized wine filter systems in India is expected to grow at 6.5% CAGR between 2023 and 2033.

What is the Sales forecast for the UK’s market?

Sales of pressurized wine filter systems in the UK are projected to grow at 6.1% CAGR during the next ten years.

Which companies dominate the market?

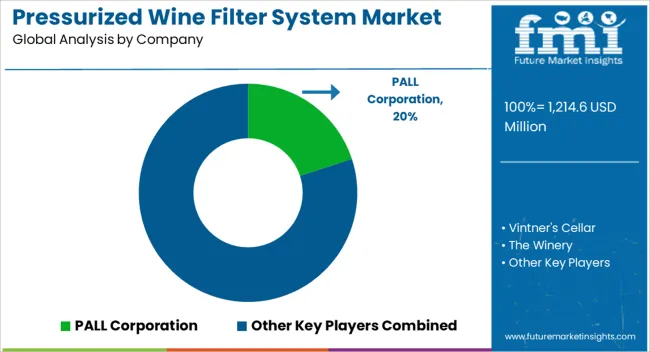
Nantong Hailan Filtration Tech Co. Ltd, LD Carlson Co., Vintner's Cellar, Wine Guardian, and VLS Technologies are the companies dominating the market for pressurized wine filter systems.

Table of Content
1. Executive Summary | Pressurized Wine Filter System Market

    1.1. Global Market Outlook

    1.2. Demand-side Trends

    1.3. Supply-side Trends

    1.4. Technology Roadmap Analysis

    1.5. Analysis and Recommendations

2. Market Overview

    2.1. Market Coverage / Taxonomy

    2.2. Market Definition / Scope / Limitations

3. Market Background

    3.1. Market Dynamics

        3.1.1. Drivers

        3.1.2. Restraints

        3.1.3. Opportunity

        3.1.4. Trends

    3.2. Scenario Forecast

        3.2.1. Demand in Optimistic Scenario

        3.2.2. Demand in Likely Scenario

        3.2.3. Demand in Conservative Scenario

    3.3. Product launches & Recent Developments

    3.4. Product Life Cycle Analysis

    3.5. Value Chain Analysis

        3.5.1. Supply Side Participants and their Roles

            3.5.1.1. Producers

            3.5.1.2. Mid-Level Participants (Traders/ Agents/ Brokers)

            3.5.1.3. Wholesalers and Distributors

        3.5.2. % of Operating Margin Analysis

        3.5.3. List of Raw Material Suppliers

        3.5.4. List of Existing and Potential Buyers

    3.6. Global Market - Pricing Analysis

        3.6.1. Price Point Assessment by Region

        3.6.2. Price Point Assessment by Product Type

        3.6.3. Price Forecast till 2033

        3.6.4. Factors affecting pricing

    3.7. Forecast Factors - Relevance & Impact

    3.8. PESTLE and Porter’s Analysis

    3.9. Regulatory Landscape

        3.9.1. Packaging & Labelling Regulations

        3.9.2. Certifications and Certifying Agency Overview

        3.9.3. Import/Export Policies

    3.10. Regional Parent Market Outlook

    3.11. Production and Consumption Statistics

    3.12. Import and Export Statistics

    3.13. Consumers Survey Analysis

    3.14. Macro-Economic Factors

    3.15. Product Claims & Nutritional Information scanned by Buyers

4. Global Market Analysis 2018 to 2022 and Forecast, 2023 to 2033

    4.1. Historical Market Size Value (US$ Million) & Volume (MT) Analysis, 2018 to 2022

    4.2. Current and Future Market Size Value (US$ Million) & Volume (MT) Projections, 2023 to 2033

        4.2.1. Y-o-Y Growth Trend Analysis

        4.2.2. Absolute $ Opportunity Analysis

5. Global Market Analysis 2018 to 2022 and Forecast 2023 to 2033, By Filter Type

    5.1. Introduction / Key Findings

    5.2. Historical Market Size Value (US$ Million) & Volume (MT) Analysis By Filter Type, 2018 to 2022

    5.3. Current and Future Market Size Value (US$ Million) & Volume (MT) Analysis and Forecast By Filter Type, 2023 to 2033

        5.3.1. Plate and Frame Pressurized Filter

        5.3.2. Cartridge Filter

        5.3.3. Membrane Pressurized Filter

    5.4. Y-o-Y Growth Trend Analysis By Filter Type, 2018 to 2022

    5.5. Absolute $ Opportunity Analysis By Filter Type, 2023 to 2033

6. Global Market Analysis 2018 to 2022 and Forecast 2023 to 2033, By Wine Type

    6.1. Introduction / Key Findings

    6.2. Historical Market Size Value (US$ Million) & Volume (MT) Analysis By Wine Type, 2018 to 2022

    6.3. Current and Future Market Size Value (US$ Million) & Volume (MT) Analysis and Forecast By Wine Type, 2023 to 2033

        6.3.1. Red Wine

        6.3.2. White Wine

        6.3.3. Sparkling Wine

    6.4. Y-o-Y Growth Trend Analysis By Wine Type, 2018 to 2022

    6.5. Absolute $ Opportunity Analysis By Wine Type, 2023 to 2033

7. Global Market Analysis 2018 to 2022 and Forecast 2023 to 2033, By Structure

    7.1. Introduction / Key Findings

    7.2. Historical Market Size Value (US$ Million) & Volume (MT) Analysis By Structure, 2018 to 2022

    7.3. Current and Future Market Size Value (US$ Million) & Volume (MT) Analysis and Forecast By Structure, 2023 to 2033

        7.3.1. Counter-top

        7.3.2. Under the sink

    7.4. Y-o-Y Growth Trend Analysis By Structure, 2018 to 2022

    7.5. Absolute $ Opportunity Analysis By Structure, 2023 to 2033

8. Global Market Analysis 2018 to 2022 and Forecast 2023 to 2033, By Region

    8.1. Introduction

    8.2. Historical Market Size Value (US$ Million) & Volume (MT) Analysis By Region, 2018 to 2022

    8.3. Current Market Size Value (US$ Million) & Volume (MT) Analysis and Forecast By Region, 2023 to 2033

        8.3.1. North America

        8.3.2. Latin America

        8.3.3. Europe

        8.3.4. East Asia

        8.3.5. South Asia

        8.3.6. Oceania

        8.3.7. Middle East and Africa (MEA)

    8.4. Market Attractiveness Analysis By Region

9. North America Market Analysis 2018 to 2022 and Forecast 2023 to 2033, By Country

    9.1. Historical Market Size Value (US$ Million) & Volume (MT) Trend Analysis By Market Taxonomy, 2018 to 2022

    9.2. Market Size Value (US$ Million) & Volume (MT) Forecast By Market Taxonomy, 2023 to 2033

        9.2.1. By Country

            9.2.1.1. United States of America

            9.2.1.2. Canada

        9.2.2. By Filter Type

        9.2.3. By Wine Type

        9.2.4. By Structure

    9.3. Market Attractiveness Analysis

        9.3.1. By Country

        9.3.2. By Filter Type

        9.3.3. By Wine Type

        9.3.4. By Structure

    9.4. Key Takeaways

10. Latin America Market Analysis 2018 to 2022 and Forecast 2023 to 2033, By Country

    10.1. Historical Market Size Value (US$ Million) & Volume (MT) Trend Analysis By Market Taxonomy, 2018 to 2022

    10.2. Market Size Value (US$ Million) & Volume (MT) Forecast By Market Taxonomy, 2023 to 2033

        10.2.1. By Country

            10.2.1.1. Brazil

            10.2.1.2. Mexico

            10.2.1.3. Argentina

            10.2.1.4. Chile

            10.2.1.5. Peru

            10.2.1.6. Rest of Latin America

        10.2.2. By Filter Type

        10.2.3. By Wine Type

        10.2.4. By Structure

    10.3. Market Attractiveness Analysis

        10.3.1. By Country

        10.3.2. By Filter Type

        10.3.3. By Wine Type

        10.3.4. By Structure

    10.4. Key Takeaways

11. Europe Market Analysis 2018 to 2022 and Forecast 2023 to 2033, By Country

    11.1. Historical Market Size Value (US$ Million) & Volume (MT) Trend Analysis By Market Taxonomy, 2018 to 2022

    11.2. Market Size Value (US$ Million) & Volume (MT) Forecast By Market Taxonomy, 2023 to 2033

        11.2.1. By Country

            11.2.1.1. Germany

            11.2.1.2. Italy

            11.2.1.3. France

            11.2.1.4. United Kingdom

            11.2.1.5. Spain

            11.2.1.6. Russia

            11.2.1.7. BENELUX

            11.2.1.8. Poland

            11.2.1.9. Nordic Countries

            11.2.1.10. Rest of Europe

        11.2.2. By Filter Type

        11.2.3. By Wine Type

        11.2.4. By Structure

    11.3. Market Attractiveness Analysis

        11.3.1. By Country

        11.3.2. By Filter Type

        11.3.3. By Wine Type

        11.3.4. By Structure

    11.4. Key Takeaways

12. East Asia Market Analysis 2018 to 2022 and Forecast 2023 to 2033, By Country

    12.1. Historical Market Size Value (US$ Million) & Volume (MT) Trend Analysis By Market Taxonomy, 2018 to 2022

    12.2. Market Size Value (US$ Million) & Volume (MT) Forecast By Market Taxonomy, 2023 to 2033

        12.2.1. By Country

            12.2.1.1. China

            12.2.1.2. Japan

            12.2.1.3. South Korea

        12.2.2. By Filter Type

        12.2.3. By Wine Type

        12.2.4. By Structure

    12.3. Market Attractiveness Analysis

        12.3.1. By Country

        12.3.2. By Filter Type

        12.3.3. By Wine Type

        12.3.4. By Structure

    12.4. Key Takeaways

13. South Asia Market Analysis 2018 to 2022 and Forecast 2023 to 2033, By Country

    13.1. Historical Market Size Value (US$ Million) & Volume (MT) Trend Analysis By Market Taxonomy, 2018 to 2022

    13.2. Market Size Value (US$ Million) & Volume (MT) Forecast By Market Taxonomy, 2023 to 2033

        13.2.1. By Country

            13.2.1.1. India

            13.2.1.2. Thailand

            13.2.1.3. Malaysia

            13.2.1.4. Indonesia

            13.2.1.5. Singapore

            13.2.1.6. Rest of South Asia

        13.2.2. By Filter Type

        13.2.3. By Wine Type

        13.2.4. By Structure

    13.3. Market Attractiveness Analysis

        13.3.1. By Country

        13.3.2. By Filter Type

        13.3.3. By Wine Type

        13.3.4. By Structure

    13.4. Key Takeaways

14. Oceania Market Analysis 2018 to 2022 and Forecast 2023 to 2033, By Country

    14.1. Historical Market Size Value (US$ Million) & Volume (MT) Trend Analysis By Market Taxonomy, 2018 to 2022

    14.2. Market Size Value (US$ Million) & Volume (MT) Forecast By Market Taxonomy, 2023 to 2033

        14.2.1. By Country

            14.2.1.1. Australia

            14.2.1.2. New Zealand

        14.2.2. By Filter Type

        14.2.3. By Wine Type

        14.2.4. By Structure

    14.3. Market Attractiveness Analysis

        14.3.1. By Country

        14.3.2. By Filter Type

        14.3.3. By Wine Type

        14.3.4. By Structure

    14.4. Key Takeaways

15. MEA Market Analysis 2018 to 2022 and Forecast 2023 to 2033, By Country

    15.1. Historical Market Size Value (US$ Million) & Volume (MT) Trend Analysis By Market Taxonomy, 2018 to 2022

    15.2. Market Size Value (US$ Million) & Volume (MT) Forecast By Market Taxonomy, 2023 to 2033

        15.2.1. By Country

            15.2.1.1. GCC Countries

            15.2.1.2. South Africa

            15.2.1.3. Central Africa

            15.2.1.4. North Africa

        15.2.2. By Filter Type

        15.2.3. By Wine Type

        15.2.4. By Structure

    15.3. Market Attractiveness Analysis

        15.3.1. By Country

        15.3.2. By Filter Type

        15.3.3. By Wine Type

        15.3.4. By Structure

    15.4. Key Takeaways

16. Key Countries Market Analysis

    16.1. United States of America

        16.1.1. Pricing Analysis

        16.1.2. Market Share Analysis, 2023

            16.1.2.1. By Filter Type

            16.1.2.2. By Wine Type

            16.1.2.3. By Structure

    16.2. Canada

        16.2.1. Pricing Analysis

        16.2.2. Market Share Analysis, 2023

            16.2.2.1. By Filter Type

            16.2.2.2. By Wine Type

            16.2.2.3. By Structure

    16.3. Brazil

        16.3.1. Pricing Analysis

        16.3.2. Market Share Analysis, 2023

            16.3.2.1. By Filter Type

            16.3.2.2. By Wine Type

            16.3.2.3. By Structure

    16.4. Mexico

        16.4.1. Pricing Analysis

        16.4.2. Market Share Analysis, 2023

            16.4.2.1. By Filter Type

            16.4.2.2. By Wine Type

            16.4.2.3. By Structure

    16.5. Argentina

        16.5.1. Pricing Analysis

        16.5.2. Market Share Analysis, 2023

            16.5.2.1. By Filter Type

            16.5.2.2. By Wine Type

            16.5.2.3. By Structure

    16.6. Chile

        16.6.1. Pricing Analysis

        16.6.2. Market Share Analysis, 2023

            16.6.2.1. By Filter Type

            16.6.2.2. By Wine Type

            16.6.2.3. By Structure

    16.7. Peru

        16.7.1. Pricing Analysis

        16.7.2. Market Share Analysis, 2023

            16.7.2.1. By Filter Type

            16.7.2.2. By Wine Type

            16.7.2.3. By Structure

    16.8. Germany

        16.8.1. Pricing Analysis

        16.8.2. Market Share Analysis, 2023

            16.8.2.1. By Filter Type

            16.8.2.2. By Wine Type

            16.8.2.3. By Structure

    16.9. Italy

        16.9.1. Pricing Analysis

        16.9.2. Market Share Analysis, 2023

            16.9.2.1. By Filter Type

            16.9.2.2. By Wine Type

            16.9.2.3. By Structure

    16.10. France

        16.10.1. Pricing Analysis

        16.10.2. Market Share Analysis, 2023

            16.10.2.1. By Filter Type

            16.10.2.2. By Wine Type

            16.10.2.3. By Structure

    16.11. Spain

        16.11.1. Pricing Analysis

        16.11.2. Market Share Analysis, 2023

            16.11.2.1. By Filter Type

            16.11.2.2. By Wine Type

            16.11.2.3. By Structure

    16.12. United Kingdom

        16.12.1. Pricing Analysis

        16.12.2. Market Share Analysis, 2023

            16.12.2.1. By Filter Type

            16.12.2.2. By Wine Type

            16.12.2.3. By Structure

    16.13. Russia

        16.13.1. Pricing Analysis

        16.13.2. Market Share Analysis, 2023

            16.13.2.1. By Filter Type

            16.13.2.2. By Wine Type

            16.13.2.3. By Structure

    16.14. Poland

        16.14.1. Pricing Analysis

        16.14.2. Market Share Analysis, 2023

            16.14.2.1. By Filter Type

            16.14.2.2. By Wine Type

            16.14.2.3. By Structure

    16.15. BENELUX

        16.15.1. Pricing Analysis

        16.15.2. Market Share Analysis, 2023

            16.15.2.1. By Filter Type

            16.15.2.2. By Wine Type

            16.15.2.3. By Structure

    16.16. Nordic Countries

        16.16.1. Pricing Analysis

        16.16.2. Market Share Analysis, 2023

            16.16.2.1. By Filter Type

            16.16.2.2. By Wine Type

            16.16.2.3. By Structure

    16.17. China

        16.17.1. Pricing Analysis

        16.17.2. Market Share Analysis, 2023

            16.17.2.1. By Filter Type

            16.17.2.2. By Wine Type

            16.17.2.3. By Structure

    16.18. Japan

        16.18.1. Pricing Analysis

        16.18.2. Market Share Analysis, 2023

            16.18.2.1. By Filter Type

            16.18.2.2. By Wine Type

            16.18.2.3. By Structure

    16.19. South Korea

        16.19.1. Pricing Analysis

        16.19.2. Market Share Analysis, 2023

            16.19.2.1. By Filter Type

            16.19.2.2. By Wine Type

            16.19.2.3. By Structure

    16.20. India

        16.20.1. Pricing Analysis

        16.20.2. Market Share Analysis, 2023

            16.20.2.1. By Filter Type

            16.20.2.2. By Wine Type

            16.20.2.3. By Structure

    16.21. Thailand

        16.21.1. Pricing Analysis

        16.21.2. Market Share Analysis, 2023

            16.21.2.1. By Filter Type

            16.21.2.2. By Wine Type

            16.21.2.3. By Structure

    16.22. Indonesia

        16.22.1. Pricing Analysis

        16.22.2. Market Share Analysis, 2023

            16.22.2.1. By Filter Type

            16.22.2.2. By Wine Type

            16.22.2.3. By Structure

    16.23. Malaysia

        16.23.1. Pricing Analysis

        16.23.2. Market Share Analysis, 2023

            16.23.2.1. By Filter Type

            16.23.2.2. By Wine Type

            16.23.2.3. By Structure

    16.24. Singapore

        16.24.1. Pricing Analysis

        16.24.2. Market Share Analysis, 2023

            16.24.2.1. By Filter Type

            16.24.2.2. By Wine Type

            16.24.2.3. By Structure

    16.25. Australia

        16.25.1. Pricing Analysis

        16.25.2. Market Share Analysis, 2023

            16.25.2.1. By Filter Type

            16.25.2.2. By Wine Type

            16.25.2.3. By Structure

    16.26. New Zealand

        16.26.1. Pricing Analysis

        16.26.2. Market Share Analysis, 2023

            16.26.2.1. By Filter Type

            16.26.2.2. By Wine Type

            16.26.2.3. By Structure

    16.27. GCC Countries

        16.27.1. Pricing Analysis

        16.27.2. Market Share Analysis, 2023

            16.27.2.1. By Filter Type

            16.27.2.2. By Wine Type

            16.27.2.3. By Structure

    16.28. South Africa

        16.28.1. Pricing Analysis

        16.28.2. Market Share Analysis, 2023

            16.28.2.1. By Filter Type

            16.28.2.2. By Wine Type

            16.28.2.3. By Structure

    16.29. North Africa

        16.29.1. Pricing Analysis

        16.29.2. Market Share Analysis, 2023

            16.29.2.1. By Filter Type

            16.29.2.2. By Wine Type

            16.29.2.3. By Structure

    16.30. Central Africa

        16.30.1. Pricing Analysis

        16.30.2. Market Share Analysis, 2023

            16.30.2.1. By Filter Type

            16.30.2.2. By Wine Type

            16.30.2.3. By Structure

17. Market Structure Analysis

    17.1. Competition Dashboard

    17.2. Competition Benchmarking

    17.3. Market Share Analysis of Top Players

        17.3.1. By Regional

        17.3.2. By Filter Type

        17.3.3. By Wine Type

        17.3.4. By Structure

18. Competition Analysis

    18.1. Competition Deep Dive

        18.1.1. Vintner's Cellar

            18.1.1.1. Overview

            18.1.1.2. Product Portfolio

            18.1.1.3. Profitability by Market Segments (Filter Type/Wine Type/Structure/Region)

            18.1.1.4. Sales Footprint

            18.1.1.5. Strategy Overview

                18.1.1.5.1. Marketing Strategy

                18.1.1.5.2. Product Strategy

                18.1.1.5.3. Channel Strategy

        18.1.2. The Winery

            18.1.2.1. Overview

            18.1.2.2. Product Portfolio

            18.1.2.3. Profitability by Market Segments (Filter Type/Wine Type/Structure/Region)

            18.1.2.4. Sales Footprint

            18.1.2.5. Strategy Overview

                18.1.2.5.1. Marketing Strategy

                18.1.2.5.2. Product Strategy

                18.1.2.5.3. Channel Strategy

        18.1.3. Cellar Master

            18.1.3.1. Overview

            18.1.3.2. Product Portfolio

            18.1.3.3. Profitability by Market Segments (Filter Type/Wine Type/Structure/Region)

            18.1.3.4. Sales Footprint

            18.1.3.5. Strategy Overview

                18.1.3.5.1. Marketing Strategy

                18.1.3.5.2. Product Strategy

                18.1.3.5.3. Channel Strategy

        18.1.4. PALL Corporation

            18.1.4.1. Overview

            18.1.4.2. Product Portfolio

            18.1.4.3. Profitability by Market Segments (Filter Type/Wine Type/Structure/Region)

            18.1.4.4. Sales Footprint

            18.1.4.5. Strategy Overview

                18.1.4.5.1. Marketing Strategy

                18.1.4.5.2. Product Strategy

                18.1.4.5.3. Channel Strategy

        18.1.5. 3M Company

            18.1.5.1. Overview

            18.1.5.2. Product Portfolio

            18.1.5.3. Profitability by Market Segments (Filter Type/Wine Type/Structure/Region)

            18.1.5.4. Sales Footprint

            18.1.5.5. Strategy Overview

                18.1.5.5.1. Marketing Strategy

                18.1.5.5.2. Product Strategy

                18.1.5.5.3. Channel Strategy

        18.1.6. Parker Hannifin Corporation

            18.1.6.1. Overview

            18.1.6.2. Product Portfolio

            18.1.6.3. Profitability by Market Segments (Filter Type/Wine Type/Structure/Region)

            18.1.6.4. Sales Footprint

            18.1.6.5. Strategy Overview

                18.1.6.5.1. Marketing Strategy

                18.1.6.5.2. Product Strategy

                18.1.6.5.3. Channel Strategy

        18.1.7. LD Carlson Co.

            18.1.7.1. Overview

            18.1.7.2. Product Portfolio

            18.1.7.3. Profitability by Market Segments (Filter Type/Wine Type/Structure/Region)

            18.1.7.4. Sales Footprint

            18.1.7.5. Strategy Overview

                18.1.7.5.1. Marketing Strategy

                18.1.7.5.2. Product Strategy

                18.1.7.5.3. Channel Strategy

        18.1.8. Wine Guardian

            18.1.8.1. Overview

            18.1.8.2. Product Portfolio

            18.1.8.3. Profitability by Market Segments (Filter Type/Wine Type/Structure/Region)

            18.1.8.4. Sales Footprint

            18.1.8.5. Strategy Overview

                18.1.8.5.1. Marketing Strategy

                18.1.8.5.2. Product Strategy

                18.1.8.5.3. Channel Strategy

        18.1.9. Nantong Hailan Filtration Tech Co., Ltd

            18.1.9.1. Overview

            18.1.9.2. Product Portfolio

            18.1.9.3. Profitability by Market Segments (Filter Type/Wine Type/Structure/Region)

            18.1.9.4. Sales Footprint

            18.1.9.5. Strategy Overview

                18.1.9.5.1. Marketing Strategy

                18.1.9.5.2. Product Strategy

                18.1.9.5.3. Channel Strategy

        18.1.10. Sartorius (India) Private Limited

            18.1.10.1. Overview

            18.1.10.2. Product Portfolio

            18.1.10.3. Profitability by Market Segments (Filter Type/Wine Type/Structure/Region)

            18.1.10.4. Sales Footprint

            18.1.10.5. Strategy Overview

                18.1.10.5.1. Marketing Strategy

                18.1.10.5.2. Product Strategy

                18.1.10.5.3. Channel Strategy

        18.1.11. VLS Technologies

            18.1.11.1. Overview

            18.1.11.2. Product Portfolio

            18.1.11.3. Profitability by Market Segments (Filter Type/Wine Type/Structure/Region)

            18.1.11.4. Sales Footprint

            18.1.11.5. Strategy Overview

                18.1.11.5.1. Marketing Strategy

                18.1.11.5.2. Product Strategy

                18.1.11.5.3. Channel Strategy

19. Assumptions & Acronyms Used

20. Research Methodology

Explore Process Automation Insights

View Reports
Future Market Insights

Pressurized Wine Filter System Market