This site uses cookies, including third-party cookies, that help us to provide and improve our services.

Privacy Policy
- Global Locations -
Headquarters
Future Market Insights, Inc.
Christiana Corporate, 200 Continental Drive, Suite 401, Newark, Delaware - 19713, United States
T: +1-845-579-5705
MEA
Market Access DMCC

1602-6 Jumeirah Bay X2 Tower, Plot No: JLT-PH2-X2A,

Jumeirah Lakes Towers, Dubai,

United Arab Emirates

Americas
Future Market Insights
616 Corporate Way, Suite 2-9018,
Valley Cottage, NY 10989,
United States
T: +1-347-918-3531
Europe
Future Market Insights
3rd Floor, 207 Regent Street,
London W1B 3HH
United Kingdom
T: + 44 (0) 20 8123 9659
D: +44 (0) 20 3287 4268
APAC
Future Market Insights
Office No. 401-A, 4th Floor,
VANTAGE 9, S.No. 36/1/1,
Baner, Pune 411045 India

Preterm Birth Prevention and Management Market

Market Insights on Preterm Birth Prevention and Management covering sales outlook, demand forecast & up-to-date key trends

Preterm Birth Prevention and Management Market by Therapy Type (Progesterone Therapy, Corticosteroid Therapy, Tocolytics Therapy, Antihypertensive Therapy, Magnesium Sulfate Therapy, Heparin Prophylaxis Therapy, Low-Dose Aspirin Therapy, Antibiotics Therapy) & Region for 2022-2029

Preterm Birth Prevention and Management Market Outlook – 2022-2029

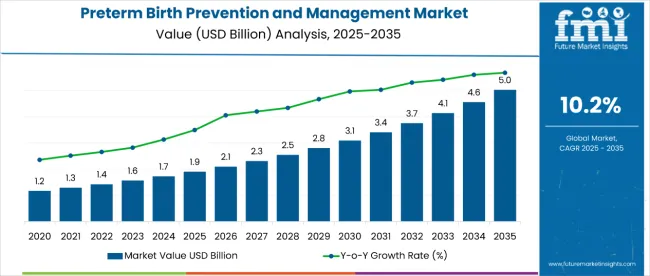
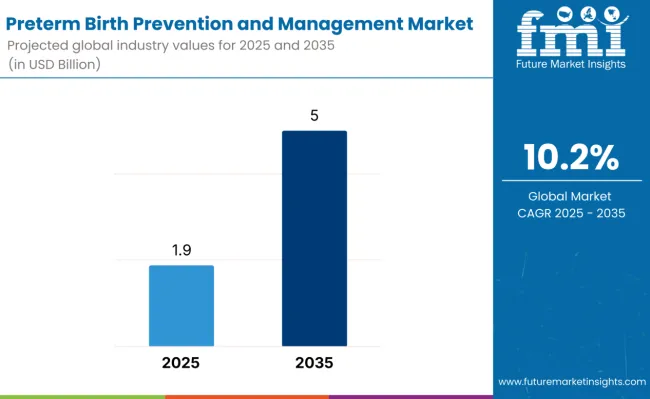
[302 Pages Report] The global Preterm Birth Prevention and Management Market is estimated to be worth around US$ 1.41 Bn in 2022. With increasing adoption of preterm birth prevention and management therapeutics across both developed and developing regions, the overall market is anticipated to grow at 10.1% CAGR between 2022 and 2029, totaling a valuation of US$ 2 .78 Bn by 2029.

Attribute

Details

Preterm Birth Prevention and Management Market Estimated Size in 2022

US$ 1.41 Bn

Preterm Birth Prevention and Management Market Projected Size in 2029

US$ 2.78 Bn

Preterm Birth Prevention and Management Market Historical CAGR (2014-2021)

7.9%

Preterm Birth Prevention and Management Market Value-Based CAGR (2022-2029)

10.1%

Preterm birth has become a major healthcare problem and a significant contributor to perinatal mortality and disability worldwide. In order to address this issue, various approaches are being employed by healthcare workers. This is in turn providing impetus to the preterm birth prevention and management market and the trend is likely to continue in the future. Currently preterm birth prevention and management represents 12.4% of the global prenatal care market.

Regionally, North America and South Asia remain the two most attractive markets for preterm birth prevention and management therapeutic, owing to the rising prevalence of preterm birth, presence of leading market players, new drug development and approvals and increasing government support.

Customize this Report

Let us know your requirement to get
100% FREE customization

How The Market Progressed Till June 2022?

Particulars

Details

H1, 2021

9.67%

H1, 2022 Projected

10.08%

H1, 2022 Outlook

8.98%

BPS Change - H1, 2022 (O) – H1, 2022 (P)

(-) 110 ↓

BPS Change – H1, 2022 (O) – H1, 2021

(-) 69 ↓

H1-2022 outlook period in comparison to H1-2022 projected period showed a negative growth in terms of Basis Point Share by 110 BPS. In H1-2022, the market growth rate of preterm birth prevention and management is expected to fall by 69 basis point share (BPS), as per FMI analysis.

The key developments in the market include the specified WHO guidelines in the management of preterm birth and management of overall maternal health. The market is highly influenced by biologic manufacturing impositions, regulatory framework, and licensing of therapeutic agents.

The market decline observed through the drop in the BPS values is addressed by the advent of the COVID-19 pandemic and the resultant halt in the production capacities as well as supply chain disruptions. This notable change reduced the proliferation of preterm birth prevention therapeutics.

Consequently, the development of several government initiatives to improve maternal and child health will support the market growth, and will likely result in the advancement in growth of the overall preterm birth prevention and management market.

2014-2021 Preterm Birth Prevention and Management Market Outlook Compared to 2021-2029 Forecast

As per FMI, the global preterm birth prevention and management market is set to register a steady CAGR of 10.1% between 2022 and 2029 in comparison to 7.9% CAGR registered from 2014 to 2021.

Rising need for preventing preterm births, growing health awareness among people and increasing emphasis on targeted therapies are some of the factors driving the global preterm birth prevention and management market.

The increasing prevalence of preterm births at an alarming rate has become one of the major concerns for healthcare workers and governing bodies worldwide. It not only puts life of both baby and mother in danger but also incurs heavy financial losses.

According to the World Health Organization (WHO), an estimated 15 million babies are born preterm every year and around 1 million children die each year due to complications of preterm birth. This rise in preterm births worldwide is providing the major thrust to the growth of preterm birth prevention and management market and the trend is likely to continue in the future.

Consequently, increasing adoption of preterm diagnostic tests for better assessment is positively impacting the growth of preterm birth prevention and management market.

Preterm Birth Prevention and Management Market Download Report Brochure

Leading market players are vigorously spending on research activities for developing novel treatment approaches. New combination therapies are being studied for the proper management of preterm birth and post preterm birth complications worldwide.

For instance, in 2021, researchers at the University of Texas Medical Branch (UTMB) developed a new treatment approach that could reduce the incidence of preterm birth, while treating the fetus as the patient.

Besides this, they are aiming at penetrating the lucrative market of developing regions to increase their sales.

Spurred by aforementioned factors, the preterm birth prevention and management market is set to expand 1.96X through 2029.

What are the Factors Driving Preterm Birth Prevention and Management Market?

“Growing Concerns Regarding High Mortality Rate of Preterm Birth Triggering Growth”

Preterm birth is defined as the delivery of a fetus before 37 weeks of pregnancy. Early child birth can lead to various complications including long term disability and death of the child. It is one of the leading causes of neonatal death. According to the World Health Organization (WHO), Preterm birth complications were the leading cause of death among children under 5 years of age in 2015. 

Rising concerns regarding the long-term disability and mortality rate of preterm birth are impelling the adoption of various treatment approaches like progesterone and corticosteroid therapies. Growing popularity of these treatment approaches among people will continue to spur the growth of preterm birth prevention and management market over the assessment period.

“Increasing Initiatives Taken by Government and Private Organizations Pushing Sales”

Amid rising mortality rate associated with preterm births, improving prenatal health has become a top priority for both protecting the child as well as the mother. Various initiatives have been adopted by government and private organizations from time to time to develop proper prenatal care infrastructure. This has created huge space for the leading market players.

Moreover, various investments are being allocated to healthcare institutions for reducing preterm birth and improving prenatal care across the world.

For instance, in 2021, the National Consumer League (NCL) along with patient advocacy organizations launched Preterm Birth Prevention Alliance (PBPA) to reduce recurrent preterm birth cases.

Similarly in September 2021, the U.S. Department of Health and Human Services (HHS) awarded nearly US$ 350 million in awards to states across the nation to support safe pregnancies and healthy babies

Sabyasachi Ghosh
Sabyasachi Ghosh
Principal Consultant
LinkedIn
Talk to Analyst

Find your sweet spots for generating winning opportunities in this market.

Talk to Analyst

Country-wise Insights

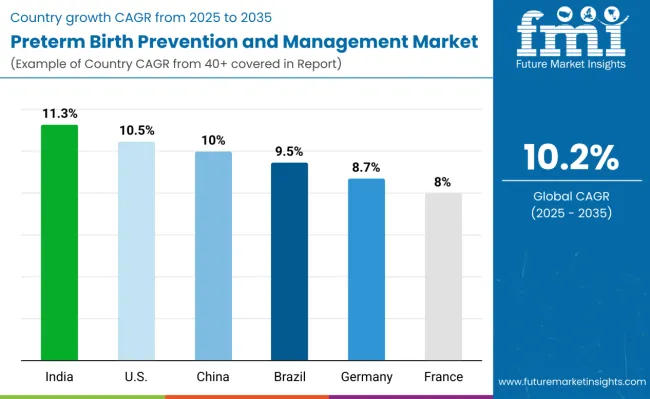
Why is the Preterm Birth Prevention and Management Market Flourishing in India?

“Rising Incidence of Preterm Birth Augmenting Market Growth”

During the last few years India has emerged as a highly lucrative market for preterm birth prevention and management therapeutics across South Asia. The market in the country is driven by rapidly increasing population, rising governmental support, increasing prevalence of preterm birth and growing health awareness among people.

Rising cases of preterm births and high infant mortality rate are creating high demand for preterm birth prevention and management therapeutics across the country. According to the World Health organization (WHO), India remains the biggest contributor to the global burden of preterm births, accounting for over 3,519 100 cases.

Various initiatives and campaigns are being launched by both government and private organizations to tackle the rising burden of preterm births. This will further support the growth of term birth prevention and management market in the country over the assessment period.

What is the Market Outlook for China?

“Increase in Spontaneous Preterm Births Pushing Sales in China”

As per FMI, the China preterm birth prevention and management market is anticipated to grow at a stupendous CAGR over the forecast period. Increasing cases of spontaneous preterm births, easy availability of multiple therapeutics at affordable rates and favorable government regulations are some of the major factors driving the preterm birth prevention and management market in China.

During the last few years, China has witnessed a sharp increase in the cases of preterm births. The country has become the second biggest contributor to the global burden of preterm births with over 1 172 300 cases as per WHO. This rise in preterm birth cases has put preterm birth prevention and management market into the spotlight.

Moreover, the presence of favorable regulations and increasing investments by government on developing the country’s neonatal care infrastructure is positively impacting market growth and the trend is likely to continue in the future.

Why is the U.S. Considered a Leading Market for Preterm Birth Prevention and management?

“Presence of Leading Market Players and Favorable Reimbursement Policies Triggering Growth in U.S.

The U.S. has become one of the most lucrative markets for preterm birth prevention and management due to heavy presence of leading market players, highly established healthcare sector, rising diagnostic rates, availability of favorable reimbursement policies and growing awareness among people regarding pregnancy and infant loss.

Changing lifestyle along with increasing adoption of assistant reproductive technologies in the country has resulted in more multiple pregnancies with high complications. This has pushed the number of preterm births to new heights.

However, with continuous advances in prenatal care and rising government support, the country is gradually becoming successful in countering this rising issue of preterm birth. Huge amounts are being constantly spent on diagnostic tests and preterm birth management treatments.

Moreover, the country is home to some of the leading pharmaceutical giants who are increasingly developing innovative drugs for addressing the preterm birth issue.

Category-wise Insights

Which is the Most Commonly Used Therapy Type for Preterm Birth Prevention and Management?

“Progesterone Therapy Remains Highly Sought After for Preventing Preterm Birth”

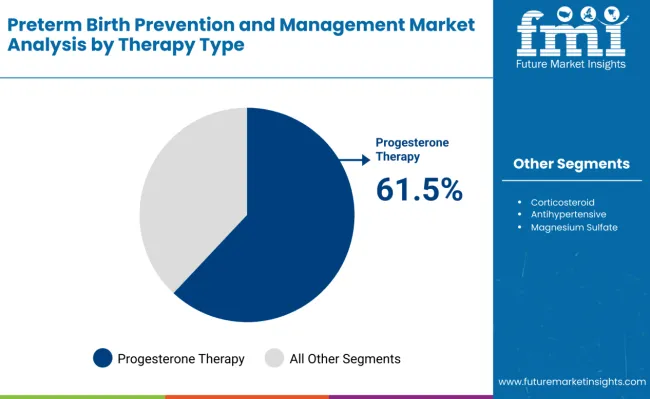
As per FMI, progesterone therapy will continue to remain the most preferred treatment for preventing preterm births owing to its fast action and better efficacy. It is highly recommended by healthcare professionals as it doesn’t require surgery or anesthesia.

Progesterone helps to prevent preterm birth in patients with short cervix, prior spontaneous PTB and several other complications.

Increasing adoption of progesterone therapy for preterm birth prevention and management is anticipated to accelerate the growth of the market at a prolific pace during the forecast period.

Which is the Most Preferred Route of Administration for Preterm Birth Prevention and Management Therapeutics?

“Faster and Higher Bioavailability of Parenteral Route of Administration Making it a Preferred Choice”

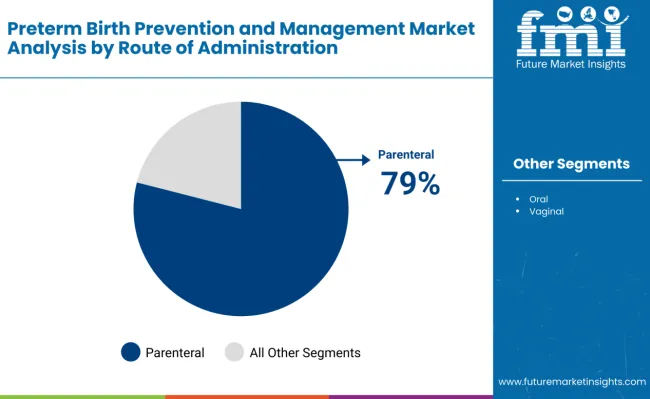
Based on route of administration, the global preterm birth prevention and management market is categorized into oral, parenteral and vaginal. Among these, parenteral segment is anticipated to continue its dominance in the global preterm birth prevention and management market, accounting for a major share of 79.3 in 2022.

Healthcare workers mostly administer preterm birth prevention and management therapeutics such as progesterone and corticosteroid through parenteral route due to its various advantages. The parenteral route of administration offers improved bioavailability, reliable dosing and avoidance of the first pass metabolism.

Which Distribution Channel Will Witness Maximum Sales of Preterm Birth Prevention and Management Drugs?

“Hospital Pharmacies Remain the Most Preferred Distribution Channel for Preterm Birth Prevention and Management Therapeutics”

In terms of distribution channel, preterm birth prevention and management market has been segmented into hospital pharmacies, retail pharmacies, drug stores and mail order pharmacies. Among these, the hospital pharmacies segment accounts for the largest revenue share and is projected to continue its dominance during the forecast period.

Most of the patients prefer to opt for treatment at government hospitals in order to minimize the overall costs. As a result, hospital pharmacies witness more demand for preterm birth prevention and management therapeutics and the trend is likely to continue in the future.

Moreover, shareholders continue to allocate their capitals to hospital pharmacies for distribution of preterm birth prevention and management drugs.

MarketNage
Become a MarketNgage Insider

A unified Market Research Subscription Platform, built for today's disparate research needs.

Competitive Landscape

Leading companies operating in the global preterm birth prevention and management market have adopted various organic and inorganic strategies such as mergers, partnerships, new product launches and approvals, collaborations and acquisitions for expanding their global presence. For instance,

  • In August 2021, the U.S. Food and Drug Administration granted a public hearing to discuss Makena, the only FDA approved treatment for reducing preterm birth in indicated patients, as per Covis Group.
  • In 2020, Covis Group acquired AMAG Pharmaceuticals to become a global market leader of therapeutic solutions for various life-threatening conditions and chronic illness.
  • In July 2019, Novartis AG announced that the Committee for Medicinal Products for Human Use (CHMP) has recommended its approval of Lucentis for the treatment of preterm infants with retinopathy of prematurity.

Scope of the Report

Attribute

Details

 Historical Data Available for

2014-2021

Forecast Period

2022-2029

Market Analysis

Units for Volume and US$ Mn for Value

Key Regions Covered

North America, Europe, Latin America, South Asia, East Asia, Oceania and Middle East and Africa

Key Countries Covered

US, Canada, Mexico, Brazil, Germany, U.K., France, Italy, Spain, Russia, Poland, China, Japan, South Korea, India, ASEAN, Turkey and South Africa

Key Segments Covered

Therapy Type, Route of Administration, Patient Type, Distribution Channel, and Region

Key Companies Profiled

  • Aquatic Remedies Pvt. Ltd.
  • Teva Pharmaceuticals USA, Inc.
  • Anglo French Drugs & Industries Limited
  • Biophar Lifesciences Pvt. Ltd.
  • Jasco Labs (P) Ltd.
  • BSA Pharma Inc.
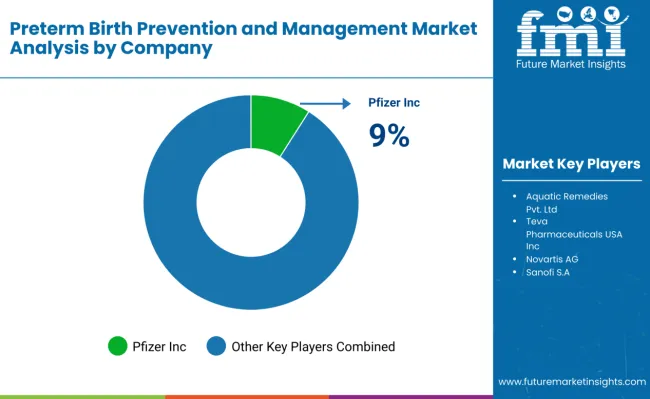
  • Pfizer Inc.
  • Novartis AG
  • Sanofi S.A
  • AMAG Pharmaceuticals
  • Mylan

Report Coverage

Market Forecast, Company Share Analysis, Competition Intelligence, DROT Analysis, Market Dynamics and Challenges, and Strategic Growth Initiatives

Customization & Pricing

Available upon Request

Preterm Birth Prevention and Management Market by Category

By Therapy Type:

  • Progesterone Therapy
  • Corticosteroid Therapy
  • Tocolytics Therapy
  • Antihypertensive Therapy
  • Magnesium Sulfate Therapy
  • Heparin Prophylaxis Therapy
  • Low-Dose Aspirin Therapy
  • Antibiotics Therapy

By Route of Administration:

  • Oral
  • Parenteral
  • Vaginal

By Patient Type:

  • Prior Spontaneous PTB
  • Preeclampsia
  • Short Cervix
  • Chronic Hypertension
  • Insulin-dependent
  • Twins
  • Antiphospholipid Antibody Syndrome
  • Others

By Distribution Channel:

  • Hospital Pharmacies
  • Retail Pharmacies
  • Drug Stores
  • Mail Order Pharmacies

By Region:

  • North America
  • Europe
  • Latin America
  • South Asia
  • East Asia
  • Oceania
  • Middle East and Africa

Frequently Asked Questions

The preterm birth prevention and management market is estimated to be worth around US$ 1.41Bn in 2022.

As per FMI, the preterm birth prevention and management market is forecast to register a CAGR of 10.1% between 2022 and 2029

The preterm birth prevention and management market grew at a CAGR of 7.9% between 2014 and 2021.

Introduction of new therapeutics, rising government support and surging cases of preterm births are some of the key trends shaping the growth of the market.

Aquatic Remedies Pvt. Ltd., Teva Pharmaceuticals USA, Inc., Anglo French Drugs & Industries Limited, Biophar Lifesciences Pvt. Ltd., Jasco Labs (P) Ltd., BSA Pharma Inc., Novartis AG, Sanofi S.A, AMAG Pharmaceuticals, Pfizer Inc., and Mylan are some of the leading players operating in the preterm birth prevention and management market.

Table of Content

1. Executive Summary

    1.1. Global Market Outlook

    1.2. Demand Side Trends

    1.3. Supply Side Trends

    1.4. Analysis and Recommendations

2. Market Overview

    2.1. Market Coverage / Taxonomy

    2.2. Market Definition / Scope / Limitations

3. Key Market Trends

    3.1. Key Trends Impacting the Market

    3.2. Product Innovation / Development Trends

4. Market Background

    4.1. Macro-Economic Factors

        4.1.1. Global GDP Growth Outlook

        4.1.2. Global Healthcare Expenditure  Outlook

    4.2. Forecast Factors - Relevance & Impact

        4.2.1. Incidences of Preterm Birth

        4.2.2. Treatment Cost

        4.2.3. Availability of Reimbursement

        4.2.4. Awareness Regarding Preterm Birth Prevention

        4.2.5. Expected Drug Launches

    4.3. Value Chain Analysis

    4.4. Market Dynamics

        4.4.1. Drivers

        4.4.2. Restraints

    4.5. Opportunity Analysis

5. Key Success Factors

    5.1. Epidemiology of Preterm Birth for Top Countries

    5.2. Treatment Regime by Patient Type 

    5.3. Research and Development Strategies by Key Vendors

    5.4. Regulatory Scenario

    5.5. Exhaustive List of FDA and EMA approved Drugs

    5.6. Pipeline Assessment 

    5.7. Reimbursement Landscape for Top Countries 

    5.8. Patent Scenario

    5.9. Emerging drug delivery platform for PTB prevention & management

    5.10. Key Marketed Drug - Historic Sales Analysis and Forecast

    5.11. License Deal Summary for Key Marketed Drugs

    5.12. Medical Need Assessment / Gap Analysis

6. Global Preterm Birth Prevention and Management Market Pricing Analysis

    6.1. Regional Pricing Analysis By Therapy Type

    6.2. Global Average Pricing Analysis Benchmark

7. Global Preterm Birth Prevention and Management Market Value (US$ Mn) Analysis 2014-2021 and Forecast, 2022-2029

    7.1. Historical Market Value (US$ Mn) Analysis, 2014-2021

    7.2. Current and Future Market Value (US$ Mn) Projections, 2022-2029

        7.2.1. Y-o-Y Growth Trend Analysis

        7.2.2. Absolute $ Opportunity Analysis

8. Global Preterm Birth Prevention and Management Market Analysis 2014-2021 and Forecast 2022-2029, by Therapy Type 

    8.1. Introduction / Key Findings

    8.2. Historical Market Size (US$ Mn) Analysis By Therapy Type, 2014-2021

    8.3. Current and Future Market Size (US$ Mn) Analysis and Forecast By Therapy Type, 2022-2029

        8.3.1. Progesterone Therapy

        8.3.2. Corticosteroid Therapy

        8.3.3. Tocolytics Therapy

        8.3.4. Antihypertensive Therapy

        8.3.5. Magnesium Sulfate Therapy

        8.3.6. Heparin Prophylaxis Therapy

        8.3.7. Low-Dose Aspirin Therapy

        8.3.8. Antibiotics Therapy

    8.4. Market Attractiveness Analysis By Therapy Type 

9. Global Preterm Birth Prevention and Management Market Analysis 2014-2021 and Forecast 2022-2029, by Route of Administration

    9.1. Introduction / Key Findings

    9.2. Historical Market Size (US$ Mn) Analysis By Route of Administration, 2014-2021

    9.3. Current and Future Market Size (US$ Mn) Analysis and Forecast By Route of Administration, 2022-2029

        9.3.1. Oral

        9.3.2. Parenteral

        9.3.3. Vaginal

    9.4. Market Attractiveness Analysis By Route of Administration

10. Global Preterm Birth Prevention and Management Market Analysis 2014-2021 and Forecast 2022-2029, by Patient Type

    10.1. Introduction / Key Findings

    10.2. Historical Market Size (US$ Mn) Analysis By Route of Administration, 2014-2021

    10.3. Current and Future Market Size (US$ Mn) Analysis and Forecast By Patient Type, 2022-2029

        10.3.1. Prior Spontaneous PTB

        10.3.2. Preeclampsia

        10.3.3. Short Cervix

        10.3.4. Chronic Hypertension

        10.3.5. Insulin-dependent

        10.3.6. Twins

        10.3.7. Antiphospholipid Antibody Syndrome 

        10.3.8. Others

    10.4. Market Attractiveness Analysis By Patient Type

11. Global Preterm Birth Prevention and Management Market Analysis 2014-2021 and Forecast 2022-2029, By Distribution Channel 

    11.1. Introduction / Key Findings

    11.2. Historical Market Size (US$ Mn) Analysis By Distribution Channel, 2014-2021

    11.3. Current and Future Market Size (US$ Mn) Analysis and Forecast By Distribution Channel, 2022-2029

        11.3.1. Hospital Pharmacies

        11.3.2. Retail Pharmacies

        11.3.3. Drug Stores

        11.3.4. Mail Order Pharmacies

    11.4. Market Attractiveness Analysis By Distribution Channel

12. Global Preterm Birth Prevention and Management Market Analysis 2014-2021 and Forecast 2022-2029, by Region

    12.1. Introduction

    12.2. Historical Market Size (US$ Mn) Analysis By Region, 2014-2021

    12.3. Current Market Size (US$ Mn) Analysis and Forecast By Region, 2022-2029

        12.3.1. North America

        12.3.2. Latin America

        12.3.3. Europe

        12.3.4. South Asia

        12.3.5. East Asia

        12.3.6. Oceania

        12.3.7. Middle East and Africa (MEA)

    12.4. Market Attractiveness Analysis By Region

13. North America Preterm Birth Prevention and Management Market Analysis 2014-2021 and Forecast 2022-2029

    13.1. Introduction

    13.2. Historical Market Size (US$ Mn) Trend Analysis By Market Taxonomy, 2014-2021

    13.3. Market Size (US$ Mn) Forecast By Market Taxonomy, 2021 - 2028

        13.3.1.  By Country

            13.3.1.1. U.S.

            13.3.1.2. Canada

        13.3.2. By Therapy Type

        13.3.3. By Route of Administration

        13.3.4. By Patient Type

        13.3.5. By Distribution Channel

    13.4. Market Attractiveness Analysis

    13.5. Key Market Participants - Intensity Mapping

    13.6. Drivers and Restraints - Impact Analysis

14. Latin America Preterm Birth Prevention and Management Market Analysis 2014-2021 and Forecast 2022-2029

    14.1. Introduction

    14.2. Historical Market Size (US$ Mn) Trend Analysis By Market Taxonomy, 2014-2021

    14.3. Market Size (US$ Mn) Forecast By Market Taxonomy, 2021 - 2028

        14.3.1.  By Country

            14.3.1.1. Brazil

            14.3.1.2. Mexico

            14.3.1.3. Argentina

            14.3.1.4. Rest of Latin America

        14.3.2. By Therapy Type

        14.3.3. By Route of Administration

        14.3.4. By Patient Type

        14.3.5. By Distribution Channel

    14.4. Market Attractiveness Analysis

    14.5. Key Market Participants - Intensity Mapping

    14.6. Drivers and Restraints - Impact Analysis

15. Europe Preterm Birth Prevention and Management Market Analysis 2014-2021 and Forecast 2022-2029

    15.1. Introduction

    15.2. Historical Market Size (US$ Mn) Trend Analysis By Market Taxonomy, 2014-2021

    15.3. Market Size (US$ Mn) Forecast By Market Taxonomy, 2021 - 2028

        15.3.1.  By Country

            15.3.1.1. Germany

            15.3.1.2. Italy

            15.3.1.3. France

            15.3.1.4. U.K.

            15.3.1.5. Spain

            15.3.1.6. BENELUX

            15.3.1.7. Russia

            15.3.1.8. Poland

            15.3.1.9. Rest of Europe

        15.3.2. By Therapy Type

        15.3.3. By Route of Administration

        15.3.4. By Patient Type

        15.3.5. By Distribution Channel

    15.4. Market Attractiveness Analysis

    15.5. Key Market Participants - Intensity Mapping

    15.6. Drivers and Restraints - Impact Analysis

16. South Asia Preterm Birth Prevention and Management Market Analysis 2014-2021 and Forecast 2022-2029

    16.1. Introduction

    16.2. Historical Market Size (US$ Mn) Trend Analysis By Market Taxonomy, 2014-2021

    16.3. Market Size (US$ Mn) Forecast By Market Taxonomy, 2021 - 2028

        16.3.1.  By Country

            16.3.1.1. India

            16.3.1.2. Thailand

            16.3.1.3. Singapore 

            16.3.1.4. Indonesia

            16.3.1.5. Malaysia

            16.3.1.6. Rest of South Asia

        16.3.2. By Therapy Type

        16.3.3. By Route of Administration

        16.3.4. By Patient Type

        16.3.5. By Distribution Channel

    16.4. Market Attractiveness Analysis

    16.5. Key Market Participants - Intensity Mapping

    16.6. Drivers and Restraints - Impact Analysis

17. East Asia Preterm Birth Prevention and Management Market Analysis 2014-2021 and Forecast 2022-2029

    17.1. Introduction

    17.2. Historical Market Size (US$ Mn) Trend Analysis By Market Taxonomy, 2014-2021

    17.3. Market Size (US$ Mn) Forecast By Market Taxonomy, 2021 - 2028

        17.3.1.  By Country

            17.3.1.1. China

            17.3.1.2. Japan

            17.3.1.3. South Korea

        17.3.2. By Therapy Type

        17.3.3. By Route of Administration

        17.3.4. By Patient Type

        17.3.5. By Distribution Channel

    17.4. Market Attractiveness Analysis

    17.5. Key Market Participants - Intensity Mapping

    17.6. Drivers and Restraints - Impact Analysis

18. Oceania Preterm Birth Prevention and Management Market Analysis 2014-2021 and Forecast 2022-2029

    18.1. Introduction

    18.2. Historical Market Size (US$ Mn) Trend Analysis By Market Taxonomy, 2014-2021

    18.3. Market Size (US$ Mn) Forecast By Market Taxonomy, 2021 - 2028

        18.3.1.  By Country

            18.3.1.1. Australia

            18.3.1.2. New Zealand

        18.3.2. By Therapy Type

        18.3.3. By Route of Administration

        18.3.4. By Patient Type

        18.3.5. By Distribution Channel

    18.4. Market Attractiveness Analysis

    18.5. Key Market Participants - Intensity Mapping

    18.6. Drivers and Restraints - Impact Analysis

19. Middle East and Africa Preterm Birth Prevention and Management Market Analysis 2014-2021 and Forecast 2022-2029

    19.1. Introduction

    19.2. Historical Market Size (US$ Mn) Trend Analysis By Market Taxonomy, 2014-2021

    19.3. Market Size (US$ Mn) Forecast By Market Taxonomy, 2021 - 2028

        19.3.1.  By Country

            19.3.1.1. GCC Countries

            19.3.1.2. Turkey

            19.3.1.3. South Africa

            19.3.1.4. Rest of Middle East and Africa

        19.3.2. By Therapy Type

        19.3.3. By Route of Administration

        19.3.4. By Patient Type

        19.3.5. By Distribution Channel

    19.4. Market Attractiveness Analysis

    19.5. Key Market Participants - Intensity Mapping

    19.6. Drivers and Restraints - Impact Analysis

20. Emerging Countries Preterm Birth Prevention and Management Market Analysis 2014-2021 and Forecast 2022-2029

    20.1. Introduction

        20.1.1. Market Value Proportion Analysis, By Key Countries

        20.1.2. Global Vs. Country Growth Comparison

    20.2. China Preterm Birth Prevention and Management Market Analysis

        20.2.1. Introduction

        20.2.2. Market Value Proportion Analysis by Market Taxonomy

        20.2.3. Market Value (US$ Mn) Analysis and Forecast by Market Taxonomy

            20.2.3.1. By Therapy Type

            20.2.3.2. By Route of Administration

            20.2.3.3. By Patient Type

            20.2.3.4. By Distribution Channel

    20.3. India Preterm Birth Prevention and Management Market Analysis

        20.3.1. Introduction

        20.3.2. Market Value Proportion Analysis by Market Taxonomy

        20.3.3. Market and Value (US$ Mn) Analysis and Forecast by Market Taxonomy

            20.3.3.1. By Therapy Type

            20.3.3.2. By Route of Administration

            20.3.3.3. By Patient Type

            20.3.3.4. By Distribution Channel

    20.4. Brazil Preterm Birth Prevention and Management Market Analysis

        20.4.1. Introduction

        20.4.2. Market Value Proportion Analysis by Market Taxonomy

        20.4.3. Market Value (US$ Mn) Analysis and Forecast by Market Taxonomy

            20.4.3.1. By Therapy Type

            20.4.3.2. By Route of Administration

            20.4.3.3. By Patient Type

            20.4.3.4. By Distribution Channel

21. U.S. Preterm Birth Prevention and Management Market Analysis 2014-2021 and Forecast 2022-2029

    21.1. Introduction

    21.2. Historical Market Size (US$ Mn) Trend Analysis By Market Taxonomy, 2014-2021

    21.3. Market Size (US$ Mn) Forecast By Market Taxonomy, 2022-2029

        21.3.1. By Therapy Type

        21.3.2. By Route of Administration

        21.3.3. By Patient Type

        21.3.4. By Distribution Channel

    21.4. Market Attractiveness Analysis

22. Canada Preterm Birth Prevention and Management Market Analysis 2014-2021 and Forecast 2022-2029

    22.1. Introduction

    22.2. Historical Market Size (US$ Mn) Trend Analysis By Market Taxonomy, 2014-2021

    22.3. Market Size (US$ Mn) Forecast By Market Taxonomy, 2022-2029

        22.3.1. By Therapy Type

        22.3.2. By Route of Administration

        22.3.3. By Patient Type

        22.3.4. By Distribution Channel

    22.4. Market Attractiveness Analysis

23. Japan Preterm Birth Prevention and Management Market Analysis 2014-2021 and Forecast 2022-2029

    23.1. Introduction

    23.2. Historical Market Size (US$ Mn) Trend Analysis By Market Taxonomy, 2014-2021

    23.3. Market Size (US$ Mn) Forecast By Market Taxonomy, 2022-2029

        23.3.1. By Therapy Type

        23.3.2. By Route of Administration

        23.3.3. By Patient Type

        23.3.4. By Distribution Channel

    23.4. Market Attractiveness Analysis

24. South Korea Preterm Birth Prevention and Management Market Analysis 2014-2021 and Forecast 2022-2029

    24.1. Introduction

    24.2. Historical Market Size (US$ Mn) Trend Analysis By Market Taxonomy, 2014-2021

    24.3. Market Size (US$ Mn) Forecast By Market Taxonomy, 2022-2029

        24.3.1. By Therapy Type

        24.3.2. By Route of Administration

        24.3.3. By Patient Type

        24.3.4. By Distribution Channel

    24.4. Market Attractiveness Analysis

25. Australia Preterm Birth Prevention and Management Market Analysis 2014-2021 and Forecast 2022-2029

    25.1. Introduction

    25.2. Historical Market Size (US$ Mn) Trend Analysis By Market Taxonomy, 2014-2021

    25.3. Market Size (US$ Mn) Forecast By Market Taxonomy, 2022-2029

        25.3.1. By Therapy Type

        25.3.2. By Route of Administration

        25.3.3. By Patient Type

        25.3.4. By Distribution Channel

    25.4. Market Attractiveness Analysis

26. New Zealand Preterm Birth Prevention and Management Market Analysis 2014-2021 and Forecast 2022-2029

    26.1. Introduction

    26.2. Historical Market Size (US$ Mn) Trend Analysis By Market Taxonomy, 2014-2021

    26.3. Market Size (US$ Mn) Forecast By Market Taxonomy, 2022-2029

        26.3.1. By Therapy Type

        26.3.2. By Route of Administration

        26.3.3. By Patient Type

        26.3.4. By Distribution Channel

    26.4. Market Attractiveness Analysis

27. Market Structure Analysis

    27.1. Market Analysis by Tier of Companies

    27.2. Market Concentration

    27.3. Market Share Analysis of Top Players

    27.4. Market Presence Analysis

        27.4.1. By Regional footprint of Players

        27.4.2. Product foot print by Players

28. Competition Analysis

    28.1. Competition Dashboard

    28.2. Competition Benchmarking

    28.3. Competition Deep Dive

        28.3.1. Teva Pharmaceutical Industries Ltd.

            28.3.1.1. Overview

            28.3.1.2. Product Portfolio

            28.3.1.3. Profitability by Market Segments (Product/Channel/Region)

            28.3.1.4. Sales Footprint

            28.3.1.5. Strategy Overview

                28.3.1.5.1. Marketing Strategy

                28.3.1.5.2. Product Strategy

                28.3.1.5.3. Channel Strategy

        28.3.2. Allergan, Inc.

            28.3.2.1. Overview

            28.3.2.2. Product Portfolio

            28.3.2.3. Profitability by Market Segments (Product/Channel/Region)

            28.3.2.4. Sales Footprint

            28.3.2.5. Strategy Overview

                28.3.2.5.1. Marketing Strategy

                28.3.2.5.2. Product Strategy

                28.3.2.5.3. Channel Strategy

        28.3.3. Ferring Pharmaceuticals

            28.3.3.1. Overview

            28.3.3.2. Product Portfolio

            28.3.3.3. Profitability by Market Segments (Product/Channel/Region)

            28.3.3.4. Sales Footprint

            28.3.3.5. Strategy Overview

                28.3.3.5.1. Marketing Strategy

                28.3.3.5.2. Product Strategy

                28.3.3.5.3. Channel Strategy

        28.3.4. AbbVie Inc.

            28.3.4.1. Overview

            28.3.4.2. Product Portfolio

            28.3.4.3. Profitability by Market Segments (Product/Channel/Region)

            28.3.4.4. Sales Footprint

            28.3.4.5. Strategy Overview

                28.3.4.5.1. Marketing Strategy

                28.3.4.5.2. Product Strategy

                28.3.4.5.3. Channel Strategy

        28.3.5. Aurobindo Pharma Limited

            28.3.5.1. Overview

            28.3.5.2. Product Portfolio

            28.3.5.3. Profitability by Market Segments (Product/Channel/Region)

            28.3.5.4. Sales Footprint

            28.3.5.5. Strategy Overview

                28.3.5.5.1. Marketing Strategy

                28.3.5.5.2. Product Strategy

                28.3.5.5.3. Channel Strategy

        28.3.6. Bayer AG

            28.3.6.1. Overview

            28.3.6.2. Product Portfolio

            28.3.6.3. Profitability by Market Segments (Product/Channel/Region)

            28.3.6.4. Sales Footprint

            28.3.6.5. Strategy Overview

                28.3.6.5.1. Marketing Strategy

                28.3.6.5.2. Product Strategy

                28.3.6.5.3. Channel Strategy

        28.3.7. Mylan N.V.

            28.3.7.1. Overview

            28.3.7.2. Product Portfolio

            28.3.7.3. Profitability by Market Segments (Product/Channel/Region)

            28.3.7.4. Sales Footprint

            28.3.7.5. Strategy Overview

                28.3.7.5.1. Marketing Strategy

                28.3.7.5.2. Product Strategy

                28.3.7.5.3. Channel Strategy

        28.3.8. Pfizer Inc.

            28.3.8.1. Overview

            28.3.8.2. Product Portfolio

            28.3.8.3. Profitability by Market Segments (Product/Channel/Region)

            28.3.8.4. Sales Footprint

            28.3.8.5. Strategy Overview

                28.3.8.5.1. Marketing Strategy

                28.3.8.5.2. Product Strategy

                28.3.8.5.3. Channel Strategy

        28.3.9. Merck & Co., Inc

            28.3.9.1. Overview

            28.3.9.2. Product Portfolio

            28.3.9.3. Profitability by Market Segments (Product/Channel/Region)

            28.3.9.4. Sales Footprint

            28.3.9.5. Strategy Overview

                28.3.9.5.1. Marketing Strategy

                28.3.9.5.2. Product Strategy

                28.3.9.5.3. Channel Strategy

        28.3.10. AMAG Pharmaceuticals

            28.3.10.1. Overview

            28.3.10.2. Product Portfolio

            28.3.10.3. Profitability by Market Segments (Product/Channel/Region)

            28.3.10.4. Sales Footprint

            28.3.10.5. Strategy Overview

                28.3.10.5.1. Marketing Strategy

                28.3.10.5.2. Product Strategy

                28.3.10.5.3. Channel Strategy

        28.3.11. Bausch Health Companies Inc.

            28.3.11.1. Overview

            28.3.11.2. Product Portfolio

            28.3.11.3. Profitability by Market Segments (Product/Channel/Region)

            28.3.11.4. Sales Footprint

            28.3.11.5. Strategy Overview

                28.3.11.5.1. Marketing Strategy

                28.3.11.5.2. Product Strategy

                28.3.11.5.3. Channel Strategy

        28.3.12. Novartis International AG

            28.3.12.1. Overview

            28.3.12.2. Product Portfolio

            28.3.12.3. Profitability by Market Segments (Product/Channel/Region)

            28.3.12.4. Sales Footprint

            28.3.12.5. Strategy Overview

                28.3.12.5.1. Marketing Strategy

                28.3.12.5.2. Product Strategy

                28.3.12.5.3. Channel Strategy

        28.3.13. Sun Pharmaceutical Industries Ltd. 

            28.3.13.1. Overview

            28.3.13.2. Product Portfolio

            28.3.13.3. Profitability by Market Segments (Product/Channel/Region)

            28.3.13.4. Sales Footprint

            28.3.13.5. Strategy Overview

                28.3.13.5.1. Marketing Strategy

                28.3.13.5.2. Product Strategy

                28.3.13.5.3. Channel Strategy

        28.3.14. Sanofi S.A.

            28.3.14.1. Overview

            28.3.14.2. Product Portfolio

            28.3.14.3. Profitability by Market Segments (Product/Channel/Region)

            28.3.14.4. Sales Footprint

            28.3.14.5. Strategy Overview

                28.3.14.5.1. Marketing Strategy

                28.3.14.5.2. Product Strategy

                28.3.14.5.3. Channel Strategy

29. Assumptions and Acronyms Used

30. Research Methodology
Customize this Report

Let us know your requirement to get
100% FREE customization

List of Tables

Table 01: Expenditure on Health (% of GDP) by Country, 2016 - 2021

Table 02: Expenditure on Health (% of GDP) by Country, 2016 - 2021

Table 03: Pricing Analysis by Therapy Type, 2021

Table 04: Global Preterm Birth Prevention and Management Market Size (US$ Mn) Analysis 2014-2021 and Forecast 2022 - 2029, By Therapy Type

Table 05: Global Preterm Birth Prevention and Management Market Size (US$ Mn) Analysis 2014-2021 and Forecast 2022 - 2029, By Route of Administration

Table 06: Global Preterm Birth Prevention and Management Market Size (US$ Mn) Analysis 2014-2021 and Forecast 2022 - 2029, By Patient Type 

Table 07: Global Preterm Birth Prevention and Management Market Size (US$ Mn) Analysis 2014-2021 and Forecast 2022 - 2029, By Distribution Channel 

Table 08: Global Preterm Birth Prevention and Management Market Size (US$ Mn) Analysis 2014-2021 and Forecast 2022 - 2029, By Region

Table 09: North America Preterm Birth Prevention and Management Market Size (US$ Mn) Analysis 2014-2021 and Forecast 2022 - 2029, By Country

Table 10: North America Preterm Birth Prevention and Management Market Size (US$ Mn) Analysis 2014-2021 and Forecast 2022 - 2029, By Therapy Type

Table 11: North America Preterm Birth Prevention and Management Market Size (US$ Mn) Analysis 2014-2021 and Forecast 2022 - 2029, By Route of Administration

Table 12: North America Preterm Birth Prevention and Management Market Size (US$ Mn) Analysis 2014-2021 and Forecast 2022 - 2029, By Patient Type

Table 13: North America Preterm Birth Prevention and Management Market Size (US$ Mn) Analysis 2014-2021 and Forecast 2022 - 2029, By Distribution Channel

Table 14: Latin America Preterm Birth Prevention and Management Market Size (US$ Mn) Analysis 2014-2021 and Forecast 2022 - 2029, By Country

Table 15: Latin America Preterm Birth Prevention and Management Market Size (US$ Mn) Analysis 2014-2021 and Forecast 2022 - 2029, By Therapy Type

Table 16: Latin America Preterm Birth Prevention and Management Market Size (US$ Mn) Analysis 2014-2021 and Forecast 2022 - 2029, By Route of Administration

Table 17: Latin America Preterm Birth Prevention and Management Market Size (US$ Mn) Analysis 2014-2021 and Forecast 2022 - 2029, By Patient Type

Table 18: Latin America Preterm Birth Prevention and Management Market Size (US$ Mn) Analysis 2014-2021 and Forecast 2022 - 2029, By Distribution Channel

Table 19: Europe Preterm Birth Prevention and Management Market Size (US$ Mn) Analysis 2014-2021 and Forecast 2022 - 2029, By Country

Table 20: Europe Preterm Birth Prevention and Management Market Size (US$ Mn) Analysis 2014-2021 and Forecast 2022 - 2029, By Therapy Type

Table 21: Europe Preterm Birth Prevention and Management Market Size (US$ Mn) Analysis 2014-2021 and Forecast 2022 - 2029, By Route of Administration

Table 22: Europe Preterm Birth Prevention and Management Market Size (US$ Mn) Analysis 2014-2021 and Forecast 2022 - 2029, By Patient Type

Table 23: Europe Preterm Birth Prevention and Management Market Size (US$ Mn) Analysis 2014-2021 and Forecast 2022 - 2029, By Distribution Channel

Table 24: South Asia Preterm Birth Prevention and Management Market Size (US$ Mn) Analysis 2014-2021 and Forecast 2022 - 2029, By Country

Table 25: South Asia Preterm Birth Prevention and Management Market Size (US$ Mn) Analysis 2014-2021 and Forecast 2022 - 2029, By Therapy Type

Table 26: South Asia Preterm Birth Prevention and Management Market Size (US$ Mn) Analysis 2014-2021 and Forecast 2022 - 2029, By Route of Administration

Table 27: South Asia Preterm Birth Prevention and Management Market Size (US$ Mn) Analysis 2014-2021 and Forecast 2022 - 2029, By Patient Type

Table 28: South Asia Preterm Birth Prevention and Management Market Size (US$ Mn) Analysis 2014-2021 and Forecast 2022 - 2029, By Distribution Channel

Table 29: East Asia Preterm Birth Prevention and Management Market Size (US$ Mn) Analysis 2014-2021 and Forecast 2022 - 2029, By Country

Table 30: East Asia Preterm Birth Prevention and Management Market Size (US$ Mn) Analysis 2014-2021 and Forecast 2022 - 2029, By Therapy Type

Table 31: East Asia Preterm Birth Prevention and Management Market Size (US$ Mn) Analysis 2014-2021 and Forecast 2022 - 2029, By Route of Administration

Table 32: East Asia Preterm Birth Prevention and Management Market Size (US$ Mn) Analysis 2014-2021 and Forecast 2022 - 2029, By Patient Type

Table 33: East Asia Preterm Birth Prevention and Management Market Size (US$ Mn) Analysis 2014-2021 and Forecast 2022 - 2029, By Distribution Channel

Table 34: Oceania Preterm Birth Prevention and Management Market Size (US$ Mn) Analysis 2014-2021 and Forecast 2022 - 2029, By Country

Table 35: Oceania Preterm Birth Prevention and Management Market Size (US$ Mn) Analysis 2014-2021 and Forecast 2022 - 2029, By Therapy Type

Table 36: Oceania Preterm Birth Prevention and Management Market Size (US$ Mn) Analysis 2014-2021 and Forecast 2022 - 2029, By Route of Administration

Table 37: Oceania Preterm Birth Prevention and Management Market Size (US$ Mn) Analysis 2014-2021 and Forecast 2022 - 2029, By Patient Type

Table 38: Oceania Preterm Birth Prevention and Management Market Size (US$ Mn) Analysis 2014-2021 and Forecast 2022 - 2029, By Distribution Channel

Table 39: MEA Preterm Birth Prevention and Management Market Size (US$ Mn) Analysis 2014-2021 and Forecast 2022 - 2029, By Country

Table 40: MEA Preterm Birth Prevention and Management Market Size (US$ Mn) Analysis 2014-2021 and Forecast 2022 - 2029, By Therapy Type

Table 41: MEA Preterm Birth Prevention and Management Market Size (US$ Mn) Analysis 2014-2021 and Forecast 2022 - 2029, By Route of Administration

Table 42: MEA Preterm Birth Prevention and Management Market Size (US$ Mn) Analysis 2014-2021 and Forecast 2022 - 2029, By Patient Type

Table 43: MEA Preterm Birth Prevention and Management Market Size (US$ Mn) Analysis 2014-2021 and Forecast 2022 - 2029, By Distribution Channel

Table 44: Emerging countries Preterm Birth Prevention and Management Market Size (US$ Mn) Analysis 2014-2021 and Forecast 2022 - 2029, By region

Table 45: China Preterm Birth Prevention and Management Market Size (US$ Mn) Analysis 2014-2021 and Forecast 2022 - 2029, By Therapy Type

Table 46: China Preterm Birth Prevention and Management Market Size (US$ Mn) Analysis 2014-2021 and Forecast 2022 - 2029, By Route of Administration

Table 47: China Preterm Birth Prevention and Management Market Size (US$ Mn) Analysis 2014-2021 and Forecast 2022 - 2029, By Patient Type

Table 48: China Preterm Birth Prevention and Management Market Size (US$ Mn) Analysis 2014-2021 and Forecast 2022 - 2029, By Distribution Channel

Table 49: India Preterm Birth Prevention and Management Market Size (US$ Mn) Analysis 2014-2021 and Forecast 2022 - 2029, By Therapy Type

Table 50: India Preterm Birth Prevention and Management Market Size (US$ Mn) Analysis 2014-2021 and Forecast 2022 - 2029, By Route of Administration

Table 51: India Preterm Birth Prevention and Management Market Size (US$ Mn) Analysis 2014-2021 and Forecast 2022 - 2029, By Patient Type

Table 52: India Preterm Birth Prevention and Management Market Size (US$ Mn) Analysis 2014-2021 and Forecast 2022 - 2029, By Distribution Channel

Table 53: Brazil Preterm Birth Prevention and Management Market Size (US$ Mn) Analysis 2014-2021 and Forecast 2022 - 2029, By Therapy Type

Table 54: Brazil Preterm Birth Prevention and Management Market Size (US$ Mn) Analysis 2014-2021 and Forecast 2022 - 2029, By Route of Administration

Table 55: Brazil Preterm Birth Prevention and Management Market Size (US$ Mn) Analysis 2014-2021 and Forecast 2022 - 2029, By Patient Type

Table 56: Brazil Preterm Birth Prevention and Management Market Size (US$ Mn) Analysis 2014-2021 and Forecast 2022 - 2029, By Distribution Channel

Table 57: U.S. Preterm Birth Prevention and Management Market Size (US$ Mn) Analysis 2014-2021 and Forecast 2022 - 2029, By Therapy Type

Table 58: U.S. Preterm Birth Prevention and Management Market Size (US$ Mn) Analysis 2014-2021 and Forecast 2022 - 2029, By Route of Administration

Table 59: U.S. Preterm Birth Prevention and Management Market Size (US$ Mn) Analysis 2014-2021 and Forecast 2022 - 2029, By Patient Type

Table 60: U.S. Preterm Birth Prevention and Management Market Size (US$ Mn) Analysis 2014-2021 and Forecast 2022 - 2029, By Distribution Channel

Table 61: Canada Preterm Birth Prevention and Management Market Size (US$ Mn) Analysis 2014-2021 and Forecast 2022 - 2029, By Therapy Type

Table 62: Canada Preterm Birth Prevention and Management Market Size (US$ Mn) Analysis 2014-2021 and Forecast 2022 - 2029, By Route of Administration

Table 63: Canada Preterm Birth Prevention and Management Market Size (US$ Mn) Analysis 2014-2021 and Forecast 2022 - 2029, By Patient Type

Table 64: Canada Preterm Birth Prevention and Management Market Size (US$ Mn) Analysis 2014-2021 and Forecast 2022 - 2029, By Distribution Channel

Table 65: Japan Preterm Birth Prevention and Management Market Size (US$ Mn) Analysis 2014-2021 and Forecast 2022 - 2029, By Therapy Type

Table 66: Japan Preterm Birth Prevention and Management Market Size (US$ Mn) Analysis 2014-2021 and Forecast 2022 - 2029, By Route of Administration

Table 67: Japan Preterm Birth Prevention and Management Market Size (US$ Mn) Analysis 2014-2021 and Forecast 2022 - 2029, By Patient Type

Table 68: Japan Preterm Birth Prevention and Management Market Size (US$ Mn) Analysis 2014-2021 and Forecast 2022 - 2029, By Distribution Channel

Table 69: South Korea Preterm Birth Prevention and Management Market Size (US$ Mn) Analysis 2014-2021 and Forecast 2022 - 2029, By Therapy Type

Table 70: South Korea Preterm Birth Prevention and Management Market Size (US$ Mn) Analysis 2014-2021 and Forecast 2022 - 2029, By Route of Administration

Table 71: South Korea Preterm Birth Prevention and Management Market Size (US$ Mn) Analysis 2014-2021 and Forecast 2022 - 2029, By Patient Type

Table 72: South Korea Preterm Birth Prevention and Management Market Size (US$ Mn) Analysis 2014-2021 and Forecast 2022 - 2029, By Distribution Channel

Table 73: Australia Preterm Birth Prevention and Management Market Size (US$ Mn) Analysis 2014-2021 and Forecast 2022 - 2029, By Therapy Type

Table 74: Australia Preterm Birth Prevention and Management Market Size (US$ Mn) Analysis 2014-2021 and Forecast 2022 - 2029, By Route of Administration

Table 75: Australia Preterm Birth Prevention and Management Market Size (US$ Mn) Analysis 2014-2021 and Forecast 2022 - 2029, By Patient Type

Table 76: Australia Preterm Birth Prevention and Management Market Size (US$ Mn) Analysis 2014-2021 and Forecast 2022 - 2029, By Distribution Channel

Table 77: New Zealand Preterm Birth Prevention and Management Market Size (US$ Mn) Analysis 2014-2021 and Forecast 2022 - 2029, By Therapy Type

Table 78: New Zealand Preterm Birth Prevention and Management Market Size (US$ Mn) Analysis 2014-2021 and Forecast 2022 - 2029, By Route of Administration

Table 79: New Zealand Preterm Birth Prevention and Management Market Size (US$ Mn) Analysis 2014-2021 and Forecast 2022 - 2029, By Patient Type

Table 80: New Zealand Preterm Birth Prevention and Management Market Size (US$ Mn) Analysis 2014-2021 and Forecast 2022 - 2029, By Distribution Channel
Sabyasachi Ghosh
Principal Consultant
LinkedIn
Talk to Analyst

Find your sweet spots for generating winning opportunities in this market.

Talk to Analyst

List of Charts

Figure 01: Preterm Birth Prevention and Management Market Share, By Country (2021)

Figure 02: Preterm Birth Prevention and Management Market Share, By Therapy Type (2021)

Figure 03: Preterm Birth Prevention and Management Market Share, By Route of Administration (2021)

Figure 04: Preterm Birth Prevention and Management Market Share, By Patient Type (2021)

Figure 05: Preterm Birth Prevention and Management Market Share, By Distribution Channel (2021)

Figure 06: GDP (US$ Trillion) and Healthcare Expenditure % (2017)

Figure 07: Net National income, Income Growth and Employment (2014)

Figure 08: Global Preterm Birth Prevention and Management Market Value Analysis (US$ Mn), 2014-2021

Figure 09: Global Preterm Birth Prevention and Management Market Value Analysis (US$ Mn), 2022-2029

Figure 10: Global Preterm Birth Prevention and Management Market Absolute $ Opportunity, 2014-2021

Figure 11: Global Preterm Birth Prevention and Management Market Absolute $ Opportunity, 2022-2029

Figure 12: Global Preterm Birth Prevention and Management Market Analysis by Therapy Type -2022 & 2029

Figure 13: Global Preterm Birth Prevention and Management Market Y-o-Y Growth Projections by Therapy Type, 2022-2029

Figure 14: Global Preterm Birth Prevention and Management Market Attractiveness Analysis, By Therapy Type

Figure 15: Global Preterm Birth Prevention and Management Market Share Analysis (%) By Route of Administration, 2022 & 2029

Figure 16: Global Preterm Birth Prevention and Management Market Y-o-Y Growth (%) By Route of Administration, 2022-2029

Figure 17: Global Preterm Birth Prevention and Management Market Attractiveness Analysis, By Route of Administration

Figure 18: Global Preterm Birth Prevention and Management Market Share Analysis (%) By Patient Type , 2022 & 2029

Figure 19: Global Preterm Birth Prevention and Management Market Y-o-Y Growth (%) By Patient Type , 2022-2029

Figure 20: Global Preterm Birth Prevention and Management Market Attractiveness Analysis, By Patient Type 

Figure 21: Global Preterm Birth Prevention and Management Market Share Analysis (%) By Distribution Channel , 2022 & 2029

Figure 22: Global Preterm Birth Prevention and Management Market Y-o-Y Growth (%) By Distribution Channel , 2022-2029

Figure 23: Global Preterm Birth Prevention and Management Market Attractiveness Analysis, By Distribution Channel 

Figure 24: Global Preterm Birth Prevention and Management Market Share Analysis (%) By Region, 2022 & 2029

Figure 25: Global Preterm Birth Prevention and Management Market Y-o-Y Growth (%) By Region, 2022-2029

Figure 26: Global Preterm Birth Prevention and Management Market Attractiveness Analysis, By Region

Figure 27: North America Preterm Birth Prevention and Management Market Size (US$ Mn), 2014-2021

Figure 28: North America Preterm Birth Prevention and Management Market Size (US$) & Y-o-Y Growth (%), 2022-2029

Figure 29: North America Preterm Birth Prevention and Management Market Analysis by Country - 2022 & 2029

Figure 30: North America Preterm Birth Prevention and Management Market Y-o-Y Growth Projections by Country, 2022-2029

Figure 31: North America Preterm Birth Prevention and Management Market Analysis by Therapy Type -2022 & 2029

Figure 32: North America Preterm Birth Prevention and Management Market Y-o-Y Growth Projections by Therapy Type, 2022-2029

Figure 33: North America Preterm Birth Prevention and Management Market Attractiveness Analysis by Country, 2022-2029

Figure 34: North America Preterm Birth Prevention and Management Market Attractiveness Analysis by Therapy Type, 2022-2029

Figure 35: North America Preterm Birth Prevention and Management Market Attractiveness Analysis by Route of Administration, 2022-2029

Figure 36: North America Preterm Birth Prevention and Management Market Attractiveness Analysis by Patient Type, 2022-2029

Figure 37: North America Preterm Birth Prevention and Management Market Attractiveness Analysis by Distribution Channel, 2022-2029

Figure 38: Latin America Preterm Birth Prevention and Management Market Size (US$ Mn), 2014-2021

Figure 39: Latin America Preterm Birth Prevention and Management Market Size (US$) & Y-o-Y Growth (%), 2022-2029

Figure 40: Latin America Preterm Birth Prevention and Management Market Analysis by Country - 2022 & 2029

Figure 41: Latin America Preterm Birth Prevention and Management Market Y-o-Y Growth Projections by Country, 2022-2029

Figure 42: Latin America Preterm Birth Prevention and Management Market Analysis by Therapy Type -2022 & 2029

Figure 43: Latin America Preterm Birth Prevention and Management Market Y-o-Y Growth Projections by Therapy Type, 2022-2029

Figure 44: Latin America Preterm Birth Prevention and Management Market Attractiveness Analysis by Country, 2022-2029

Figure 45: Latin America Preterm Birth Prevention and Management Market Attractiveness Analysis by Therapy Type, 2022-2029

Figure 46: Latin America Preterm Birth Prevention and Management Market Attractiveness Analysis by Route of Administration, 2022-2029

Figure 47: Latin America Preterm Birth Prevention and Management Market Attractiveness Analysis by Patient Type, 2022-2029

Figure 48: Latin America Preterm Birth Prevention and Management Market Attractiveness Analysis by Distribution Channel, 2022-2029

Figure 49: Europe Preterm Birth Prevention and Management Market Size (US$ Mn), 2014-2021

Figure 50: Europe Preterm Birth Prevention and Management Market Size (US$) & Y-o-Y Growth (%), 2022-2029

Figure 51: Europe Preterm Birth Prevention and Management Market Analysis by Country - 2022 & 2029

Figure 52: Europe Preterm Birth Prevention and Management Market Y-o-Y Growth Projections by Country, 2022-2029

Figure 53: Europe Preterm Birth Prevention and Management Market Analysis by Therapy Type -2022 & 2029

Figure 54: Europe Preterm Birth Prevention and Management Market Y-o-Y Growth Projections by Therapy Type, 2022-2029

Figure 55: Europe Preterm Birth Prevention and Management Market Attractiveness Analysis by Country, 2022-2029

Figure 56: Europe Preterm Birth Prevention and Management Market Attractiveness Analysis by Therapy Type, 2022-2029

Figure 57: Europe Preterm Birth Prevention and Management Market Attractiveness Analysis by Route of Administration, 2022-2029

Figure 58: Europe Preterm Birth Prevention and Management Market Attractiveness Analysis by Patient Type, 2022-2029

Figure 59: Europe Preterm Birth Prevention and Management Market Attractiveness Analysis by Distribution Channel, 2022-2029

Figure 60: South Asia Preterm Birth Prevention and Management Market Size (US$ Mn), 2014-2021

Figure 61: South Asia Preterm Birth Prevention and Management Market Size (US$) & Y-o-Y Growth (%), 2022-2029

Figure 62: South Asia Preterm Birth Prevention and Management Market Analysis by Country - 2022 & 2029

Figure 63: South Asia Preterm Birth Prevention and Management Market Y-o-Y Growth Projections by Country, 2022-2029

Figure 64: South Asia Preterm Birth Prevention and Management Market Analysis by Therapy Type -2022 & 2029

Figure 65: South Asia Preterm Birth Prevention and Management Market Y-o-Y Growth Projections by Therapy Type, 2022-2029

Figure 66: South Asia Preterm Birth Prevention and Management Market Attractiveness Analysis by Country, 2022-2029

Figure 67: South Asia Preterm Birth Prevention and Management Market Attractiveness Analysis by Therapy Type, 2022-2029

Figure 68: South Asia Preterm Birth Prevention and Management Market Attractiveness Analysis by Route of Administration, 2022-2029

Figure 69: South Asia Preterm Birth Prevention and Management Market Attractiveness Analysis by Patient Type, 2022-2029

Figure 70: South Asia Preterm Birth Prevention and Management Market Attractiveness Analysis by Distribution Channel, 2022-2029

Figure 71: East Asia Preterm Birth Prevention and Management Market Size (US$ Mn), 2014-2021

Figure 72: East Asia Preterm Birth Prevention and Management Market Size (US$) & Y-o-Y Growth (%), 2022-2029

Figure 73: East Asia Preterm Birth Prevention and Management Market Analysis by Country - 2022 & 2029

Figure 74: East Asia Preterm Birth Prevention and Management Market Y-o-Y Growth Projections by Country, 2022-2029

Figure 75: East Asia Preterm Birth Prevention and Management Market Analysis by Therapy Type -2022 & 2029

Figure 76: East Asia Preterm Birth Prevention and Management Market Y-o-Y Growth Projections by Therapy Type, 2022-2029

Figure 77: East Asia Preterm Birth Prevention and Management Market Attractiveness Analysis by Country, 2022-2029

Figure 78: East Asia Preterm Birth Prevention and Management Market Attractiveness Analysis by Therapy Type, 2022-2029

Figure 79: East Asia Preterm Birth Prevention and Management Market Attractiveness Analysis by Route of Administration, 2022-2029

Figure 80: East Asia Preterm Birth Prevention and Management Market Attractiveness Analysis by Patient Type, 2022-2029

Figure 81: East Asia Preterm Birth Prevention and Management Market Attractiveness Analysis by Distribution Channel, 2022-2029

Figure 82: Oceania Preterm Birth Prevention and Management Market Size (US$ Mn), 2014-2021

Figure 83: Oceania Preterm Birth Prevention and Management Market Size (US$) & Y-o-Y Growth (%), 2022-2029

Figure 84: Oceania Preterm Birth Prevention and Management Market Analysis by Country - 2022 & 2029

Figure 85: Oceania Preterm Birth Prevention and Management Market Y-o-Y Growth Projections by Country, 2022-2029

Figure 86: Oceania Preterm Birth Prevention and Management Market Analysis by Therapy Type -2022 & 2029

Figure 87: Oceania Preterm Birth Prevention and Management Market Y-o-Y Growth Projections by Therapy Type, 2022-2029

Figure 88: Oceania Preterm Birth Prevention and Management Market Attractiveness Analysis by Country, 2022-2029

Figure 89: Oceania Preterm Birth Prevention and Management Market Attractiveness Analysis by Therapy Type, 2022-2029

Figure 90: Oceania Preterm Birth Prevention and Management Market Attractiveness Analysis by Route of Administration, 2022-2029

Figure 91: Oceania Preterm Birth Prevention and Management Market Attractiveness Analysis by Patient Type, 2022-2029

Figure 92: Oceania Preterm Birth Prevention and Management Market Attractiveness Analysis by Distribution Channel, 2022-2029

Figure 93: MEA Preterm Birth Prevention and Management Market Size (US$ Mn), 2014-2021

Figure 94: MEA Preterm Birth Prevention and Management Market Size (US$) & Y-o-Y Growth (%), 2022-2029

Figure 95: MEA Preterm Birth Prevention and Management Market Analysis by Country - 2022 & 2029

Figure 96: MEA Preterm Birth Prevention and Management Market Y-o-Y Growth Projections by Country, 2022-2029

Figure 97: MEA Preterm Birth Prevention and Management Market Analysis by Therapy Type -2022 & 2029

Figure 98: MEA Preterm Birth Prevention and Management Market Y-o-Y Growth Projections by Therapy Type, 2022-2029

Figure 99: MEA Preterm Birth Prevention and Management Market Attractiveness Analysis by Country, 2022-2029

Figure 100: MEA Preterm Birth Prevention and Management Market Attractiveness Analysis by Therapy Type, 2022-2029

Figure 101: MEA Preterm Birth Prevention and Management Market Attractiveness Analysis by Route of Administration, 2022-2029

Figure 102: MEA Preterm Birth Prevention and Management Market Attractiveness Analysis by Patient Type, 2022-2029

Figure 103: MEA Preterm Birth Prevention and Management Market Attractiveness Analysis by Distribution Channel, 2022-2029

Figure 104: Emerging countries Preterm Birth Prevention and Management Market Size (US$ Mn) Analysis, 2021

Figure 105: Emerging countries Preterm Birth Prevention and Management Market Size (US$ Mn) & Y-o-Y Growth (%), 2014 - 2029

Figure 106: U.S. Preterm Birth Prevention and Management Market Analysis by Therapy Type -2022 & 2029

Figure 107: U.S. Preterm Birth Prevention and Management Market Y-o-Y Growth Projections by Therapy Type, 2022-2029

Figure 108: Canada Preterm Birth Prevention and Management Market Analysis by Therapy Type -2022 & 2029

Figure 109: Canada Preterm Birth Prevention and Management Market Y-o-Y Growth Projections by Therapy Type, 2022-2029

Figure 110: Japan Preterm Birth Prevention and Management Market Analysis by Therapy Type -2022 & 2029

Figure 111: Japan Preterm Birth Prevention and Management Market Y-o-Y Growth Projections by Therapy Type, 2022-2029

Figure 112: South Korea Preterm Birth Prevention and Management Market Analysis by Therapy Type -2022 & 2029

Figure 113: South Korea Preterm Birth Prevention and Management Market Y-o-Y Growth Projections by Therapy Type, 2022-2029

Figure 114: Australia Preterm Birth Prevention and Management Market Analysis by Therapy Type -2022 & 2029

Figure 115: Australia Preterm Birth Prevention and Management Market Y-o-Y Growth Projections by Therapy Type, 2022-2029

Figure 116: New Zealand Preterm Birth Prevention and Management Market Analysis by Therapy Type -2022 & 2029

Figure 117: New Zealand Preterm Birth Prevention and Management Market Y-o-Y Growth Projections by Therapy Type, 2022-2029

Figure 118: Global Preterm Birth Prevention and Management Market Share, By Value of Prominent Key Players, 2021

Need specific information?

Request Customization

Explore Healthcare Insights

View Reports

Recommendations

Healthcare

Self-testing Market

Published : September 2020

Healthcare

Preterm Birth Diagnostic Test Kits Market

Published : December 2021

Healthcare

U.S. Digital Pregnancy Test Kits Market

Published : June 2021

Healthcare

Fertility and Pregnancy Rapid Test Kits Market

Published : February 2022

Google translate

Preterm Birth Prevention and Management Market