Reports

- Global Locations -

Headquarters

Future Market Insights, Inc.

Christiana Corporate, 200
Continental Drive, Suite 401,
Newark, Delaware - 19713,
United States

T: +1-845-579-5705

Americas

Future Market Insights, Inc.

616 Corporate Way, Suite 2-9018,
Valley Cottage, NY 10989, United States

T: +1-347-918-3531

MEA

Future Market Insights

1602-6 Jumeirah Bay X2 Tower, Plot No: JLT-PH2-X2A,
Jumeirah Lakes Towers, Dubai,
United Arab Emirates

Europe

Future Market Insights

3rd Floor, 207 Regent Street,
W1B 3HH London
United Kingdom

T: + 44 (0) 20 8123 9659
D: +44 (0) 20 3287 4268

Asia Pacific

Future Market Insights

IndiaLand Global Tech Park, Unit UG-1, Behind Grand HighStreet, Phase 1, Hinjawadi, MH, Pune – 411057, India

Pub Cellar Equipment Market Outlook (2023 to 2033)

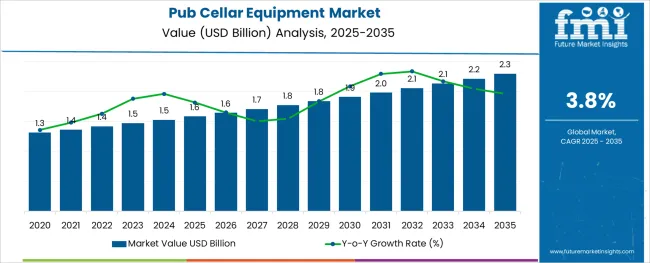
The pub cellar equipment market is anticipated to expand at a CAGR of 3.8% during the forecast period. According to FMI, the market is anticipated to be valued at US$ 2,130.4 million by 2033, up from US$ 1,467.2 million in 2023.

Operational Efficient by Beer Manufacturers Increase Pub Cellar Equipment Opportunities

  • The key market players are improving automation machinery and contributing key roles in operational efficiencies, which are growing the market opportunities in the market.
  • The manufacturers developing premium quality stainless steel pub cellar equipment to store all the necessary products related to liquidators are likely to increase the pub cellar equipment market opportunities.

Advanced Technology and Automation Features Increase the Pub Cellar Equipment Market Trends

  • The key manufacturers in the beverages industry are crafting several innovative and advanced technologies and new equipment that are increasing the market trends.
  • The high quality and hygiene equipment, automation process, Internet of Things, sensors, and others are increasing the pub cellar equipment market trends.
  • Additionally, these equipment are available in different shapes and sizes with aeration features which attract visitors and are likely to increase the adoption of pub cellar equipment.
Attributes Details
Pub Cellar Equipment Market (2023) US$ 1,467.2 million
Pub Cellar Equipment Market (2033) US$ 2,130.4 million
Pub Cellar Equipment Market CAGR (2023 to 2033) 3.8%

Don't pay for what you don't need

Customize your report by selecting specific countries or regions and save 30%!

Historical Outlook Vs Future forecast for Pub cellar equipment market

According to Future Market Insights, the pub cellar equipment market was growing at a CAGR of 4.4% to reach USD 1,413.5 million in 2023 from USD 1,189.8 million in 2018.

The market for pub cellar equipment is forecast to grow significantly in the next decade. The historical outlook for the market was bleak, with little growth forecast. However, the future forecast for the pub cellar equipment market is much more optimistic. The market is expected to grow significantly in the next decade thanks to several factors:

First, the increasing popularity of pubs and bars in developed countries is driving demand for pub cellar equipment. Second, the growing trend of micro-brewing and home brewing is also boosting demand for pub cellar equipment. Third, the rising disposable incomes in developing countries are allowing consumers to spend more on leisure activities such as dining out and drinking at bars, which is also fueling growth in the market for pub cellar equipment. According to research by Future Market Insights, The market is anticipated to expand at a CAGR of 3.8% during the forecast period.

Pub Cellar Equipment Market

Adjacent Market Insights

Pub Cellar Equipment Market:

Differentiating Aspects Pub Cellar Equipment Market
CAGR 3.8%
Market Valuation in 2023 US$ 1467.2 Million
Projected Market Value in 2033 US$ 323.62 Million
Driver The growing demand for premium beer and low-alcohol beverages is likely to accelerate the pub cellar equipment market share.
Opportunity The key market players are improving automation machinery and contributing key roles in operational efficiencies are growing the market opportunities in the market.
Key Trend The high quality and hygiene equipment, automation process, Internet of Things, sensors, and others are increasing the pub cellar equipment market trends.

Construction Equipment Market:

Differentiating Aspects Construction Equipment Market
CAGR 5%
Market Valuation in 2023 US$ 212 Billion
Projected Market Value in 2033 US$ 345.33 Billion
Driver The rising demand for construction equipment due to growing infrastructure, demand for heavy equipment, and building activities.
Opportunity Growing residential and commercial infrastructure, the presence of manufacturers, and investment by key companies are increasing the construction equipment market opportunities.
Key Trend Rising the adoption of advanced technologies such as autonomous machinery, operative vehicles, and wireless communication system are increasing the construction equipment market trends.

Fitness Equipment Market:

Differentiating Aspects Fitness Equipment Market
CAGR 5%
Market Valuation in 2023 US$ 15.35 Billion
Projected Market Value in 2033 US$ 25 Billion
Driver Rising health concerns, focusing on healthy living, and changing lifestyles are increasing the demand for fitness equipment.
Opportunity The manufacturers are developing key role to improve advanced fitness equipment and the growing presence of key manufacturers are surging the fitness equipment market opportunities.
Key Trend The rising exercise classes, swimming pools,s and adoption of exercise equipment are likely to increase the fitness equipment market trends.
Nandini Roy Choudhury

Principal Consultant

Talk to Analyst

Find your sweet spots for generating winning opportunities in this market.

Segmentation Analysis

How is the food and beverage Industry Supporting the Growth of the Pub cellar equipment Market?

The food and beverage industry dominates the market by capturing a significant share during the forecast period. Many pubs and restaurants are now using pub cellar equipment to store their beverages, and this has resulted in strong growth in the market. Due to the number of customers visiting to have a mug of beer, therefore, the advanced machinery equipment adopted by restaurant owners is limiting their workloads. However, the pub cellar equipment market is forecast to grow significantly in the next few years, supported by strong growth in the food and beverage industry.

By Application, which Category will experience Maximum Pub cellar equipment growth?

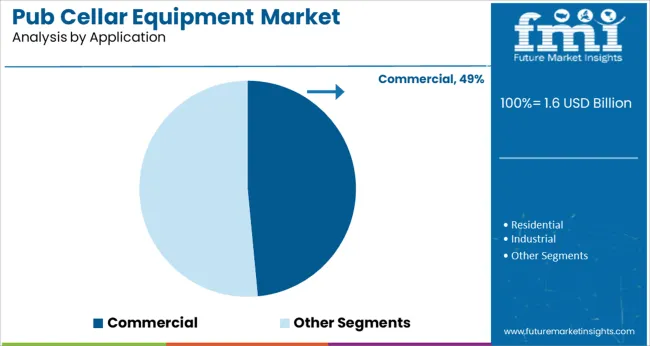
Based on application, the market is further categorized into the industrial, residential, and commercial sectors. It is expected that the residential sector is likely to dominate the market size during the forecast period. In addition, people are increasingly interested in having their own private space for entertaining guests. They are also more likely to invest in higher quality equipment for their home if they have disposable income.

In addition, the commercial sector is also expected to see some growth in pub cellar equipment sales. This is because more businesses are starting to realize the benefits of having a private cellar for their business operations. Overall, the market is expected to experience strong growth in the coming years due to the growing popularity of private cellars among both consumers and businesses alike.
Country-wise insights

How the USA Holds the Largest Market Share in The Pub cellar equipment market?

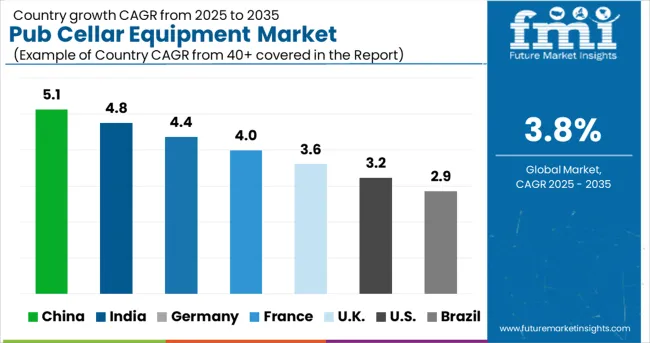
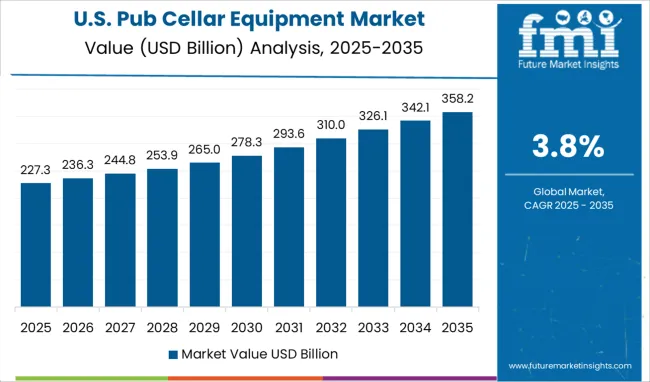
North America is the largest market for pub cellar equipment, accounting for more than a third of the global market share during the forecast period. The USA is the leading nation that contributes the maximum share in the region due to the present number of manufacturers. Some of them are Anheuser-Busch InBev and Molson Coors Brewing Company.

Firstly, the USA has a large number of pubs and bars, which is the main end-use market for pub cellar equipment. Secondly, the region has well-developed distribution channels for pub cellar equipment, making it easy for manufacturers to reach their target customers. Moreover, due to the increasing demand for craft beer and the presence of a large number of microbreweries in the USA. Moreover, Canada is another major contributor to the regional market growth owing to its favorable regulations regarding alcohol consumption and production.

What makes the United Kingdom an Attractive Market for Pub cellar equipment?

Europe has a long and rich history of brewing beer, which has led to a large and passionate market for pub cellar equipment. The United Kingdom is capturing a higher share in the region due to the high demand for quality beer, the relative ease of doing business there, and the large number of potential customers.

The United Kingdom market is highly competitive, but there is still room for new entrants. To succeed, pub cellar equipment manufacturers need to offer products that are superior in quality and performance to those of their competitors. They also need to have a good understanding of the United Kingdom market and be able to tailor their products and services to meet the specific needs of European brewers.

Why is the Asia Pacific Emerging as an Opportunistic Pub cellar equipment Market?

Asia Pacific is expected to be the fastest-growing market for pub cellar equipment during the forecast period. Korea is one of the dominating nations in the region and is flourishing market size due to the increasing number of pubs and bars, which is fueling the demand for pub cellar equipment. Moreover, the region has a large population base, and the growing habit of consuming low-alcoholic drink in Korea are driving the growth of the market.

Japan is another nation that captures a relevant share of the market due to the rising disposable income and changing lifestyle of people during the forecast period. The rising consumption of beer and the adoption of pub cellar equipment in bars are accelerating the Japan pub cellar equipment market size. In addition, the increasing tourism activities and growing wide infrastructure are also expected to boost the growth of the global pub cellar equipment market over the forecast period.

Get the data you need at a Fraction of the cost

Personalize your report by choosing insights you need
and save 40%!

Start-up Ecosystem

Start-up Companies are Adding Value through Innovative Advanced Sensor Pub Cellar Equipment

Start-up companies are adding value in the market by performing better tasks in recent years. The start-up companies are developing highly advanced pub cellar equipment for end-use industries to provide fresh beer to customers' tables. These companies are coming up with innovative skills to provide better and last-long brewery equipment to store beer products with advanced technology.

Nowadays, the advanced sensor pub cellar equipment is offering self-service facilities in bars and restaurants, increasing the market trends. However, innovative ideas and deep-down analysis by start-ups are booming the pub cellar equipment industry in the coming years.
Competitive Landscape

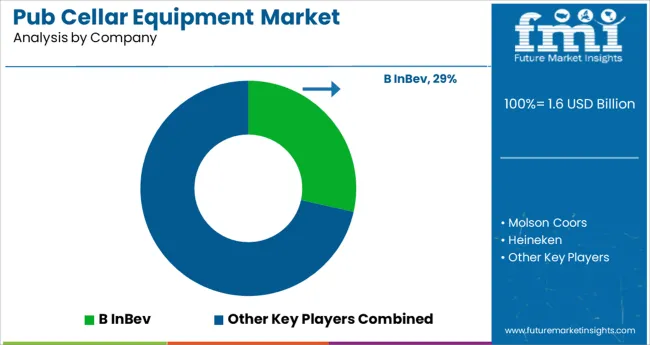
The market for pub cellar equipment is highly competitive, with a large number of players. The key players in the market are AB InBev, Heineken, Molson Coors, Carlsberg, and Diageo. The major players in the market are engaged in intense competition to gain market share. The market for pub cellar equipment is fragmented, with a large number of small and medium-sized manufacturers. The prices of pub cellar equipment vary widely depending on the type and quality of the product. The demand for pub cellar equipment is growing due to the increasing popularity of pubs and bars.

Recent Developments in Pub Cellar Equipment:

  • In Aug 2023, Alfa Laval acquired Sweden-based company Scanjet which is a leading company for cleaning tank equipment and provides services to several end-use companies such as pharmaceuticals, transportation, beverages, and energy among others. The acquisition was made to promote cargo tanks among their consumers in the coming period.
  • In Jan 2023, Alfa Laval collabs with BenLink to expand its services to the end-use industries such as the energy and food sectors. These collaborations help the company to provide service technicians as they can maintain the allover technical works to increase sales.
  • In Feb 2021, Alfa Laval launched its new products for cleaning and maintaining hygiene purposes known as Foodec Hygiene Plus. However, adding CIP bar technology makes them easy to maintain hygiene.

These are some of the major players in the market for Pub cellar equipment

  • AB InBev
  • Molson Coors
  • Heineken
  • Carlsberg
  • Diageo
  • SS Brewtech
  • Perlick Corporation
  • Kegco LLC
  • Asahi Group Holdings
  • Molson Coors Brewing Company

Segmentation by Category in Market for Pub Cellar Equipment

By Type:

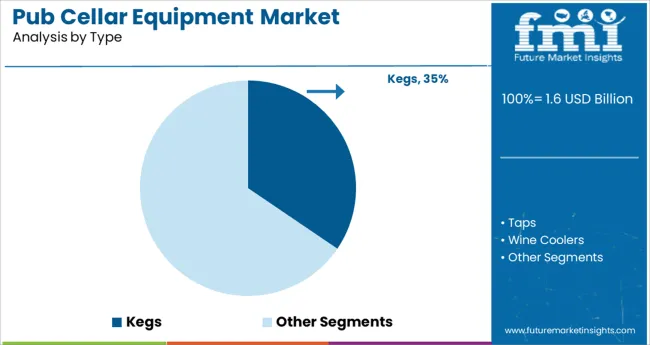
  • Kegs
  • Taps
  • wine coolers

By Product Type:

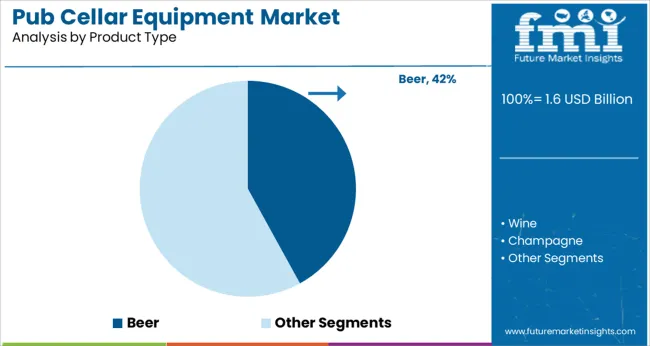
  • Wine
  • Beer
  • Champagne

By Application:

  • Commercial
  • Residential
  • Industrial

By Distribution Channel:

  • Online
  • Offline

By Region:

  • North America
  • Latin America
  • Asia pacific
  • Europe
  • MEA

Frequently Asked Questions

How Much is the Pub Cellar Equipment Market Currently Worth?

The pub cellar equipment market is valued at US$ 1467.2 million.

Why Pub Cellar Equipment Market has High Growth Potential?

The pub cellar equipment market is likely to register a CAGR of 3.8% during the forecast period.

Where will Manufacturers find Most Opportunities in the Pub Cellar Equipment Industry?

The North America holds most opportunities the pub cellar equipment market.

Table of Content

1. Executive Summary | Pub Cellar Equipment Market

    1.1. Global Market Outlook

    1.2. Demand-side Trends

    1.3. Supply-side Trends

    1.4. Technology Roadmap Analysis

    1.5. Analysis and Recommendations

2. Market Overview

    2.1. Market Coverage / Taxonomy

    2.2. Market Definition / Scope / Limitations

3. Market Background

    3.1. Market Dynamics

        3.1.1. Drivers

        3.1.2. Restraints

        3.1.3. Opportunity

        3.1.4. Trends

    3.2. Scenario Forecast

        3.2.1. Demand in Optimistic Scenario

        3.2.2. Demand in Likely Scenario

        3.2.3. Demand in Conservative Scenario

    3.3. Product launches & Recent Developments

    3.4. Product Life Cycle Analysis

    3.5. Value Chain Analysis

        3.5.1. Supply Side Participants and their Roles

            3.5.1.1. Producers

            3.5.1.2. Mid-Level Participants (Traders/ Agents/ Brokers)

            3.5.1.3. Wholesalers and Distributors

        3.5.2. % of Operating Margin Analysis

        3.5.3. List of Raw Material Suppliers

        3.5.4. List of Existing and Potential Buyer’s

    3.6. Global Market - Pricing Analysis

        3.6.1. Price Point Assessment by Region

        3.6.2. Price Point Assessment by Product Type

        3.6.3. Price Forecast till 2033

        3.6.4. Factors affecting pricing

    3.7. Forecast Factors - Relevance & Impact

    3.8. PESTLE and Porter’s Analysis

    3.9. Regulatory Landscape

        3.9.1. Packaging & Labelling Regulations

        3.9.2. Certifications and Certifying Agency Overview

        3.9.3. Import/Export Policies

    3.10. Regional Parent Market Outlook

    3.11. Production and Consumption Statistics

    3.12. Import and Export Statistics

    3.13. Consumers Survey Analysis

    3.14. Macro-Economic Factors

    3.15. Product Claims & Nutritional Information Scan by Buyers

4. Global Analysis 2018 to 2022 and Forecast, 2023 to 2033

    4.1. Historical Market Size Value (US$ million) & Volume (MT) Analysis, 2018 to 2022

    4.2. Current and Future Market Size Value (US$ million) & Volume (MT) Projections, 2023 to 2033

        4.2.1. Y-o-Y Growth Trend Analysis

        4.2.2. Absolute $ Opportunity Analysis

5. Global Analysis 2018 to 2022 and Forecast 2023 to 2033, By Product type

    5.1. Introduction / Key Findings

    5.2. Historical Market Size Value (US$ million) & Volume (MT) Analysis By Product type, 2018 to 2022

    5.3. Current and Future Market Size Value (US$ million) & Volume (MT) Analysis and Forecast By Product type, 2023 to 2033

        5.3.1. Wine

        5.3.2. Beer

        5.3.3. Champagne

    5.4. Y-o-Y Growth Trend Analysis By Product type, 2018 to 2022

    5.5. Absolute $ Opportunity Analysis By Product type, 2023 to 2033

6. Global Analysis 2018 to 2022 and Forecast 2023 to 2033, By Application

    6.1. Introduction / Key Findings

    6.2. Historical Market Size Value (US$ million) & Volume (MT) Analysis By Application, 2018 to 2022

    6.3. Current and Future Market Size Value (US$ million) & Volume (MT) Analysis and Forecast By Application, 2023 to 2033

        6.3.1. Residential

        6.3.2. Commercial

        6.3.3. Industrial

    6.4. Y-o-Y Growth Trend Analysis By Application, 2018 to 2022

    6.5. Absolute $ Opportunity Analysis By Application, 2023 to 2033

7. Global Analysis 2018 to 2022 and Forecast 2023 to 2033, By Type

    7.1. Introduction / Key Findings

    7.2. Historical Market Size Value (US$ million) & Volume (MT) Analysis By Type, 2018 to 2022

    7.3. Current and Future Market Size Value (US$ million) & Volume (MT) Analysis and Forecast By Type, 2023 to 2033

        7.3.1. Kegs

        7.3.2. Taps

        7.3.3. Wine coolers

    7.4. Y-o-Y Growth Trend Analysis By Type, 2018 to 2022

    7.5. Absolute $ Opportunity Analysis By Type, 2023 to 2033

8. Global Analysis 2018 to 2022 and Forecast 2023 to 2033, By Region

    8.1. Introduction

    8.2. Historical Market Size Value (US$ million) & Volume (MT) Analysis By Region, 2018 to 2022

    8.3. Current Market Size Value (US$ million) & Volume (MT) Analysis and Forecast By Region, 2023 to 2033

        8.3.1. North America

        8.3.2. Latin America

        8.3.3. Europe

        8.3.4. East Asia

        8.3.5. South Asia

        8.3.6. Oceania

        8.3.7. Middle East and Africa (MEA)

    8.4. Market Attractiveness Analysis By Region

9. North America Analysis 2018 to 2022 and Forecast 2023 to 2033, By Country

    9.1. Historical Market Size Value (US$ million) & Volume (MT) Trend Analysis By Market Taxonomy, 2018 to 2022

    9.2. Market Size Value (US$ million) & Volume (MT) Forecast By Market Taxonomy, 2023 to 2033

        9.2.1. By Country

            9.2.1.1. The USA

            9.2.1.2. Canada

        9.2.2. By Product type

        9.2.3. By Application

        9.2.4. By Type

    9.3. Market Attractiveness Analysis

        9.3.1. By Country

        9.3.2. By Product type

        9.3.3. By Application

        9.3.4. By Type

    9.4. Key Takeaways

10. Latin America Analysis 2018 to 2022 and Forecast 2023 to 2033, By Country

    10.1. Historical Market Size Value (US$ million) & Volume (MT) Trend Analysis By Market Taxonomy, 2018 to 2022

    10.2. Market Size Value (US$ million) & Volume (MT) Forecast By Market Taxonomy, 2023 to 2033

        10.2.1. By Country

            10.2.1.1. Brazil

            10.2.1.2. Mexico

            10.2.1.3. Argentina

            10.2.1.4. Chile

            10.2.1.5. Peru

            10.2.1.6. Rest of Latin America

        10.2.2. By Product type

        10.2.3. By Application

        10.2.4. By Type

    10.3. Market Attractiveness Analysis

        10.3.1. By Country

        10.3.2. By Product type

        10.3.3. By Application

        10.3.4. By Type

    10.4. Key Takeaways

11. Europe Analysis 2018 to 2022 and Forecast 2023 to 2033, By Country

    11.1. Historical Market Size Value (US$ million) & Volume (MT) Trend Analysis By Market Taxonomy, 2018 to 2022

    11.2. Market Size Value (US$ million) & Volume (MT) Forecast By Market Taxonomy, 2023 to 2033

        11.2.1. By Country

            11.2.1.1. Germany

            11.2.1.2. Italy

            11.2.1.3. France

            11.2.1.4. the United Kingdom

            11.2.1.5. Spain

            11.2.1.6. Russia

            11.2.1.7. BENELUX

            11.2.1.8. Poland

            11.2.1.9. Nordic Countries

            11.2.1.10. Rest of Europe

        11.2.2. By Product type

        11.2.3. By Application

        11.2.4. By Type

    11.3. Market Attractiveness Analysis

        11.3.1. By Country

        11.3.2. By Product type

        11.3.3. By Application

        11.3.4. By Type

    11.4. Key Takeaways

12. East Asia Analysis 2018 to 2022 and Forecast 2023 to 2033, By Country

    12.1. Historical Market Size Value (US$ million) & Volume (MT) Trend Analysis By Market Taxonomy, 2018 to 2022

    12.2. Market Size Value (US$ million) & Volume (MT) Forecast By Market Taxonomy, 2023 to 2033

        12.2.1. By Country

            12.2.1.1. China

            12.2.1.2. Japan

            12.2.1.3. South Korea

        12.2.2. By Product type

        12.2.3. By Application

        12.2.4. By Type

    12.3. Market Attractiveness Analysis

        12.3.1. By Country

        12.3.2. By Product type

        12.3.3. By Application

        12.3.4. By Type

    12.4. Key Takeaways

13. South Asia Analysis 2018 to 2022 and Forecast 2023 to 2033, By Country

    13.1. Historical Market Size Value (US$ million) & Volume (MT) Trend Analysis By Market Taxonomy, 2018 to 2022

    13.2. Market Size Value (US$ million) & Volume (MT) Forecast By Market Taxonomy, 2023 to 2033

        13.2.1. By Country

            13.2.1.1. India

            13.2.1.2. Thailand

            13.2.1.3. Malaysia

            13.2.1.4. Indonesia

            13.2.1.5. Singapore

            13.2.1.6. Rest of South Asia

        13.2.2. By Product type

        13.2.3. By Application

        13.2.4. By Type

    13.3. Market Attractiveness Analysis

        13.3.1. By Country

        13.3.2. By Product type

        13.3.3. By Application

        13.3.4. By Type

    13.4. Key Takeaways

14. Oceania Analysis 2018 to 2022 and Forecast 2023 to 2033, By Country

    14.1. Historical Market Size Value (US$ million) & Volume (MT) Trend Analysis By Market Taxonomy, 2018 to 2022

    14.2. Market Size Value (US$ million) & Volume (MT) Forecast By Market Taxonomy, 2023 to 2033

        14.2.1. By Country

            14.2.1.1. Australia

            14.2.1.2. New Zealand

        14.2.2. By Product type

        14.2.3. By Application

        14.2.4. By Type

    14.3. Market Attractiveness Analysis

        14.3.1. By Country

        14.3.2. By Product type

        14.3.3. By Application

        14.3.4. By Type

    14.4. Key Takeaways

15. MEA Analysis 2018 to 2022 and Forecast 2023 to 2033, By Country

    15.1. Historical Market Size Value (US$ million) & Volume (MT) Trend Analysis By Market Taxonomy, 2018 to 2022

    15.2. Market Size Value (US$ million) & Volume (MT) Forecast By Market Taxonomy, 2023 to 2033

        15.2.1. By Country

            15.2.1.1. GCC Countries

            15.2.1.2. South Africa

            15.2.1.3. Central Africa

            15.2.1.4. North Africa

        15.2.2. By Product type

        15.2.3. By Application

        15.2.4. By Type

    15.3. Market Attractiveness Analysis

        15.3.1. By Country

        15.3.2. By Product type

        15.3.3. By Application

        15.3.4. By Type

    15.4. Key Takeaways

16. Key Countries Analysis

    16.1. the USA

        16.1.1. Pricing Analysis

        16.1.2. Market Share Analysis, 2033

            16.1.2.1. By Product type

            16.1.2.2. By Application

            16.1.2.3. By Type

    16.2. Canada

        16.2.1. Pricing Analysis

        16.2.2. Market Share Analysis, 2033

            16.2.2.1. By Product type

            16.2.2.2. By Application

            16.2.2.3. By Type

    16.3. Brazil

        16.3.1. Pricing Analysis

        16.3.2. Market Share Analysis, 2033

            16.3.2.1. By Product type

            16.3.2.2. By Application

            16.3.2.3. By Type

    16.4. Mexico

        16.4.1. Pricing Analysis

        16.4.2. Market Share Analysis, 2033

            16.4.2.1. By Product type

            16.4.2.2. By Application

            16.4.2.3. By Type

    16.5. Argentina

        16.5.1. Pricing Analysis

        16.5.2. Market Share Analysis, 2033

            16.5.2.1. By Product type

            16.5.2.2. By Application

            16.5.2.3. By Type

    16.6. Chile

        16.6.1. Pricing Analysis

        16.6.2. Market Share Analysis, 2033

            16.6.2.1. By Product type

            16.6.2.2. By Application

            16.6.2.3. By Type

    16.7. Peru

        16.7.1. Pricing Analysis

        16.7.2. Market Share Analysis, 2033

            16.7.2.1. By Product type

            16.7.2.2. By Application

            16.7.2.3. By Type

    16.8. Germany

        16.8.1. Pricing Analysis

        16.8.2. Market Share Analysis, 2033

            16.8.2.1. By Product type

            16.8.2.2. By Application

            16.8.2.3. By Type

    16.9. Italy

        16.9.1. Pricing Analysis

        16.9.2. Market Share Analysis, 2033

            16.9.2.1. By Product type

            16.9.2.2. By Application

            16.9.2.3. By Type

    16.10. France

        16.10.1. Pricing Analysis

        16.10.2. Market Share Analysis, 2033

            16.10.2.1. By Product type

            16.10.2.2. By Application

            16.10.2.3. By Type

    16.11. Spain

        16.11.1. Pricing Analysis

        16.11.2. Market Share Analysis, 2033

            16.11.2.1. By Product type

            16.11.2.2. By Application

            16.11.2.3. By Type

    16.12. The United Kingdom

        16.12.1. Pricing Analysis

        16.12.2. Market Share Analysis, 2033

            16.12.2.1. By Product type

            16.12.2.2. By Application

            16.12.2.3. By Type

    16.13. Russia

        16.13.1. Pricing Analysis

        16.13.2. Market Share Analysis, 2033

            16.13.2.1. By Product type

            16.13.2.2. By Application

            16.13.2.3. By Type

    16.14. Poland

        16.14.1. Pricing Analysis

        16.14.2. Market Share Analysis, 2033

            16.14.2.1. By Product type

            16.14.2.2. By Application

            16.14.2.3. By Type

    16.15. BENELUX

        16.15.1. Pricing Analysis

        16.15.2. Market Share Analysis, 2033

            16.15.2.1. By Product type

            16.15.2.2. By Application

            16.15.2.3. By Type

    16.16. Nordic Countries

        16.16.1. Pricing Analysis

        16.16.2. Market Share Analysis, 2033

            16.16.2.1. By Product type

            16.16.2.2. By Application

            16.16.2.3. By Type

    16.17. China

        16.17.1. Pricing Analysis

        16.17.2. Market Share Analysis, 2033

            16.17.2.1. By Product type

            16.17.2.2. By Application

            16.17.2.3. By Type

    16.18. Japan

        16.18.1. Pricing Analysis

        16.18.2. Market Share Analysis, 2033

            16.18.2.1. By Product type

            16.18.2.2. By Application

            16.18.2.3. By Type

    16.19. South Korea

        16.19.1. Pricing Analysis

        16.19.2. Market Share Analysis, 2033

            16.19.2.1. By Product type

            16.19.2.2. By Application

            16.19.2.3. By Type

    16.20. India

        16.20.1. Pricing Analysis

        16.20.2. Market Share Analysis, 2033

            16.20.2.1. By Product type

            16.20.2.2. By Application

            16.20.2.3. By Type

    16.21. Thailand

        16.21.1. Pricing Analysis

        16.21.2. Market Share Analysis, 2033

            16.21.2.1. By Product type

            16.21.2.2. By Application

            16.21.2.3. By Type

    16.22. Indonesia

        16.22.1. Pricing Analysis

        16.22.2. Market Share Analysis, 2033

            16.22.2.1. By Product type

            16.22.2.2. By Application

            16.22.2.3. By Type

    16.23. Malaysia

        16.23.1. Pricing Analysis

        16.23.2. Market Share Analysis, 2033

            16.23.2.1. By Product type

            16.23.2.2. By Application

            16.23.2.3. By Type

    16.24. Singapore

        16.24.1. Pricing Analysis

        16.24.2. Market Share Analysis, 2033

            16.24.2.1. By Product type

            16.24.2.2. By Application

            16.24.2.3. By Type

    16.25. Australia

        16.25.1. Pricing Analysis

        16.25.2. Market Share Analysis, 2033

            16.25.2.1. By Product type

            16.25.2.2. By Application

            16.25.2.3. By Type

    16.26. New Zealand

        16.26.1. Pricing Analysis

        16.26.2. Market Share Analysis, 2033

            16.26.2.1. By Product type

            16.26.2.2. By Application

            16.26.2.3. By Type

    16.27. GCC Countries

        16.27.1. Pricing Analysis

        16.27.2. Market Share Analysis, 2033

            16.27.2.1. By Product type

            16.27.2.2. By Application

            16.27.2.3. By Type

    16.28. South Africa

        16.28.1. Pricing Analysis

        16.28.2. Market Share Analysis, 2033

            16.28.2.1. By Product type

            16.28.2.2. By Application

            16.28.2.3. By Type

    16.29. North Africa

        16.29.1. Pricing Analysis

        16.29.2. Market Share Analysis, 2033

            16.29.2.1. By Product type

            16.29.2.2. By Application

            16.29.2.3. By Type

    16.30. Central Africa

        16.30.1. Pricing Analysis

        16.30.2. Market Share Analysis, 2033

            16.30.2.1. By Product type

            16.30.2.2. By Application

            16.30.2.3. By Type

17. Market Structure Analysis

    17.1. Competition Dashboard

    17.2. Competition Benchmarking

    17.3. Market Share Analysis of Top Players

        17.3.1. By Regional

        17.3.2. By Product type

        17.3.3. By Application

        17.3.4. By Type

18. Competition Analysis

    18.1. Competition Deep Dive

        18.1.1. AB InBev

            18.1.1.1. Overview

            18.1.1.2. Product Portfolio

            18.1.1.3. Profitability by Market Segments (Type/Product Type /Application/Region)

            18.1.1.4. Sales Footprint

            18.1.1.5. Strategy Overview

                18.1.1.5.1. Marketing Strategy

                18.1.1.5.2. Product Strategy

                18.1.1.5.3. Channel Strategy

        18.1.2. Molson Coors

            18.1.2.1. Overview

            18.1.2.2. Product Portfolio

            18.1.2.3. Profitability by Market Segments (Type/Product Type /Application/Region)

            18.1.2.4. Sales Footprint

            18.1.2.5. Strategy Overview

                18.1.2.5.1. Marketing Strategy

                18.1.2.5.2. Product Strategy

                18.1.2.5.3. Channel Strategy

        18.1.3. Heineken

            18.1.3.1. Overview

            18.1.3.2. Product Portfolio

            18.1.3.3. Profitability by Market Segments (Type/Product Type /Application/Region)

            18.1.3.4. Sales Footprint

            18.1.3.5. Strategy Overview

                18.1.3.5.1. Marketing Strategy

                18.1.3.5.2. Product Strategy

                18.1.3.5.3. Channel Strategy

        18.1.4. Carlsberg

            18.1.4.1. Overview

            18.1.4.2. Product Portfolio

            18.1.4.3. Profitability by Market Segments (Type/Product Type /Application/Region)

            18.1.4.4. Sales Footprint

            18.1.4.5. Strategy Overview

                18.1.4.5.1. Marketing Strategy

                18.1.4.5.2. Product Strategy

                18.1.4.5.3. Channel Strategy

        18.1.5. Diageo

            18.1.5.1. Overview

            18.1.5.2. Product Portfolio

            18.1.5.3. Profitability by Market Segments (Type/Product Type /Application/Region)

            18.1.5.4. Sales Footprint

            18.1.5.5. Strategy Overview

                18.1.5.5.1. Marketing Strategy

                18.1.5.5.2. Product Strategy

                18.1.5.5.3. Channel Strategy

        18.1.6. SS Brewtech

            18.1.6.1. Overview

            18.1.6.2. Product Portfolio

            18.1.6.3. Profitability by Market Segments (Type/Product Type /Application/Region)

            18.1.6.4. Sales Footprint

            18.1.6.5. Strategy Overview

                18.1.6.5.1. Marketing Strategy

                18.1.6.5.2. Product Strategy

                18.1.6.5.3. Channel Strategy

        18.1.7. Perlick Corporation

            18.1.7.1. Overview

            18.1.7.2. Product Portfolio

            18.1.7.3. Profitability by Market Segments (Type/Product Type /Application/Region)

            18.1.7.4. Sales Footprint

            18.1.7.5. Strategy Overview

                18.1.7.5.1. Marketing Strategy

                18.1.7.5.2. Product Strategy

                18.1.7.5.3. Channel Strategy

        18.1.8. Kegco LLC

            18.1.8.1. Overview

            18.1.8.2. Product Portfolio

            18.1.8.3. Profitability by Market Segments (Type/Product Type /Application/Region)

            18.1.8.4. Sales Footprint

            18.1.8.5. Strategy Overview

                18.1.8.5.1. Marketing Strategy

                18.1.8.5.2. Product Strategy

                18.1.8.5.3. Channel Strategy

        18.1.9. Asahi Group Holdings

            18.1.9.1. Overview

            18.1.9.2. Product Portfolio

            18.1.9.3. Profitability by Market Segments (Type/Product Type /Application/Region)

            18.1.9.4. Sales Footprint

            18.1.9.5. Strategy Overview

                18.1.9.5.1. Marketing Strategy

                18.1.9.5.2. Product Strategy

                18.1.9.5.3. Channel Strategy

        18.1.10. Molson Coors Brewing Company

            18.1.10.1. Overview

            18.1.10.2. Product Portfolio

            18.1.10.3. Profitability by Market Segments (Type/Product Type /Application/Region)

            18.1.10.4. Sales Footprint

            18.1.10.5. Strategy Overview

                18.1.10.5.1. Marketing Strategy

                18.1.10.5.2. Product Strategy

                18.1.10.5.3. Channel Strategy

19. Assumptions & Acronyms Used

20. Research Methodology

Don't pay for what you don't need

Customize your report by selecting specific countries or regions and save 30%!

List of Tables

Table 1: Global Value (US$ million) Forecast by Region, 2018 to 2033

Table 2: Global Volume (MT) Forecast by Region, 2018 to 2033

Table 3: Global Value (US$ million) Forecast by Product type, 2018 to 2033

Table 4: Global Volume (MT) Forecast by Product type, 2018 to 2033

Table 5: Global Value (US$ million) Forecast by Application, 2018 to 2033

Table 6: Global Volume (MT) Forecast by Application, 2018 to 2033

Table 7: Global Value (US$ million) Forecast by Type, 2018 to 2033

Table 8: Global Volume (MT) Forecast by Type, 2018 to 2033

Table 9: North America Value (US$ million) Forecast by Country, 2018 to 2033

Table 10: North America Volume (MT) Forecast by Country, 2018 to 2033

Table 11: North America Value (US$ million) Forecast by Product type, 2018 to 2033

Table 12: North America Volume (MT) Forecast by Product type, 2018 to 2033

Table 13: North America Value (US$ million) Forecast by Application, 2018 to 2033

Table 14: North America Volume (MT) Forecast by Application, 2018 to 2033

Table 15: North America Value (US$ million) Forecast by Type, 2018 to 2033

Table 16: North America Volume (MT) Forecast by Type, 2018 to 2033

Table 17: Latin America Value (US$ million) Forecast by Country, 2018 to 2033

Table 18: Latin America Volume (MT) Forecast by Country, 2018 to 2033

Table 19: Latin America Value (US$ million) Forecast by Product type, 2018 to 2033

Table 20: Latin America Volume (MT) Forecast by Product type, 2018 to 2033

Table 21: Latin America Value (US$ million) Forecast by Application, 2018 to 2033

Table 22: Latin America Volume (MT) Forecast by Application, 2018 to 2033

Table 23: Latin America Value (US$ million) Forecast by Type, 2018 to 2033

Table 24: Latin America Volume (MT) Forecast by Type, 2018 to 2033

Table 25: Europe Value (US$ million) Forecast by Country, 2018 to 2033

Table 26: Europe Volume (MT) Forecast by Country, 2018 to 2033

Table 27: Europe Value (US$ million) Forecast by Product type, 2018 to 2033

Table 28: Europe Volume (MT) Forecast by Product type, 2018 to 2033

Table 29: Europe Value (US$ million) Forecast by Application, 2018 to 2033

Table 30: Europe Volume (MT) Forecast by Application, 2018 to 2033

Table 31: Europe Value (US$ million) Forecast by Type, 2018 to 2033

Table 32: Europe Volume (MT) Forecast by Type, 2018 to 2033

Table 33: East Asia Value (US$ million) Forecast by Country, 2018 to 2033

Table 34: East Asia Volume (MT) Forecast by Country, 2018 to 2033

Table 35: East Asia Value (US$ million) Forecast by Product type, 2018 to 2033

Table 36: East Asia Volume (MT) Forecast by Product type, 2018 to 2033

Table 37: East Asia Value (US$ million) Forecast by Application, 2018 to 2033

Table 38: East Asia Volume (MT) Forecast by Application, 2018 to 2033

Table 39: East Asia Value (US$ million) Forecast by Type, 2018 to 2033

Table 40: East Asia Volume (MT) Forecast by Type, 2018 to 2033

Table 41: South Asia Value (US$ million) Forecast by Country, 2018 to 2033

Table 42: South Asia Volume (MT) Forecast by Country, 2018 to 2033

Table 43: South Asia Value (US$ million) Forecast by Product type, 2018 to 2033

Table 44: South Asia Volume (MT) Forecast by Product type, 2018 to 2033

Table 45: South Asia Value (US$ million) Forecast by Application, 2018 to 2033

Table 46: South Asia Volume (MT) Forecast by Application, 2018 to 2033

Table 47: South Asia Value (US$ million) Forecast by Type, 2018 to 2033

Table 48: South Asia Volume (MT) Forecast by Type, 2018 to 2033

Table 49: Oceania Value (US$ million) Forecast by Country, 2018 to 2033

Table 50: Oceania Volume (MT) Forecast by Country, 2018 to 2033

Table 51: Oceania Value (US$ million) Forecast by Product type, 2018 to 2033

Table 52: Oceania Volume (MT) Forecast by Product type, 2018 to 2033

Table 53: Oceania Value (US$ million) Forecast by Application, 2018 to 2033

Table 54: Oceania Volume (MT) Forecast by Application, 2018 to 2033

Table 55: Oceania Value (US$ million) Forecast by Type, 2018 to 2033

Table 56: Oceania Volume (MT) Forecast by Type, 2018 to 2033

Table 57: MEA Value (US$ million) Forecast by Country, 2018 to 2033

Table 58: MEA Volume (MT) Forecast by Country, 2018 to 2033

Table 59: MEA Value (US$ million) Forecast by Product type, 2018 to 2033

Table 60: MEA Volume (MT) Forecast by Product type, 2018 to 2033

Table 61: MEA Value (US$ million) Forecast by Application, 2018 to 2033

Table 62: MEA Volume (MT) Forecast by Application, 2018 to 2033

Table 63: MEA Value (US$ million) Forecast by Type, 2018 to 2033

Table 64: MEA Volume (MT) Forecast by Type, 2018 to 2033
Nandini Roy Choudhury

Principal Consultant

Talk to Analyst

Find your sweet spots for generating winning opportunities in this market.

List of Charts

Figure 1: Global Value (US$ million) by Product Type, 2023 to 2033

Figure 2: Global Value (US$ million) by Application, 2023 to 2033

Figure 3: Global Value (US$ million) by Type, 2023 to 2033

Figure 4: Global Value (US$ million) by Region, 2023 to 2033

Figure 5: Global Value (US$ million) Analysis by Region, 2018 to 2033

Figure 6: Global Volume (MT) Analysis by Region, 2018 to 2033

Figure 7: Global Value Share (%) and BPS Analysis by Region, 2023 to 2033

Figure 8: Global Y-o-Y Growth (%) Projections by Region, 2023 to 2033

Figure 9: Global Value (US$ million) Analysis by Product Type, 2018 to 2033

Figure 10: Global Volume (MT) Analysis by Product Type, 2018 to 2033

Figure 11: Global Value Share (%) and BPS Analysis by Product Type, 2023 to 2033

Figure 12: Global Y-o-Y Growth (%) Projections by Product Type, 2023 to 2033

Figure 13: Global Value (US$ million) Analysis by Application, 2018 to 2033

Figure 14: Global Volume (MT) Analysis by Application, 2018 to 2033

Figure 15: Global Value Share (%) and BPS Analysis by Application, 2023 to 2033

Figure 16: Global Y-o-Y Growth (%) Projections by Application, 2023 to 2033

Figure 17: Global Value (US$ million) Analysis by Type, 2018 to 2033

Figure 18: Global Volume (MT) Analysis by Type, 2018 to 2033

Figure 19: Global Value Share (%) and BPS Analysis by Type, 2023 to 2033

Figure 20: Global Y-o-Y Growth (%) Projections by Type, 2023 to 2033

Figure 21: Global Attractiveness by Product Type, 2023 to 2033

Figure 22: Global Attractiveness by Application, 2023 to 2033

Figure 23: Global Attractiveness by Type, 2023 to 2033

Figure 24: Global Attractiveness by Region, 2023 to 2033

Figure 25: North America Value (US$ million) by Product Type, 2023 to 2033

Figure 26: North America Value (US$ million) by Application, 2023 to 2033

Figure 27: North America Value (US$ million) by Type, 2023 to 2033

Figure 28: North America Value (US$ million) by Country, 2023 to 2033

Figure 29: North America Value (US$ million) Analysis by Country, 2018 to 2033

Figure 30: North America Volume (MT) Analysis by Country, 2018 to 2033

Figure 31: North America Value Share (%) and BPS Analysis by Country, 2023 to 2033

Figure 32: North America Y-o-Y Growth (%) Projections by Country, 2023 to 2033

Figure 33: North America Value (US$ million) Analysis by Product Type, 2018 to 2033

Figure 34: North America Volume (MT) Analysis by Product Type, 2018 to 2033

Figure 35: North America Value Share (%) and BPS Analysis by Product Type, 2023 to 2033

Figure 36: North America Y-o-Y Growth (%) Projections by Product Type, 2023 to 2033

Figure 37: North America Value (US$ million) Analysis by Application, 2018 to 2033

Figure 38: North America Volume (MT) Analysis by Application, 2018 to 2033

Figure 39: North America Value Share (%) and BPS Analysis by Application, 2023 to 2033

Figure 40: North America Y-o-Y Growth (%) Projections by Application, 2023 to 2033

Figure 41: North America Value (US$ million) Analysis by Type, 2018 to 2033

Figure 42: North America Volume (MT) Analysis by Type, 2018 to 2033

Figure 43: North America Value Share (%) and BPS Analysis by Type, 2023 to 2033

Figure 44: North America Y-o-Y Growth (%) Projections by Type, 2023 to 2033

Figure 45: North America Attractiveness by Product Type, 2023 to 2033

Figure 46: North America Attractiveness by Application, 2023 to 2033

Figure 47: North America Attractiveness by Type, 2023 to 2033

Figure 48: North America Attractiveness by Country, 2023 to 2033

Figure 49: Latin America Value (US$ million) by Product Type, 2023 to 2033

Figure 50: Latin America Value (US$ million) by Application, 2023 to 2033

Figure 51: Latin America Value (US$ million) by Type, 2023 to 2033

Figure 52: Latin America Value (US$ million) by Country, 2023 to 2033

Figure 53: Latin America Value (US$ million) Analysis by Country, 2018 to 2033

Figure 54: Latin America Volume (MT) Analysis by Country, 2018 to 2033

Figure 55: Latin America Value Share (%) and BPS Analysis by Country, 2023 to 2033

Figure 56: Latin America Y-o-Y Growth (%) Projections by Country, 2023 to 2033

Figure 57: Latin America Value (US$ million) Analysis by Product Type, 2018 to 2033

Figure 58: Latin America Volume (MT) Analysis by Product Type, 2018 to 2033

Figure 59: Latin America Value Share (%) and BPS Analysis by Product Type, 2023 to 2033

Figure 60: Latin America Y-o-Y Growth (%) Projections by Product Type, 2023 to 2033

Figure 61: Latin America Value (US$ million) Analysis by Application, 2018 to 2033

Figure 62: Latin America Volume (MT) Analysis by Application, 2018 to 2033

Figure 63: Latin America Value Share (%) and BPS Analysis by Application, 2023 to 2033

Figure 64: Latin America Y-o-Y Growth (%) Projections by Application, 2023 to 2033

Figure 65: Latin America Value (US$ million) Analysis by Type, 2018 to 2033

Figure 66: Latin America Volume (MT) Analysis by Type, 2018 to 2033

Figure 67: Latin America Value Share (%) and BPS Analysis by Type, 2023 to 2033

Figure 68: Latin America Y-o-Y Growth (%) Projections by Type, 2023 to 2033

Figure 69: Latin America Attractiveness by Product Type, 2023 to 2033

Figure 70: Latin America Attractiveness by Application, 2023 to 2033

Figure 71: Latin America Attractiveness by Type, 2023 to 2033

Figure 72: Latin America Attractiveness by Country, 2023 to 2033

Figure 73: Europe Value (US$ million) by Product Type, 2023 to 2033

Figure 74: Europe Value (US$ million) by Application, 2023 to 2033

Figure 75: Europe Value (US$ million) by Type, 2023 to 2033

Figure 76: Europe Value (US$ million) by Country, 2023 to 2033

Figure 77: Europe Value (US$ million) Analysis by Country, 2018 to 2033

Figure 78: Europe Volume (MT) Analysis by Country, 2018 to 2033

Figure 79: Europe Value Share (%) and BPS Analysis by Country, 2023 to 2033

Figure 80: Europe Y-o-Y Growth (%) Projections by Country, 2023 to 2033

Figure 81: Europe Value (US$ million) Analysis by Product Type, 2018 to 2033

Figure 82: Europe Volume (MT) Analysis by Product Type, 2018 to 2033

Figure 83: Europe Value Share (%) and BPS Analysis by Product Type, 2023 to 2033

Figure 84: Europe Y-o-Y Growth (%) Projections by Product Type, 2023 to 2033

Figure 85: Europe Value (US$ million) Analysis by Application, 2018 to 2033

Figure 86: Europe Volume (MT) Analysis by Application, 2018 to 2033

Figure 87: Europe Value Share (%) and BPS Analysis by Application, 2023 to 2033

Figure 88: Europe Y-o-Y Growth (%) Projections by Application, 2023 to 2033

Figure 89: Europe Value (US$ million) Analysis by Type, 2018 to 2033

Figure 90: Europe Volume (MT) Analysis by Type, 2018 to 2033

Figure 91: Europe Value Share (%) and BPS Analysis by Type, 2023 to 2033

Figure 92: Europe Y-o-Y Growth (%) Projections by Type, 2023 to 2033

Figure 93: Europe Attractiveness by Product Type, 2023 to 2033

Figure 94: Europe Attractiveness by Application, 2023 to 2033

Figure 95: Europe Attractiveness by Type, 2023 to 2033

Figure 96: Europe Attractiveness by Country, 2023 to 2033

Figure 97: East Asia Value (US$ million) by Product Type, 2023 to 2033

Figure 98: East Asia Value (US$ million) by Application, 2023 to 2033

Figure 99: East Asia Value (US$ million) by Type, 2023 to 2033

Figure 100: East Asia Value (US$ million) by Country, 2023 to 2033

Figure 101: East Asia Value (US$ million) Analysis by Country, 2018 to 2033

Figure 102: East Asia Volume (MT) Analysis by Country, 2018 to 2033

Figure 103: East Asia Value Share (%) and BPS Analysis by Country, 2023 to 2033

Figure 104: East Asia Y-o-Y Growth (%) Projections by Country, 2023 to 2033

Figure 105: East Asia Value (US$ million) Analysis by Product Type, 2018 to 2033

Figure 106: East Asia Volume (MT) Analysis by Product Type, 2018 to 2033

Figure 107: East Asia Value Share (%) and BPS Analysis by Product Type, 2023 to 2033

Figure 108: East Asia Y-o-Y Growth (%) Projections by Product Type, 2023 to 2033

Figure 109: East Asia Value (US$ million) Analysis by Application, 2018 to 2033

Figure 110: East Asia Volume (MT) Analysis by Application, 2018 to 2033

Figure 111: East Asia Value Share (%) and BPS Analysis by Application, 2023 to 2033

Figure 112: East Asia Y-o-Y Growth (%) Projections by Application, 2023 to 2033

Figure 113: East Asia Value (US$ million) Analysis by Type, 2018 to 2033

Figure 114: East Asia Volume (MT) Analysis by Type, 2018 to 2033

Figure 115: East Asia Value Share (%) and BPS Analysis by Type, 2023 to 2033

Figure 116: East Asia Y-o-Y Growth (%) Projections by Type, 2023 to 2033

Figure 117: East Asia Attractiveness by Product Type, 2023 to 2033

Figure 118: East Asia Attractiveness by Application, 2023 to 2033

Figure 119: East Asia Attractiveness by Type, 2023 to 2033

Figure 120: East Asia Attractiveness by Country, 2023 to 2033

Figure 121: South Asia Value (US$ million) by Product Type, 2023 to 2033

Figure 122: South Asia Value (US$ million) by Application, 2023 to 2033

Figure 123: South Asia Value (US$ million) by Type, 2023 to 2033

Figure 124: South Asia Value (US$ million) by Country, 2023 to 2033

Figure 125: South Asia Value (US$ million) Analysis by Country, 2018 to 2033

Figure 126: South Asia Volume (MT) Analysis by Country, 2018 to 2033

Figure 127: South Asia Value Share (%) and BPS Analysis by Country, 2023 to 2033

Figure 128: South Asia Y-o-Y Growth (%) Projections by Country, 2023 to 2033

Figure 129: South Asia Value (US$ million) Analysis by Product Type, 2018 to 2033

Figure 130: South Asia Volume (MT) Analysis by Product Type, 2018 to 2033

Figure 131: South Asia Value Share (%) and BPS Analysis by Product Type, 2023 to 2033

Figure 132: South Asia Y-o-Y Growth (%) Projections by Product Type, 2023 to 2033

Figure 133: South Asia Value (US$ million) Analysis by Application, 2018 to 2033

Figure 134: South Asia Volume (MT) Analysis by Application, 2018 to 2033

Figure 135: South Asia Value Share (%) and BPS Analysis by Application, 2023 to 2033

Figure 136: South Asia Y-o-Y Growth (%) Projections by Application, 2023 to 2033

Figure 137: South Asia Value (US$ million) Analysis by Type, 2018 to 2033

Figure 138: South Asia Volume (MT) Analysis by Type, 2018 to 2033

Figure 139: South Asia Value Share (%) and BPS Analysis by Type, 2023 to 2033

Figure 140: South Asia Y-o-Y Growth (%) Projections by Type, 2023 to 2033

Figure 141: South Asia Attractiveness by Product Type, 2023 to 2033

Figure 142: South Asia Attractiveness by Application, 2023 to 2033

Figure 143: South Asia Attractiveness by Type, 2023 to 2033

Figure 144: South Asia Attractiveness by Country, 2023 to 2033

Figure 145: Oceania Value (US$ million) by Product Type, 2023 to 2033

Figure 146: Oceania Value (US$ million) by Application, 2023 to 2033

Figure 147: Oceania Value (US$ million) by Type, 2023 to 2033

Figure 148: Oceania Value (US$ million) by Country, 2023 to 2033

Figure 149: Oceania Value (US$ million) Analysis by Country, 2018 to 2033

Figure 150: Oceania Volume (MT) Analysis by Country, 2018 to 2033

Figure 151: Oceania Value Share (%) and BPS Analysis by Country, 2023 to 2033

Figure 152: Oceania Y-o-Y Growth (%) Projections by Country, 2023 to 2033

Figure 153: Oceania Value (US$ million) Analysis by Product Type, 2018 to 2033

Figure 154: Oceania Volume (MT) Analysis by Product Type, 2018 to 2033

Figure 155: Oceania Value Share (%) and BPS Analysis by Product Type, 2023 to 2033

Figure 156: Oceania Y-o-Y Growth (%) Projections by Product Type, 2023 to 2033

Figure 157: Oceania Value (US$ million) Analysis by Application, 2018 to 2033

Figure 158: Oceania Volume (MT) Analysis by Application, 2018 to 2033

Figure 159: Oceania Value Share (%) and BPS Analysis by Application, 2023 to 2033

Figure 160: Oceania Y-o-Y Growth (%) Projections by Application, 2023 to 2033

Figure 161: Oceania Value (US$ million) Analysis by Type, 2018 to 2033

Figure 162: Oceania Volume (MT) Analysis by Type, 2018 to 2033

Figure 163: Oceania Value Share (%) and BPS Analysis by Type, 2023 to 2033

Figure 164: Oceania Y-o-Y Growth (%) Projections by Type, 2023 to 2033

Figure 165: Oceania Attractiveness by Product Type, 2023 to 2033

Figure 166: Oceania Attractiveness by Application, 2023 to 2033

Figure 167: Oceania Attractiveness by Type, 2023 to 2033

Figure 168: Oceania Attractiveness by Country, 2023 to 2033

Figure 169: MEA Value (US$ million) by Product Type, 2023 to 2033

Figure 170: MEA Value (US$ million) by Application, 2023 to 2033

Figure 171: MEA Value (US$ million) by Type, 2023 to 2033

Figure 172: MEA Value (US$ million) by Country, 2023 to 2033

Figure 173: MEA Value (US$ million) Analysis by Country, 2018 to 2033

Figure 174: MEA Volume (MT) Analysis by Country, 2018 to 2033

Figure 175: MEA Value Share (%) and BPS Analysis by Country, 2023 to 2033

Figure 176: MEA Y-o-Y Growth (%) Projections by Country, 2023 to 2033

Figure 177: MEA Value (US$ million) Analysis by Product Type, 2018 to 2033

Figure 178: MEA Volume (MT) Analysis by Product Type, 2018 to 2033

Figure 179: MEA Value Share (%) and BPS Analysis by Product Type, 2023 to 2033

Figure 180: MEA Y-o-Y Growth (%) Projections by Product Type, 2023 to 2033

Figure 181: MEA Value (US$ million) Analysis by Application, 2018 to 2033

Figure 182: MEA Volume (MT) Analysis by Application, 2018 to 2033

Figure 183: MEA Value Share (%) and BPS Analysis by Application, 2023 to 2033

Figure 184: MEA Y-o-Y Growth (%) Projections by Application, 2023 to 2033

Figure 185: MEA Value (US$ million) Analysis by Type, 2018 to 2033

Figure 186: MEA Volume (MT) Analysis by Type, 2018 to 2033

Figure 187: MEA Value Share (%) and BPS Analysis by Type, 2023 to 2033

Figure 188: MEA Y-o-Y Growth (%) Projections by Type, 2023 to 2033

Figure 189: MEA Attractiveness by Product Type, 2023 to 2033

Figure 190: MEA Attractiveness by Application, 2023 to 2033

Figure 191: MEA Attractiveness by Type, 2023 to 2033

Figure 192: MEA Attractiveness by Country, 2023 to 2033

Explore Process Automation Insights

View Reports

Pub Cellar Equipment Market