

- Market Size (2026)
- USD 152.4 Mn
- Forecast (2036)
- USD 272.7 Mn
- CAGR (2026 to 2036)
- 6.0%
Quick-Change Cabin Class Divider Systems Market Outlook for 2026 to 2036
Quick-change cabin class divider systems market was valued at USD 144.0 million in 2025 and is projected to reach USD 152.4 million in 2026. It is forecast to reach USD 272.7 million by 2036 at 6.0% CAGR. Movable class dividers are projected to lead system type demand with 46.0% share. Retrofit kits are expected to hold 49.0% share of sales channel demand in 2026.
Airlines need flexible cabins because premium demand changes by route and season. In July 2025, J&C Aero stated that movable class dividers will be supplied for 110 Scandinavian Airlines aircraft. That makes quick-change dividers a practical tool for adjusting business-class capacity across short-haul fleets. Retrofit value also depends on certification support.
In January 2025, ABC International stated that its A320 movable class divider comes with an EASA approved Service Bulletin. The same package includes CMM, ICA and Form One documents. That helps lessors and MRO providers handle cabin changes with fewer approval delays. Safety rules keep product design tightly controlled. In May 2026, eCFR stated that Type A and Type B exit passageways must stay unobstructed and at least 36 inches wide. Divider suppliers need designs that move fast during cabin setup and still protect evacuation access after every layout change.
Summary of the Quick-Change Cabin Class Divider Systems Market
- Demand and Growth Drivers
- Airlines are using movable dividers to adjust premium and economy seating before route schedules close.
- Narrow-body adoption is rising as short-haul aircraft need flexible cabin boundaries across different flight timings.
- Business economy boundary systems are gaining use because airlines need visible separation without heavy monuments.
- Retrofit kit demand is increasing as divider upgrades fit naturally into scheduled cabin modification work.
- Product and Segment View
- Movable class dividers are projected to account for 46.0% share in 2026 as carriers need cabin zoning without heavy monuments.
- Composite panels are forecast to account for 41.0% share in 2026 as weight control remains central to cabin hardware choices.
- Curtain rail kits are expected to hold 23.0% share in 2026 as some carriers prefer lower cost separation systems.
- Divider movement depends on aircraft curtains and certified rail hardware.
- Geography and Competitive Outlook
- India is expected to record 7.4% CAGR through 2036 as fleet growth raises demand for flexible cabin layouts.
- China is projected at 6.8% CAGR through 2036 as domestic airline growth and local interior supply programs support adoption.
- Companies such as Safran Cabin and Diehl Aviation shape the certified divider supply base, and Bucher and DEMGY EIS focus on specialist cabin hardware.
- J&C Aero and FACC gain visibility in retrofit programs where fast installation and airline branding matter.
- Analyst Opinion
- Nikhil Kaitwade, Principal Consultant at FMI says, “The opportunity in quick-change cabin class divider systems is not in large monuments. Profitability is predicted to come from small, certified assemblies that help airlines change fare mix without grounding aircraft for long periods. Suppliers are likely to gain share when they prove low weight, simple crew handling and repeatable certification support across Airbus and Boeing narrow-body cabins.”
- Quick-Change Cabin Class Divider Systems Market Value Analysis
- Airlines are moving from simple curtain separation toward certified divider kits that can be repositioned before flight.
- Premium fare management is the main revenue reason as airlines adjust class boundaries by daypart and route.
- Certification cost remains the main barrier because divider movement changes loads and cabin safety checks.
- Industrial value is concentrated in movable rails and installation documentation.
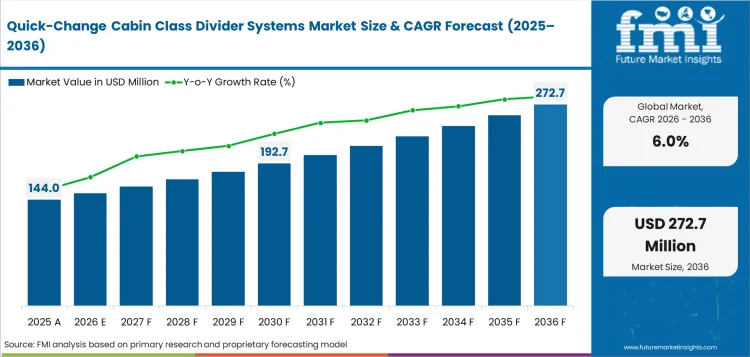
Key Takeaways, Market Size, and Forecast
- The quick-change cabin class divider systems market was valued at USD 144.0 million in 2025.
- By 2036, the quick-change cabin class divider systems market is expected to be worth USD 272.7 million.
- From 2026 to 2036, the market is projected to expand at 6.0% CAGR.
- The market is projected to create an incremental opportunity of USD 120.3 million between 2026 and 2036.
- Movable class dividers are projected to account for 46.0% share of system type demand in 2026.
- Retrofit kits are expected to account for 49.0% share of sales channel demand in 2026.
- India at 7.4% CAGR and China at 6.8% CAGR are anticipated to record stable demand through 2036.
Quick-Change Cabin Class Divider Systems Market Definition
The quick-change cabin class divider systems market covers movable partitions, fixed divider interfaces, curtain rail kits, locking hardware, and certified trim parts used to separate passenger service classes. Scope includes dividers placed between business class, premium economy, economy, crew service zones, and galley approach areas. The market excludes permanent bulkheads, lavatory monuments, full seat products, and decorative curtains sold without aircraft-certified movement hardware.
Quick-Change Cabin Class Divider Systems Market Inclusions
Market scope includes divider panels, curtain carriers, track assemblies, latch sets, placard frames, and trim kits used inside aircraft cabin interiors. Aircraft type includes narrow-body aircraft, wide-body aircraft, and regional jets. Sales channel includes retrofit kits, line-fit supply, and spares orders. The market includes approved engineering packages when they are sold with divider hardware or tied to a certified installation kit.
Quick-Change Cabin Class Divider Systems Market Exclusions
Scope does not include full cabin monuments, lavatories, galleys, seats, in-flight entertainment units, or floor structure. General cabin curtains are excluded unless sold as part of a quick-change class divider system. Revenue from aircraft painting, branding work, and full cabin design consulting is excluded unless divider hardware is separately identified.
Quick-Change Cabin Class Divider Systems Market Research Methodology
- Primary Research: FMI analysts reviewed airline retrofit needs, cabin integrator feedback, aircraft interior supplier portfolios, and certification needs for movable divider hardware.
- Desk Research: The study used public data from aviation agencies, airline traffic bodies, aircraft manufacturers, and official company technical releases.
- Market sizing and forecasting: Market size was estimated through a hybrid bottom-up and top-down method. Retrofit volume, component price, aircraft type mix, and cabin boundary use were tested against aircraft maintenance, repair, and overhaul activity.
- Data validation: Forecast checks compared airline passenger traffic, aircraft delivery backlogs, cabin retrofit signals, and supplier product fit for movable divider systems.
Why is the Quick-Change Cabin Class Divider Systems Market Growing?
- Airlines are changing class boundaries more often as premium seats and flexible fare products shape route revenue.
- Narrow-body cabin refresh programs are using movable dividers to protect business class service space without heavy cabin monuments.
- Certified retrofit kits are expanding as carriers bundle divider changes with seating and soft interior refresh work.
Passenger traffic growth is raising the need for cabin layouts that can respond to route yield. The International Air Transport Association reported that full-year passenger demand rose 5.3% in 2025. That traffic level increases pressure on airlines to sell premium zones on routes that can support them. Divider systems give cabin planners a lower cost tool than full monument replacement.
Fleet delivery cycles support line-fit and retrofit demand at the same time. Airbus reported 793 commercial aircraft deliveries in 2025 and an aircraft backlog of 8,754 units. Delivery pressure makes factory-installed divider interfaces important for new cabins. Retrofit demand stays active as airlines adjust aircraft interiors before the next delivery slot is available. Interior work often focus on aircraft interior lighting and seat boundary design during the same shop visit.
Market Segmentation Analysis
- Movable class dividers are projected to reach 46.0% share in 2026 as quick boundary changes support route-level cabin control.
- Narrow-body aircraft are expected to represent 58.0% share in 2026 as single-aisle fleets carry frequent short-haul schedule changes.
- Composite panels are forecast to account for 41.0% share in 2026 due to weight limits and repeated handling needs.
- Retrofit kits are projected to capture 49.0% share in 2026 as airlines prefer scheduled installation during cabin checks.
- Business economy boundary systems are estimated to account for 52.0% share in 2026 as mixed-cabin layouts need visible separation.
The market is divided into five primary segment groups based on system type, aircraft type, material, sales channel, and cabin boundary. System type covers movable class dividers, fixed partitions, and curtain rail kits. Material covers composite panels, textile assemblies, and aluminum frames. Sales channel shows whether suppliers sell divider hardware through line-fit programs, retrofit kits, or spares orders.
Insights into the Movable Class Dividers System Type Segment
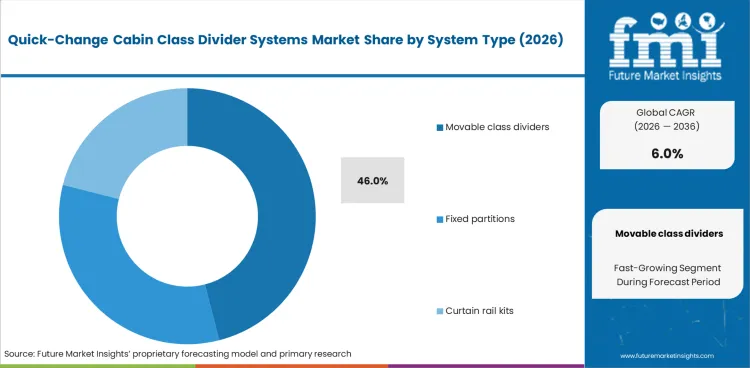
- Movable class dividers are projected to account for 46.0% share of system type demand in 2026, as airlines prefer flexible boundary solutions without altering cabin monument layouts.
- Certified solutions from DEMGY EIS allow crew-operated repositioning through quick fastening interfaces, supporting dynamic adjustment of business class rows across routes.
Insights into the Narrow-Body Aircraft Type Segment
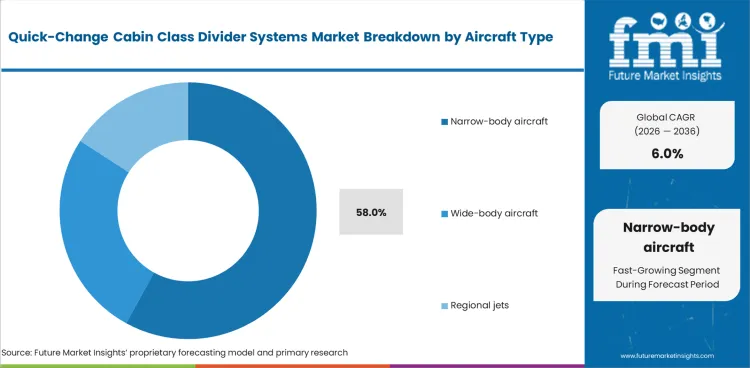
- Narrow-body aircraft are expected to represent 58.0% share of demand in 2026, driven by their extensive use on routes where business class size varies with season and passenger mix.
- Divider systems for Airbus A320 and Boeing 737 families gain traction due to high fleet usage, with retrofit planning linked to floor and sidewall interface compatibility.
Insights into the Composite Panels Material Segment
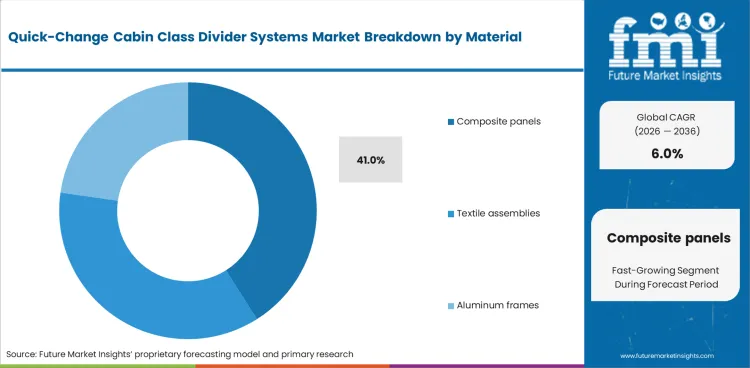
- Composite panels are forecast to hold 41.0% share of material demand in 2026, supported by the need for lightweight and durable cabin hardware.
- These materials provide stability and secure attachment points, aligning with aviation requirements for repeated crew handling and operational efficiency.
Insights into the Retrofit Kits Sales Channel Segment
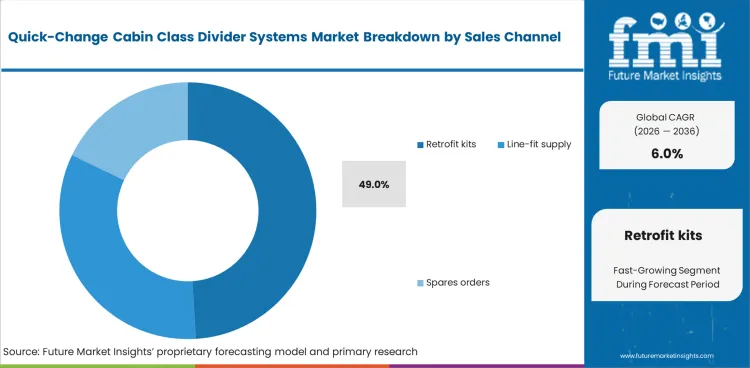
- Retrofit kits are projected to account for 49.0% share in 2026, as airlines prefer installing divider systems during scheduled cabin checks to minimize downtime.
- Value increases when kits include complete packages such as drawings and certification support, enabling faster installation and flexible cabin reconfiguration.
Insights into the Business Economy Boundary Cabin Boundary Segment
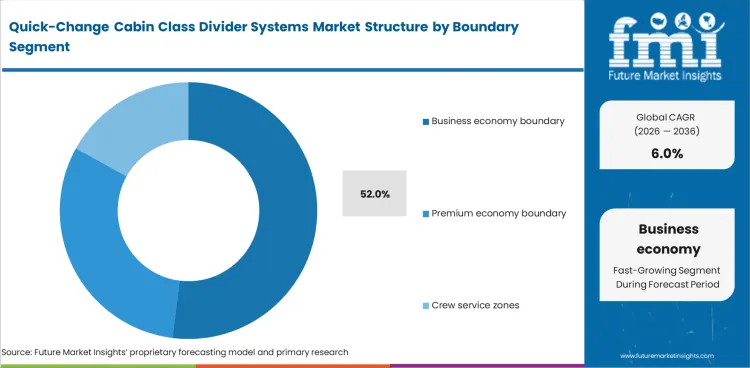
- Business economy boundary systems are estimated to capture 52.0% share in 2026, as they experience the highest frequency of layout changes on narrow-body aircraft serving mixed routes.
- Divider design must ensure clear passenger flow and protect premium service zones, often requiring coordination with seat positioning and actuation systems.
Quick-Change Cabin Class Divider Systems Market Drivers, Restraints, and Opportunities
.webp "Top Country Growth Comparison Quick Change Cabin Class Divider Systems Market Cagr (2026 2036)")
- Premium fare zoning raises demand for dividers that let airlines change cabin boundaries by route.
- Certification and attachment testing slow supplier entry since movable panels must meet cabin safety rules.
- Retrofit kit bundling creates opportunity as divider work can be sold with seats and placards.
Flexible cabin zoning is one the primary driver for quick-change divider systems adoption. The International Air Transport Association forecast 4.9% passenger traffic growth for 2026. This growth creates more pressure to match cabin space with route demand. Airlines can use movable dividers to resize business or premium zones without a full cabin rebuild.
A significant restraint is the approval burden for movable interior hardware. Divider systems must meet load and emergency access rules before they can enter airline service. Suppliers also need aircraft-specific drawings and service instructions. This increases upfront cost for small fleets and slows low-volume retrofit orders.
The strongest opportunity is present in retrofit kits that combine divider panels and certified hardware. Airlines can integrate these kits with aircraft refurbishing programs when seats and service branding change, while proximity to galley systems makes proper placement and installation planning critical for efficient operations.
Analysis of Quick-Change Cabin Class Divider Systems Market by Key Countries
| Country | CAGR |
|---|---|
| United States | 5.8% |
| China | 6.8% |
| India | 7.4% |
| Germany | 5.6% |
| United Kingdom | 5.4% |
| United Arab Emirates | 6.6% |
| Singapore | 6.3% |
Source: Future Market Insights, 2026.
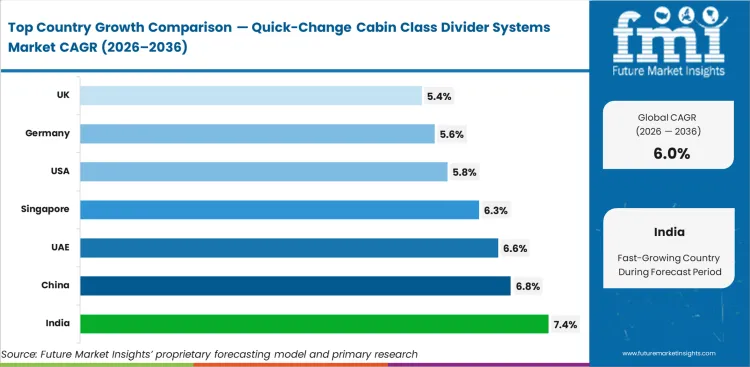
Quick-Change Cabin Class Divider Systems Market CAGR Analysis by Country
- India is projected to record 7.4% CAGR by 2036 as fleet expansion and airport capacity raise cabin retrofit needs.
- China is expected to expand at 6.8% CAGR by 2036 as domestic routes and local cabin supply capacity widen.
- The United Arab Emirates is forecast to grow at 6.6% CAGR by 2036 as long-haul hubs refresh premium cabins.
- Singapore is expected to advance at 6.3% CAGR by 2036 as maintenance hub depth and airline retrofit activity support demand.
- The United States, Germany, and the United Kingdom remain large markets with mature fleets and steady retrofit cycles.
Demand for quick-change cabin class divider systems is forecast to rise at 6.0% CAGR from 2026 to 2036. Country-level analysis covers major markets where airline fleet size, passenger traffic, maintenance capacity, and interior supplier presence support divider system use.
Demand Outlook for Quick-Change Cabin Class Divider Systems Market in the United States
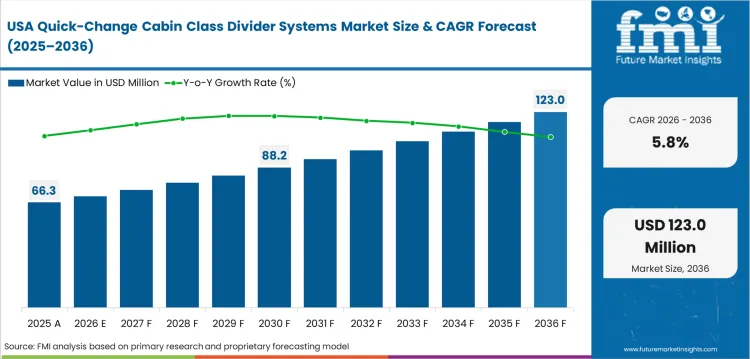
United States demand is projected to record a 5.8% CAGR through 2036 as mature fleets continue cabin refresh work. The Federal Aviation Administration forecast the United States commercial fleet to grow from 7,387 aircraft in 2024 to 10,607 aircraft in 2045. Fleet size gives interior suppliers a broad retrofit base for divider kits and spares. United States airlines are likely to keep using dividers where route yield justifies flexible premium separation.
- Major domestic networks create repeated need for cabin layout changes across business-heavy and leisure-heavy routes.
- Large maintenance providers can install divider kits during planned checks and reduce aircraft time out of service.
- Certification expectations favor suppliers with proven drawings for Airbus and Boeing narrow-body aircraft.
Sales Analysis of Quick-Change Cabin Class Divider Systems Market in China
China is expected to expand at 6.8% CAGR through 2036 as fleet growth and local cabin sourcing move together. The Civil Aviation Administration of China reported 4,574 commercial aircraft by the end of 2025. Domestic airlines need repeatable interior systems for large single-aisle fleets and growing regional routes. Divider suppliers can gain orders by supporting local approval work and cabin branding needs.
- Airbus A320 and Boeing 737 family fleets create a large fitment pool for movable class dividers.
- Domestic cabin suppliers can support quicker repair and replacement of rails and trim parts.
- Growing route density raises the need to vary business class seat blocks by city pair.
Demand Outlook for Quick-Change Cabin Class Divider Systems Market in India
India is forecast to grow at 7.4% CAGR during the forecast period as airline capacity and airport traffic rise together. India’s Press Information Bureau stated that Indian airports handled 412 million passengers in fiscal year 2025. Passenger growth pushes airlines to refine fare classes on dense domestic and international routes. Divider systems fit this need when carriers add premium economy or flexible business zones.
- Large aircraft orders increase the future line-fit pool for divider interfaces and class boundary hardware.
- Domestic maintenance and overhaul growth can support divider retrofit work during scheduled cabin checks.
- Price-sensitive airlines will prefer lightweight kits that avoid long downtime and major cabin rebuilds.
Opportunity Analysis of Quick-Change Cabin Class Divider Systems Market in Germany
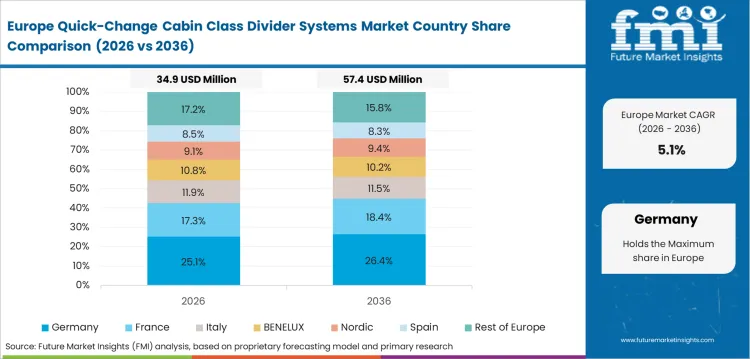
Germany is expected to advance at 5.6% CAGR through 2036 as aviation engineering and interior supply remain strong. DFS Deutsche Flugsicherung reported 3.071 million aircraft movements in German airspace during 2025. High movement volumes support ongoing maintenance cycles and cabin part replacement. Aerospace interior suppliers in Germany help carriers address certification and light cabin structures.
- Hamburg-area cabin engineering gives divider suppliers access to Airbus-linked knowledge and interior test capability.
- German airlines usually favor certified parts with clear weight data and long service documentation.
- Specialist fabric and trim suppliers can serve curtain-frame systems tied to movable dividers.
Future Outlook for Quick-Change Cabin Class Divider Systems Market in the United Kingdom
The United Kingdom is projected to rise at 5.4% CAGR through 2036 as passenger volumes recover and retrofit work continues. The United Kingdom Civil Aviation Authority reported 302 million airport passengers in 2025. That traffic level supports cabin refresh programs for airlines that serve mixed business and leisure demand.
- London route density creates use cases for business economy boundary changes on short-haul aircraft.
- United Kingdom design houses support airline branding work that can include divider trim and curtains.
- Mature fleets keep spares and replacement divider hardware relevant across narrow-body operations.
Sales Analysis of Quick-Change Cabin Class Divider Systems Market in the United Arab Emirates
The United Arab Emirates is forecast at 6.6% CAGR by 2036 as global hub airlines keep premium cabins visible. Emirates News Agency reported that United Arab Emirates airports welcomed 75.4 million passengers in the first half of 2025. High passenger flow through hub airports raises pressure on cabin layout and brand presentation. Divider systems support premium service boundaries without changing full cabin monuments.
- Long-haul hub operations create demand for visible class separation and durable service zone hardware.
- Premium cabin refresh cycles support dividers that match seating and soft trim programs.
- Local maintenance capacity can shorten turnaround when divider kits are installed during cabin checks.
Future Outlook for Quick-Change Cabin Class Divider Systems Market in Singapore
Singapore is expected to post 6.3% CAGR over the forecast period as its maintenance hub role supports regional cabin retrofit work. The Civil Aviation Authority of Singapore stated that the Singapore air hub handled close to 70 million passengers in 2025. This supports airline and maintenance activity tied to cabin repair and layout updates. Divider suppliers can use Singapore as a service point for Southeast Asian fleets.
- Changi-linked airline activity creates repeat demand for spares and small cabin hardware replacements.
- Maintenance providers can bundle divider work with seat and curtain refresh packages.
- Regional carriers need class dividers that can handle high aircraft use and short turnaround windows.
Competitive Landscape and Strategic Positioning
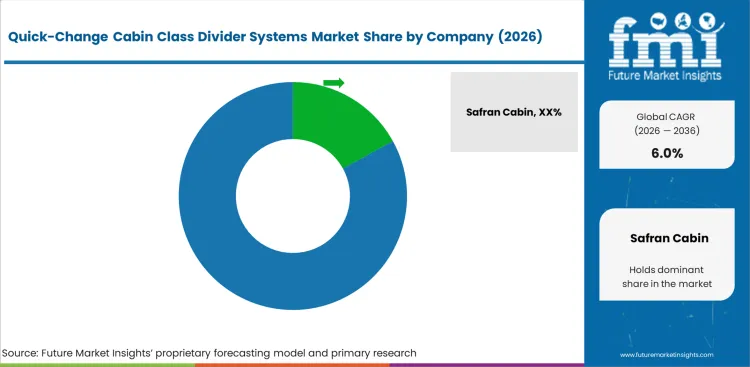
- The market is moderately concentrated around suppliers with aircraft interior certification and retrofit documentation depth.
- Leading suppliers hold an edge through Airbus and Boeing platform coverage for narrow-body cabin dividers.
- Specialist firms compete by offering lighter hardware and airline-specific trim options.
- Entry barriers include flame testing and aircraft-specific drawings.
Certified cabin know-how is the main competitive filter in this market. Safran Cabin lists movable class dividers within its ECOS partition range and serves major aircraft platforms. This product fit gives the company an advantage where airlines need repeat support across fleets.
Specialist suppliers stand out through fast retrofit handling and flexible cabin layout support. Bucher promotes customizable class dividers built for premium cabins and maintenance. DEMGY EIS offers fixed and movable cabin class dividers for A320neo and Embraer E2 aircraft. These product lines show how the market rewards aircraft-specific fit over generic partition design.
Large cabin integrators gain from wider interior programs that include seats and lighting. Collins Aerospace demonstrated seating modification and upgrade concepts at Aircraft Interiors Expo in April 2025. FACC was selected by Embraer in February 2026 to develop and manufacture new cabin components for Praetor aircraft. Suppliers with broad cabin access can attach divider work to wider upgrade packages.
Barriers remain high for firms without cabin certification knowledge. Movable divider systems must be light/safe, and easy for crew to handle. They must also avoid interference with seats and service equipment. Winning suppliers will provide proof of fit and installation support before airlines approve repeat kits.
Key Companies in the Quick-Change Cabin Class Divider Systems Market
Competition is best read by role because platform coverage and hardware specialization differ across suppliers.
- Global cabin system suppliers: Safran Cabin and Diehl Aviation hold strong positions through certified partition systems and long airline relationships.
- Specialist divider and monument suppliers: Bucher Leichtbau and DEMGY EIS compete with their aircraft-specific divider products and lighter cabin hardware.
- Retrofit and custom cabin participants: J&C Aero focuses on cabin interior design and movable divider concepts for flexible layouts.
Competitive Benchmarking: Quick-Change Cabin Class Divider Systems Market
| Company | Aircraft Platform Fit | Quick-Change Hardware Depth | Retrofit Certification Support | Geographic Footprint |
|---|---|---|---|---|
| Safran Cabin | High | Strong | Strong | Global with Airbus and Boeing cabin portfolio depth |
| Diehl Aviation | High | Strong | Strong | Europe centered with global aircraft interior supply |
| Bucher Leichtbau | High | Medium | Strong | Europe centered with premium cabin and monument depth |
| DEMGY EIS | High | Medium | Strong | Europe centered with divider and composite cabin hardware |
| J&C Aero | Medium | Strong | Medium | Europe centered with airline retrofit project access |
| Collins Aerospace | Medium | Strong | Strong | Global with seating and cabin systems coverage |
| FACC | Medium | Medium | Strong | Europe centered with aircraft interior component production |
| Jamco Corporation | Low | Medium | Medium | Japan and global cabin interior service footprint |
Source: Future Market Insights competitive analysis, 2026. Ratings reflect relative positioning based on aircraft platform fit, quick-change hardware depth, and retrofit certification support.
Key Developments in Quick-Change Cabin Class Divider Systems Market
- In February 2026, FACC was selected by Embraer to develop and manufacture new cabin components for Praetor aircraft. The contract reinforces specialist interior component demand.
- In January 2026, Jamco announced the acquisition of Schüschke. The deal expanded its cabin interiors platform and strengthened monument-related capability.
- In April 2026, Safran Cabin signed a galleys and stowages agreement with flyadeal for Airbus A330neo aircraft. Wide cabin programs can support adjacent divider supply.
Key Players in the Quick-Change Cabin Class Divider Systems Market
Major Global Players:
- Safran Cabin
- Diehl Aviation
- Collins Aerospace
- FACC
Specialist and Regional Players:
- Bucher Leichtbau
- DEMGY EIS
- J&C Aero
- Jamco Corporation
Report Scope and Coverage
| Parameter | Details |
|---|---|
| Quantitative Units | USD 152.4 million to USD 272.7 million, at 6.0% CAGR |
| Market Definition | Movable and fixed cabin divider systems used to separate passenger service classes inside aircraft |
| System Type | Movable class dividers, Fixed partitions, Curtain rail kits |
| Aircraft Type | Narrow-body aircraft, Wide-body aircraft, Regional jets |
| Material | Composite panels, Textile assemblies, Aluminum frames |
| Sales Channel | Retrofit kits, Line-fit supply, Spares orders |
| Cabin Boundary | Business economy boundary, Premium economy boundary, Crew service zones |
| Regions Covered | North America, Latin America, Western Europe, Eastern Europe, East Asia, South Asia and Pacific, Middle East and Africa |
| Countries Covered | United States, China, India, Germany, United Kingdom, United Arab Emirates, Singapore, and 30+ countries |
| Key Companies Profiled | Safran Cabin, Diehl Aviation, Bucher Leichtbau, DEMGY EIS, J&C Aero, Collins Aerospace, FACC, Jamco Corporation |
| Forecast Period | 2026 to 2036 |
| Approach | Hybrid bottom-up and top-down method using cabin retrofit activity, aircraft traffic data, supplier product evidence, and aircraft delivery signals |
| Adjacent Systems Reviewed | Lightweight high strength passenger window systems and aircraft structural health monitoring access panels were reviewed for cabin material adjacency |
Source: Future Market Insights, 2026.
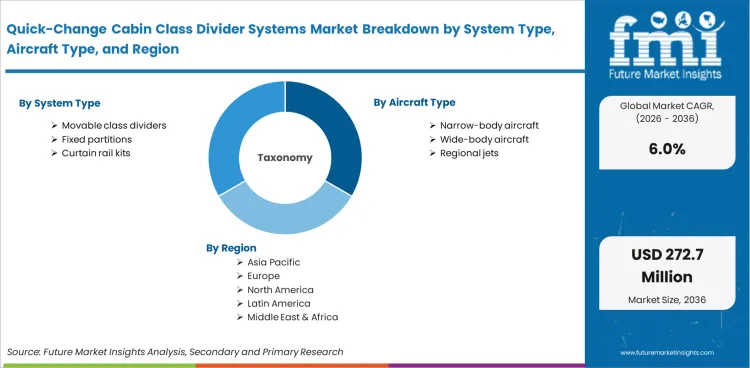
Quick-Change Cabin Class Divider Systems Market Breakdown By System Type, Aircraft Type, Material, Sales Channel, Cabin Boundary, and Region
By System Type:
- Movable class dividers
- Fixed partitions
- Curtain rail kits
By Aircraft Type:
- Narrow-body aircraft
- Wide-body aircraft
- Regional jets
By Material:
- Composite panels
- Textile assemblies
- Aluminum frames
By Sales Channel:
- Retrofit kits
- Line-fit supply
- Spares orders
By Cabin Boundary:
- Business economy boundary
- Premium economy boundary
- Crew service zones
By Region:
- North America
- Latin America
- Western Europe
- Eastern Europe
- East Asia
- South Asia and Pacific
- Middle East and Africa
The adjacent cabin review included aerospace interior signals for cabin trim and retrofit scope. Aircraft textile signals were used for curtains and divider edge materials. Aerospace composite material signals were checked for material adjacency.
Research Sources and Bibliography
- Airbus. (2026, January 12). Airbus reports 793 commercial aircraft deliveries in 2025.
- Boeing. (2025). Commercial Market Outlook 2025 to 2044.
- Bucher Leichtbau AG. (2025, March 26). Aircraft Interiors Expo 2025.
- Civil Aviation Administration of China. (2026, April 22). Statistical bulletin of civil aviation industry development in 2025.
- Civil Aviation Authority of Singapore. (2026, January 29). Singapore air hub passenger traffic reaches close to 70 million passengers in 2025.
- Collins Aerospace. (2025, April 8). Collins Aerospace demonstrates seating modification and upgrade concepts at AIX 2025.
- DFS Deutsche Flugsicherung. (2026, May 1). Air traffic in Germany 2025.
- Emirates News Agency. (2025, August 13). UAE airports welcome 75.4 million passengers in first half of 2025.
- FACC AG. (2026, February 27). FACC develops and manufactures new cabin components for Embraer Praetor aircraft.
- Federal Aviation Administration. (2025, June). FAA aerospace forecast fiscal years 2025 to 2045.
- International Air Transport Association. (2025, December 9). Global outlook for air transport in 2026.
- International Air Transport Association. (2026, January 29). Strong 2025 passenger demand masks ongoing capacity constraints.
- Jamco Corporation. (2026, January 19). Jamco announces acquisition of Schüschke.
- Press Information Bureau of India. (2026, January 29). Civil aviation infrastructure and passenger traffic
- Safran Group. (2026, April 15). flyadeal selects Safran Cabin for Airbus A330neo galleys and stowages.
- United Kingdom Civil Aviation Authority. (2026, February 24). UK aviation breaks records with over 300 million passenger journeys in 2025.
This Report Answers
- ✓ What is the current and forecast value of the quick-change cabin class divider systems market?
- ✓ Which system type is expected to hold the leading share in 2026?
- ✓ Which aircraft type creates the strongest near-term demand for divider kits?
- ✓ How do retrofit kits compare with line-fit supply in the sales channel mix?
- ✓ Which countries show the stronger CAGR outlook during the forecast period?
- ✓ Which suppliers have the strongest aircraft platform fit and retrofit certification support?
- ✓ How do passenger traffic, fleet delivery, and cabin refresh activity support the market outlook?
Preview the report firsthand - request a free sample
Get SampleGet the brochure for pricing and purchase details.
Get PDFTable of Content
- Key Takeaways
- Market Size and CAGR
- Top Growth Driver
- Fastest Growing Segment
- Leading Region
- Key Companies
- Emerging Opportunities
- Executive Summary
- Global Market Outlook
- Demand-side Trends
- Supply-side Trends
- Technology Roadmap Analysis
- Analysis and Recommendations
- Analyst Perspective (What is happening? Why now? What should investors know?)
- Key Questions Answered
- How large is the market?
- What is the CAGR?
- What are key trends?
- Which region dominates?
- Who are the leaders?
- Market Overview
- Market Coverage / Taxonomy
- Market Definition / Scope / Limitations
- Research Methodology
- Chapter Orientation
- Analytical Lens and Working Hypotheses
- Market Structure, Signals, and Trend Drivers
- Benchmarking and Cross-market Comparability
- Market Sizing, Forecasting, and Opportunity Mapping
- Research Design and Evidence Framework
- Desk Research Programme (Secondary Evidence)
- Expert Input and Fieldwork (Primary Evidence)
- Tooling, Models, and Reference Databases
- Data Engineering and Model Build
- Quality Assurance and Audit Trail
- Market Background
- Market Dynamics (Drivers, Restraints, Opportunity, Trends)
- Scenario Forecast (Optimistic, Likely, Conservative)
- Impact Analysis
- AI Impact
- Sustainability Impact
- Regulatory Impact
- Technology Impact
- Consumer / Buyer Analysis
- Purchase Drivers
- Adoption Barriers
- Buyer Journey
- Opportunity Map Analysis
- Product Life Cycle Analysis
- Supply Chain Analysis
- Investment Feasibility Matrix
- Value Chain Analysis
- PESTLE and Porter's Analysis
- Regulatory Landscape
- Regional Parent Market Outlook
- Production and Consumption Statistics
- Import and Export Statistics
- Global Market Analysis and Forecast, 2021 to 2036
- Historical Market Size Value (USD Million) & Volume (Unit) Analysis, 2021 to 2025
- Current and Future Market Size Value (USD Million) & Volume (Unit) Projections, 2026 to 2036
- Y-o-Y Growth Trend Analysis
- Absolute $ Opportunity Analysis
- Global Market Pricing Analysis, 2021 to 2036
- Global Market Analysis and Forecast, By System Type, 2021 to 2036
- Introduction / Key Findings
- Historical Market Size Value (USD Million) & Volume (Unit) Analysis By System Type, 2021 to 2025
- Current and Future Market Size Value (USD Million) & Volume (Unit) Analysis and Forecast By System Type, 2026 to 2036
- Movable class dividers
- Fixed partitions
- Curtain rail kits
- Movable class dividers
- Y-o-Y Growth Trend Analysis By System Type, 2021 to 2025
- Absolute $ Opportunity Analysis By System Type, 2026 to 2036
- Global Market Analysis and Forecast, By Aircraft Type, 2021 to 2036
- Introduction / Key Findings
- Historical Market Size Value (USD Million) & Volume (Unit) Analysis By Aircraft Type, 2021 to 2025
- Current and Future Market Size Value (USD Million) & Volume (Unit) Analysis and Forecast By Aircraft Type, 2026 to 2036
- Narrow-body aircraft
- Wide-body aircraft
- Regional jets
- Narrow-body aircraft
- Y-o-Y Growth Trend Analysis By Aircraft Type, 2021 to 2025
- Absolute $ Opportunity Analysis By Aircraft Type, 2026 to 2036
- Global Market Analysis and Forecast, By Material, 2021 to 2036
- Introduction / Key Findings
- Historical Market Size Value (USD Million) & Volume (Unit) Analysis By Material, 2021 to 2025
- Current and Future Market Size Value (USD Million) & Volume (Unit) Analysis and Forecast By Material, 2026 to 2036
- Composite panels
- Textile assemblies
- Aluminum frames
- Composite panels
- Y-o-Y Growth Trend Analysis By Material, 2021 to 2025
- Absolute $ Opportunity Analysis By Material, 2026 to 2036
- Global Market Analysis and Forecast, By Sales Channel, 2021 to 2036
- Introduction / Key Findings
- Historical Market Size Value (USD Million) & Volume (Unit) Analysis By Sales Channel, 2021 to 2025
- Current and Future Market Size Value (USD Million) & Volume (Unit) Analysis and Forecast By Sales Channel, 2026 to 2036
- Retrofit kits
- Line-fit supply
- Spares orders
- Retrofit kits
- Y-o-Y Growth Trend Analysis By Sales Channel, 2021 to 2025
- Absolute $ Opportunity Analysis By Sales Channel, 2026 to 2036
- Global Market Analysis and Forecast, By Cabin Boundary, 2021 to 2036
- Introduction / Key Findings
- Historical Market Size Value (USD Million) & Volume (Unit) Analysis By Cabin Boundary, 2021 to 2025
- Current and Future Market Size Value (USD Million) & Volume (Unit) Analysis and Forecast By Cabin Boundary, 2026 to 2036
- Business economy boundary
- Premium economy boundary
- Crew service zones
- Business economy boundary
- Y-o-Y Growth Trend Analysis By Cabin Boundary, 2021 to 2025
- Absolute $ Opportunity Analysis By Cabin Boundary, 2026 to 2036
- Global Market Analysis and Forecast, By Region, 2021 to 2036
- Introduction
- Historical Market Size Value (USD Million) & Volume (Unit) Analysis By Region, 2021 to 2025
- Current Market Size Value (USD Million) & Volume (Unit) Analysis and Forecast By Region, 2026 to 2036
- North America
- Latin America
- Western Europe
- Eastern Europe
- East Asia
- South Asia and Pacific
- Middle East & Africa
- Market Attractiveness Analysis By Region
- North America Market Analysis and Forecast, By Country, 2021 to 2036
- Historical Market Size Value (USD Million) & Volume (Unit) Trend Analysis By Market Taxonomy, 2021 to 2025
- Market Size Value (USD Million) & Volume (Unit) Forecast By Market Taxonomy, 2026 to 2036
- By Country
- USA
- Canada
- Mexico
- By System Type
- By Aircraft Type
- By Material
- By Sales Channel
- By Cabin Boundary
- By Country
- Market Attractiveness Analysis
- By Country
- By System Type
- By Aircraft Type
- By Material
- By Sales Channel
- By Cabin Boundary
- Key Takeaways
- Latin America Market Analysis and Forecast, By Country
- Historical Market Size Value (USD Million) & Volume (Unit) Trend Analysis By Market Taxonomy, 2021 to 2025
- Market Size Value (USD Million) & Volume (Unit) Forecast By Market Taxonomy, 2026 to 2036
- By Country
- Brazil
- Chile
- Rest of Latin America
- By System Type
- By Aircraft Type
- By Material
- By Sales Channel
- By Cabin Boundary
- By Country
- Market Attractiveness Analysis
- By Country
- By System Type
- By Aircraft Type
- By Material
- By Sales Channel
- By Cabin Boundary
- Key Takeaways
- Western Europe Market Analysis and Forecast, By Country
- Historical Market Size Value (USD Million) & Volume (Unit) Trend Analysis By Market Taxonomy, 2021 to 2025
- Market Size Value (USD Million) & Volume (Unit) Forecast By Market Taxonomy, 2026 to 2036
- By Country
- Germany
- UK
- Italy
- Spain
- France
- Nordic
- BENELUX
- Rest of Western Europe
- By System Type
- By Aircraft Type
- By Material
- By Sales Channel
- By Cabin Boundary
- By Country
- Market Attractiveness Analysis
- By Country
- By System Type
- By Aircraft Type
- By Material
- By Sales Channel
- By Cabin Boundary
- Key Takeaways
- Eastern Europe Market Analysis and Forecast, By Country
- Historical Market Size Value (USD Million) & Volume (Unit) Trend Analysis By Market Taxonomy, 2021 to 2025
- Market Size Value (USD Million) & Volume (Unit) Forecast By Market Taxonomy, 2026 to 2036
- By Country
- Russia
- Poland
- Hungary
- Balkan & Baltic
- Rest of Eastern Europe
- By System Type
- By Aircraft Type
- By Material
- By Sales Channel
- By Cabin Boundary
- By Country
- Market Attractiveness Analysis
- By Country
- By System Type
- By Aircraft Type
- By Material
- By Sales Channel
- By Cabin Boundary
- Key Takeaways
- East Asia Market Analysis and Forecast, By Country
- Historical Market Size Value (USD Million) & Volume (Unit) Trend Analysis By Market Taxonomy, 2021 to 2025
- Market Size Value (USD Million) & Volume (Unit) Forecast By Market Taxonomy, 2026 to 2036
- By Country
- China
- Japan
- South Korea
- By System Type
- By Aircraft Type
- By Material
- By Sales Channel
- By Cabin Boundary
- By Country
- Market Attractiveness Analysis
- By Country
- By System Type
- By Aircraft Type
- By Material
- By Sales Channel
- By Cabin Boundary
- Key Takeaways
- South Asia and Pacific Market Analysis and Forecast, By Country
- Historical Market Size Value (USD Million) & Volume (Unit) Trend Analysis By Market Taxonomy, 2021 to 2025
- Market Size Value (USD Million) & Volume (Unit) Forecast By Market Taxonomy, 2026 to 2036
- By Country
- India
- ASEAN
- Australia & New Zealand
- Rest of South Asia and Pacific
- By System Type
- By Aircraft Type
- By Material
- By Sales Channel
- By Cabin Boundary
- By Country
- Market Attractiveness Analysis
- By Country
- By System Type
- By Aircraft Type
- By Material
- By Sales Channel
- By Cabin Boundary
- Key Takeaways
- Middle East & Africa Market Analysis and Forecast, By Country
- Historical Market Size Value (USD Million) & Volume (Unit) Trend Analysis By Market Taxonomy, 2021 to 2025
- Market Size Value (USD Million) & Volume (Unit) Forecast By Market Taxonomy, 2026 to 2036
- By Country
- Kingdom of Saudi Arabia
- Other GCC Countries
- Türkiye
- South Africa
- Other African Union
- Rest of Middle East & Africa
- By System Type
- By Aircraft Type
- By Material
- By Sales Channel
- By Cabin Boundary
- By Country
- Market Attractiveness Analysis
- By Country
- By System Type
- By Aircraft Type
- By Material
- By Sales Channel
- By Cabin Boundary
- Key Takeaways
- Key Countries Market Analysis
- USA
- Pricing Analysis
- Market Share Analysis, 2025
- By System Type
- By Aircraft Type
- By Material
- By Sales Channel
- By Cabin Boundary
- Canada
- Pricing Analysis
- Market Share Analysis, 2025
- By System Type
- By Aircraft Type
- By Material
- By Sales Channel
- By Cabin Boundary
- Mexico
- Pricing Analysis
- Market Share Analysis, 2025
- By System Type
- By Aircraft Type
- By Material
- By Sales Channel
- By Cabin Boundary
- Brazil
- Pricing Analysis
- Market Share Analysis, 2025
- By System Type
- By Aircraft Type
- By Material
- By Sales Channel
- By Cabin Boundary
- Chile
- Pricing Analysis
- Market Share Analysis, 2025
- By System Type
- By Aircraft Type
- By Material
- By Sales Channel
- By Cabin Boundary
- Germany
- Pricing Analysis
- Market Share Analysis, 2025
- By System Type
- By Aircraft Type
- By Material
- By Sales Channel
- By Cabin Boundary
- UK
- Pricing Analysis
- Market Share Analysis, 2025
- By System Type
- By Aircraft Type
- By Material
- By Sales Channel
- By Cabin Boundary
- Italy
- Pricing Analysis
- Market Share Analysis, 2025
- By System Type
- By Aircraft Type
- By Material
- By Sales Channel
- By Cabin Boundary
- Spain
- Pricing Analysis
- Market Share Analysis, 2025
- By System Type
- By Aircraft Type
- By Material
- By Sales Channel
- By Cabin Boundary
- France
- Pricing Analysis
- Market Share Analysis, 2025
- By System Type
- By Aircraft Type
- By Material
- By Sales Channel
- By Cabin Boundary
- India
- Pricing Analysis
- Market Share Analysis, 2025
- By System Type
- By Aircraft Type
- By Material
- By Sales Channel
- By Cabin Boundary
- ASEAN
- Pricing Analysis
- Market Share Analysis, 2025
- By System Type
- By Aircraft Type
- By Material
- By Sales Channel
- By Cabin Boundary
- Australia & New Zealand
- Pricing Analysis
- Market Share Analysis, 2025
- By System Type
- By Aircraft Type
- By Material
- By Sales Channel
- By Cabin Boundary
- China
- Pricing Analysis
- Market Share Analysis, 2025
- By System Type
- By Aircraft Type
- By Material
- By Sales Channel
- By Cabin Boundary
- Japan
- Pricing Analysis
- Market Share Analysis, 2025
- By System Type
- By Aircraft Type
- By Material
- By Sales Channel
- By Cabin Boundary
- South Korea
- Pricing Analysis
- Market Share Analysis, 2025
- By System Type
- By Aircraft Type
- By Material
- By Sales Channel
- By Cabin Boundary
- Russia
- Pricing Analysis
- Market Share Analysis, 2025
- By System Type
- By Aircraft Type
- By Material
- By Sales Channel
- By Cabin Boundary
- Poland
- Pricing Analysis
- Market Share Analysis, 2025
- By System Type
- By Aircraft Type
- By Material
- By Sales Channel
- By Cabin Boundary
- Hungary
- Pricing Analysis
- Market Share Analysis, 2025
- By System Type
- By Aircraft Type
- By Material
- By Sales Channel
- By Cabin Boundary
- Kingdom of Saudi Arabia
- Pricing Analysis
- Market Share Analysis, 2025
- By System Type
- By Aircraft Type
- By Material
- By Sales Channel
- By Cabin Boundary
- Türkiye
- Pricing Analysis
- Market Share Analysis, 2025
- By System Type
- By Aircraft Type
- By Material
- By Sales Channel
- By Cabin Boundary
- South Africa
- Pricing Analysis
- Market Share Analysis, 2025
- By System Type
- By Aircraft Type
- By Material
- By Sales Channel
- By Cabin Boundary
- USA
- Market Structure Analysis
- Competition Dashboard
- Competition Benchmarking
- Market Share Analysis of Top Players
- By Regional
- By System Type
- By Aircraft Type
- By Material
- By Sales Channel
- By Cabin Boundary
- Emerging Startups
- Innovation Benchmarking
- Competition Analysis
- Competition Deep Dive
- Safran Cabin
- Overview
- Product Portfolio
- Profitability by Market Segments (Product/Region/Sales Channel)
- Sales Footprint
- Strategy Overview
- Marketing Strategy
- Product Strategy
- Channel Strategy
- Diehl Aviation
- Bucher Leichtbau
- DEMGY EIS
- J&C Aero
- Collins Aerospace
- FACC
- Jamco Corporation
- Safran Cabin
- Case Studies
- Success Stories
- Recent Developments
- Competition Deep Dive
- Assumptions & Acronyms Used


