

- Market Size (2026)
- USD 653.7 Mn
- Forecast (2036)
- USD 1262.1 Mn
- CAGR (2026 to 2036)
- 6.8%
Cabin Noise-Reduction Insulation Upgrade Kits Market Size, Market Forecast and Outlook By FMI
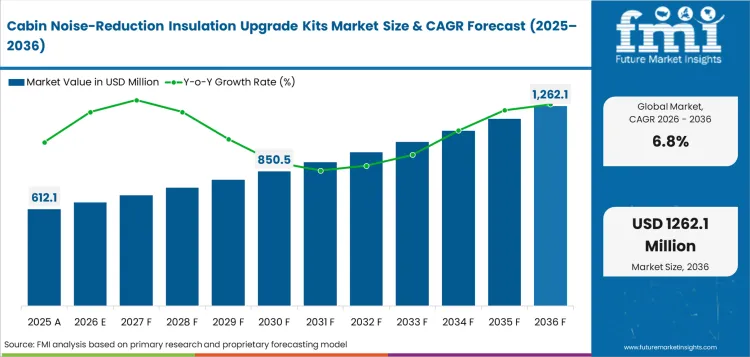
The cabin noise-reduction insulation upgrade kits market was valued at USD 612.1 million in 2025. Industry revenue is forecast to reach USD 653.7 million in 2026 and increase to USD 1,262.1 million by 2036 at 6.8% CAGR. Airlines are projected to represent 62.7% share of end user demand in 2026. MRO shops are forecast to account for 56.4% share of installation channel activity in 2026.
Summary of Cabin Noise-Reduction Insulation Upgrade Kits Market
- Demand and Growth Drivers
- Lease handovers create inspection points as operators review sidewall blankets and floor pads before aircraft return to service.
- Fleet use is rising with global passenger traffic recovery, keeping cabin panels and floor assemblies under tighter maintenance review.
- Fire performance rules raise the value of documented kit packs matching aircraft type and installed cabin zone.
- Product and Segment View
- Airlines are expected to account for 62.7% share in 2026 since fleet operators control most cabin refresh budgets.
- MRO shops are expected to capture 56.4% share in 2026 led by insulation work usually happening during scheduled maintenance visits.
- Overframe blankets are forecast to hold 41.6% share in 2026 due to sidewall and crown areas needing repeated acoustic treatment.
- Geography and Competitive Outlook
- India demand is forecast to record 8.4% CAGR by 2036, driven by fleet growth and local maintenance capacity propelling retrofit demand.
- China demand is expected to expand at 7.9% CAGR by 2036, influenced by domestic aviation scale keeping cabin renewal active.
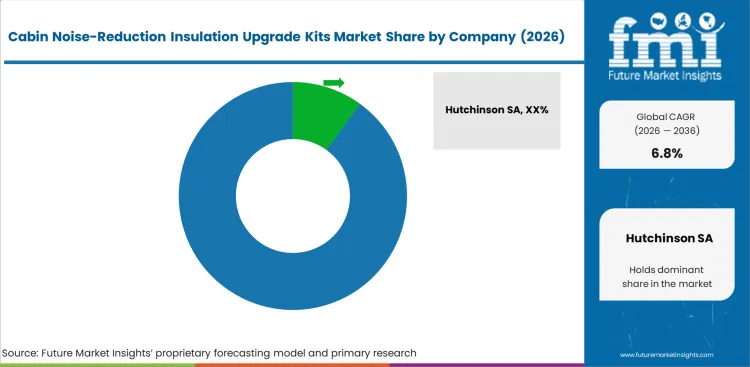
- Hutchinson SA and 3M Company anchor supplier choice through aerospace insulation systems and material qualification depth.
- Analyst Opinion
- Nikhil Kaitwade, Principal Consultant at FMI, observes, “Cabin acoustic kits have transitioned from simple material orders into certified kit solutions. Airlines today demand kits aligning perfectly with maintenance windows while meeting stringent fire certification requirements. Suppliers who deliver pre-cut acoustic blankets and zone-specific fasteners are reducing installation time and shop-floor disruptions. Efficient operators now treat acoustic upgrades as an integrated part of cabin refurbishment programs, making comfort improvements easier to justify and fund.”
- Cabin Noise-Reduction Insulation Upgrade Kits Market Value Analysis
- Market value is tied to acoustic blankets and barrier kits used behind sidewalls and floor panels.
- Supplier pricing reflects material certification and pre-cut fit before an airline approves shop-floor installation.
- Revenue rises above loose foam value as kits include barriers and aircraft zone labels.
- Premium demand comes from narrow-body refurbishments needing quick access to cabin insulation during heavy checks.
Key Takeaways, Market Size, and Forecast
- The cabin noise-reduction insulation upgrade kits market size stood at USD 612.1 million in 2025.
- Industry value is forecast to reach USD 1,262.1 million by 2036 due to cabin retrofit cycles and passenger comfort programs influencing kit replacement.
- From 2026 to 2036, the sector is projected to expand at 6.8% CAGR.
- Industry revenue is forecast to create incremental opportunity of USD 608.4 million from 2026 to 2036.
- Airlines are expected to account for 62.7% share of end user demand in 2026.
- MRO shops are expected to represent 56.4% share of installation channel activity in 2026.
- India records the stronger country outlook at a projected 8.4% CAGR, followed by China at 7.9% CAGR by 2036.
Cabin insulation kit buying depends first on approval records and then on passenger comfort. European aviation rules require replacement thermal or acoustic materials on large aircraft to meet fire performance rules. Lower fuselage insulation also needs burn through evidence on relevant aircraft types. Airline engineering teams and MRO planners therefore check documents before approving a kit. Airbus adds another check through test method requirements. Its June 2024 cross table lists radiant panel testing under AITM2-0053. It also lists burn through resistance under AITM2-0056. Suppliers with full test records and clear kit labels can reduce approval delays. Boeing’s January 2024 blanket patent shows why kit design matters. The patent uses a composite laminate as a burn through layer. Grommets pass through coverfilm and batting to help the blanket hold its shape. Kits that stay in place and protect drainage paths can reduce rework before cabin panels close. Skandia’s 2024 catalog says its soundproofing systems cover over 80 aircraft models. Model specific kits help MRO teams prepare faster aircraft zone quotations.
Cabin Noise-Reduction Insulation Upgrade Kits Market Definition
Cabin noise-reduction insulation upgrade kits cover pre-cut acoustic and thermal insulation packs used inside aircraft cabins. Scope includes overframe blankets and floor pads. Barrier sets and door seals are counted if supplied for cabin acoustic upgrades. Kit value includes fire-rated cover films and adhesive accessories supplied for cabin interior work. General airframe insulation sold outside cabin zones is excluded unless supplied as part of a cabin rework order.
Cabin Noise-Reduction Insulation Upgrade Kits Market Inclusions
Scope includes insulation kits for sidewall panels and crown areas. Floor zones and door surrounds are counted in cabin kit orders. Scope includes aerospace foam and fiberglass blankets. High performance insulation materials and technical insulation are counted if specified for cabin zones. Polymer barriers and composite acoustic pads are counted in cabin kits. Scope includes kits used during aircraft refurbishing work. Cabin reconfiguration and retrofit services are counted if materials are billed with installation. OEM insulation is counted if supplied as a retrofit kit. Installation support sold with kit packs is counted if billed with materials.
Cabin Noise-Reduction Insulation Upgrade Kits Market Exclusions
Scope excludes engine nacelle insulation and auxiliary power unit exhaust blankets. Scope excludes airport building acoustic panels and ground vehicle noise mats. Standard aircraft interior lighting and aircraft curtains are excluded unless supplied in a cabin retrofit bundle. Aircraft filters are outside scope unless packaged with cabin air-noise treatment. Standalone aviation test equipment is excluded except for acoustic verification services billed with kit installation.
Cabin Noise-Reduction Insulation Upgrade Kits Market Research Methodology
- Primary Research: FMI analysts reviewed needs from airline engineering managers, MRO planners and cabin retrofit specialists.
- Desk Research: Official passenger traffic data, fleet forecasts and active aviation safety rules supported demand checks.
- Market Sizing and Forecasting: Forecast values used aircraft maintenance repair and overhaul activity, commercial aircraft MRO, air transport MRO and acoustic kit pricing by cabin zone.
- Data Validation: Checks compared the 2026 value with the 2036 value and tested CAGR consistency across fleet growth assumptions.
Why is the Cabin Noise-Reduction Insulation Upgrade Kits Market Growing?
- Airlines are tying acoustic insulation replacement to cabin refresh work so sidewall and floor-zone upgrades can move through planned checks.
- Higher aircraft use is making worn cabin insulation easier to justify as part of comfort and maintenance planning.
- Engineering approval needs are making pre-cut acoustic kits more useful for operators planning cabin work within short maintenance windows.
Cabin acoustic kit orders are expected to rise as airlines fold noise-control work into broader interior upgrade programs. Airbus stated in October 2025, the modifications and upgrades services segment is expected to rise from USD 12.0 billion in 2025 to USD 17.0 billion by 2044. It also named complex cabin and systems upgrades as part of that same service segment, directly supporting acoustic blanket and floor-zone replacement during refurbishment cycles. Boeing’s June 2025 Commercial Market Outlook forecast passenger traffic to grow 4.2% annually and the global fleet to reach more than 49,600 commercial airplanes by 2044. Larger flying fleets create more scheduled cabin access, so airlines can replace overframe blankets and floor pads during planned interior work. Fire-performance documentation keeps supplier choice selective since kits must satisfy engineering review before installation. Suppliers with pre-cut packs and test records can turn noise reduction into a lower-risk retrofit order for maintenance repair and overhaul shops.
Market Segmentation Analysis
- Overframe blankets are forecast to capture 41.6% share in 2026, led by crown and sidewall areas driving most acoustic treatment volume.
- Narrow-body aircraft are projected to account for 47.3% share in 2026 due to frequent cabin turns and large airline fleets.
- Fiberglass is expected to represent 38.2% share in 2026 as it remains familiar for aircraft blanket packs.
- MRO shops are forecast to hold 56.4% share in 2026 since kit installation usually aligns with heavy-check work.
- Airlines are expected to account for 62.7% share in 2026, reflected by fleet owners paying for most comfort upgrades.
Segmentation is divided into five parent groups based on how cabin upgrade kits are specified and installed. Kit type separates blanket, floor and sealing formats. Aircraft type reflects cabin size and utilization profile. Material type shows the main insulation chemistry or barrier structure. Installation channel identifies the party fitting the kit during maintenance. End user shows the organization funding the upgrade decision.
Insights into Cabin Noise-Reduction Insulation Upgrade Kits Market by Kit Type
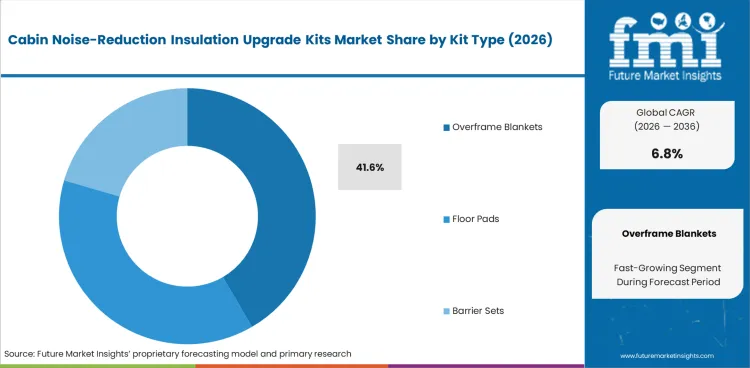
- Overframe blankets are projected to account for 41.6% share in 2026, led by fuselage sidewall and crown cavities generating the broadest repeat replacement area.
- Floor pads gain value in premium cabins since seat-track vibration and footfall sound affect perceived comfort during long flights.
Insights into Cabin Noise-Reduction Insulation Upgrade Kits Market by Aircraft Type
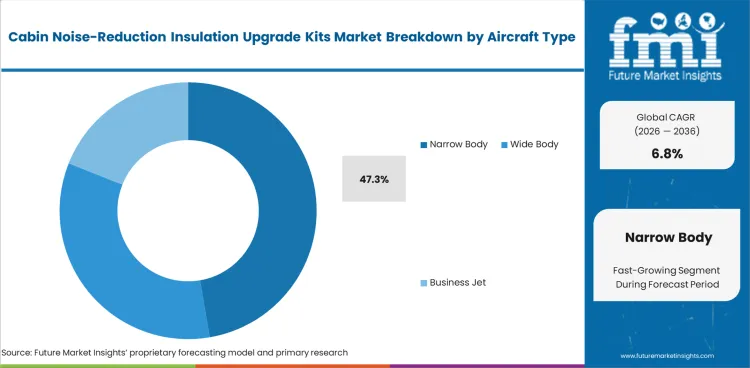
- Narrow-body aircraft are forecast to represent 47.3% share in 2026 due to high flight cycles making cabin refresh work frequent across airline fleets.
- Wide-body aircraft generate higher ticket value per kit led by cabin zones being larger and noise comfort proving important during long-haul service.
Insights into Cabin Noise-Reduction Insulation Upgrade Kits Market by Material Type
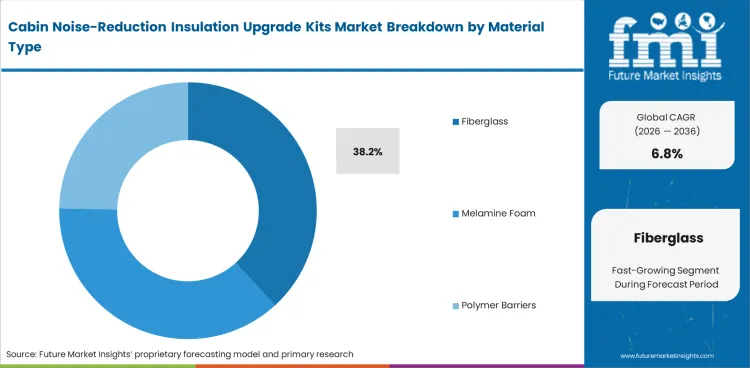
- Fiberglass is expected to account for 38.2% share in 2026 since airlines understand its fire behavior and cabin blanket use.
- Melamine foam gains attention in low-weight acoustic packs as Polymer Technologies highlights aerospace hydrophobic melamine options.
Insights into Cabin Noise-Reduction Insulation Upgrade Kits Market by Installation Channel
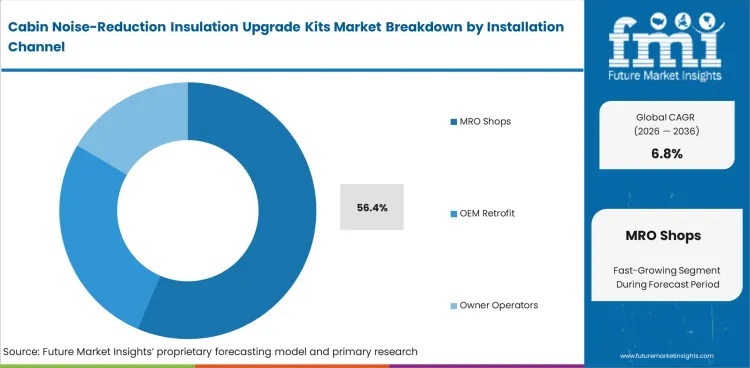
- MRO shops are projected to account for 56.4% share in 2026, driven by cabin insulation replacement integrating naturally into scheduled maintenance.
- OEM retrofit work remains important for aircraft delivered with optional cabin upgrades. Owner operators use smaller orders for business aircraft cabins and lower-volume fleet changes.
Insights into Cabin Noise-Reduction Insulation Upgrade Kits Market by End User
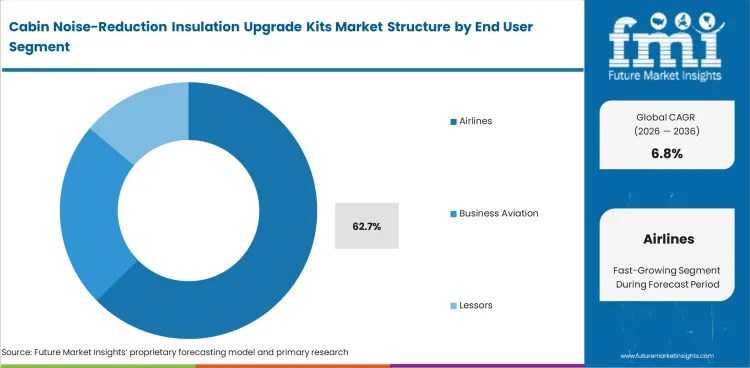
- Airlines are forecast to represent 62.7% share in 2026, reflected by controlled cabin comfort budgets and maintenance planning.
- Business aviation influences demand for quieter cabin zones and custom finish compatibility. Lessors fund selective kit replacement before lease transitions to protect asset value.
Cabin Noise-Reduction Insulation Upgrade Kits Market Drivers, Restraints and Opportunities
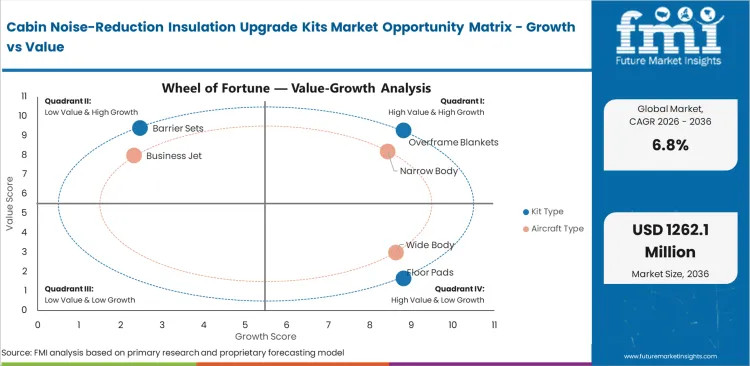
- Cabin refurbishment programs are creating more entry points for acoustic blanket and floor-zone replacement.
- Long aircraft downtime keeps non-essential insulation changes under cost and schedule review.
- Fit-ready kit packs can help MRO teams reduce cutting work during cabin reconfiguration.
Aircraft cabin upgrade activity is expected to support acoustic insulation kit demand as airlines refresh interiors across active fleets. Air India said in October 2025, the first phase of its legacy retrofit program covered 27 A320neo aircraft. Its A320 family fleet with new or upgraded cabin interiors reached 104 aircraft. Such scale gives suppliers a clearer route to place sidewall blankets and floor pads during planned cabin work. Retrofit time remains a restraint since Air New Zealand said in April 2025, its first retrofitted Boeing 787-9 spent 184 days in Singapore for a full nose-to-tail cabin refit. Long ground time means acoustic upgrades must save shop effort or fit inside existing work packages. Fit-ready kits with clear labels can help MRO teams reduce cabin rework risk during interior changes.
Import Dependence and Trade Flow Analysis
Japan reflects how cabin insulation kit sourcing can depend on cross-border aircraft-parts supply even in established aerospace markets. International Trade Administration stated in November 2025, Japan’s aircraft and related parts imports were estimated at USD 10.42 billion in 2025. Imports from the United States were estimated at USD 6.50 billion, against a total market size of USD 16.96 billion. Such trade structure proves important for cabin noise-reduction insulation upgrade kits since airlines and MRO shops often need qualified aircraft materials matching existing fleet standards. Suppliers with export paperwork and approved aerospace material records are better placed to serve retrofit demand without delaying maintenance schedules.
Installed Base and Replacement Cycle Analysis
Fleet age and lease portfolios point to steady replacement demand for cabin acoustic materials during aircraft handovers and interior checks. AerCap stated in February 2026 its portfolio included 3,500 aircraft along with engines, and helicopters as of December 31, 2025. Its owned passenger aircraft fleet had an average age of 7.3 years, while current technology aircraft averaged 15.2 years. Such age gap supports selective cabin work due to older aircraft needing more interior upkeep before lease transitions or renewed service. Cabin noise-reduction insulation upgrade kit suppliers can gain from this cycle when kits are easy to fit and backed by aircraft-zone documentation.
Analysis of Cabin Noise-Reduction Insulation Upgrade Kits Market by Key Countries
.webp "Top Country Growth Comparison Cabin Noise Reduction Insulation Upgrade Kits Market Cagr (2026 2036)")
| Country | CAGR |
|---|---|
| India | 8.4% |
| China | 7.9% |
| United States | 7.1% |
| United Kingdom | 6.6% |
| Germany | 6.2% |
| Japan | 5.8% |
| France | 5.5% |
Source: Future Market Insights, 2026.
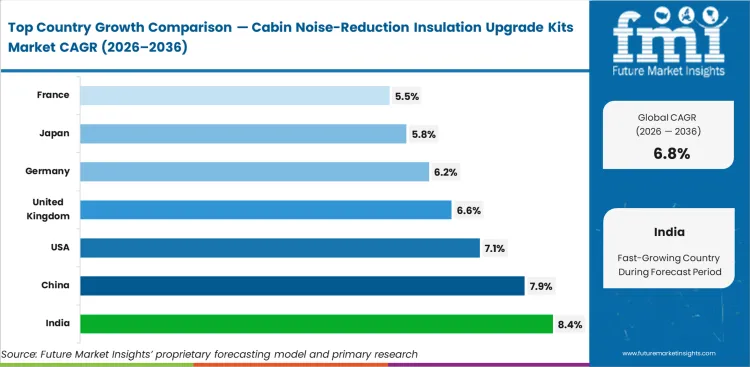
Cabin Noise-Reduction Insulation Upgrade Kits Market CAGR Analysis by Country
- India is projected to record 8.4% CAGR by 2036, driven by airline fleet growth and local maintenance capacity increasing retrofit demand.
- China is expected to expand at 7.9% CAGR by 2036, influenced by airline maintenance localization increasing the need for qualified cabin acoustic materials.
- United States is forecast to grow at 7.1% CAGR by 2036 due to airline fleets and business aviation sustaining upgrade orders.
- United Kingdom is expected to advance at 6.6% CAGR by 2036, led by its aircraft maintenance base supporting insulation replacement during scheduled cabin modification work.
- Germany is projected to rise at 6.2% CAGR by 2036 as fleet operators review cabin cost under tax and operating pressure.
- Japan is forecast at 5.8% CAGR by 2036 since aging wide-body interiors influence selective need for quieter sidewall and floor-zone packages.
- France is expected to post 5.5% CAGR by 2036, reflected by aerospace material suppliers and maintenance providers promoting certified cabin insulation replacement.
Country performance reflects fleet size and airline willingness to fund cabin comfort work. India and China track above the global rate due to faster aircraft utilization and rising local maintenance capability. United States stays above the global pace through airline and business jet depth. European countries show measured advancement as mature fleets replace kits during planned cabin programs.
Demand Outlook for Cabin Noise-Reduction Insulation Upgrade Kits in India
Demand in India is projected to record 8.4% CAGR by 2036, influenced by airline growth and maintenance localization raising cabin upgrade needs. India’s Ministry of Civil Aviation reported domestic air passenger traffic reached 22 crore 81 lakh in 2024. A fleet serving that scale, needs more scheduled cabin work and quicker material availability near maintenance sites. Acoustic kits can gain share as operators combine cabin refresh work with airworthiness checks.
- Airline growth raises blanket and floor pad replacement needs during narrow-body maintenance visits.
- Local MRO expansion makes kit stocking more useful for aircraft that cannot wait for imported materials.
- Passenger comfort reviews push operators to fix recurring cabin noise areas during refresh programs.
Demand Analysis of Cabin Noise-Reduction Insulation Upgrade Kits in China
Industry in China is forecast to expand at 7.9% CAGR by 2036 due to civil aviation scale promoting frequent cabin renewal work. Civil Aviation Administration of China data showed passenger traffic reached 770.0 million in 2025 and increased 5.5% from the prior year. High aircraft use promotes recurring access to sidewall and floor zones during maintenance. Suppliers with local conversion and documentation support can serve airline groups with shorter lead times.
- Domestic route density keeps narrow-body cabins active and raises wear checks in high-use aircraft.
- Fleet growth supports larger orders for labeled blanket packs matching aircraft family needs.
- Local maintenance networks favor suppliers able to combine acoustic materials with fast reordering support.
Demand Outlook for Cabin Noise-Reduction Insulation Upgrade Kits in the United States
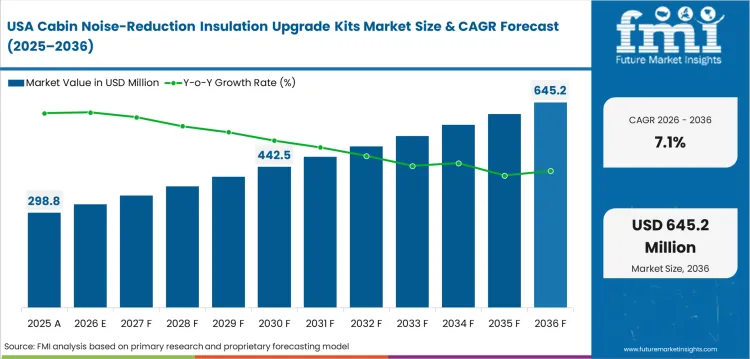
The market in United States is forecast to grow at 7.1% CAGR by 2036, led by airline depth and business aviation influencing kit replacement. Bureau of Transportation Statistics reported United States airlines carried 84.1 million scheduled service passengers in October 2025. Heavy aircraft use supports planned cabin checks and targeted comfort upgrades. Business jet operators add demand for quieter cabins with tailored finish compatibility.
- Large airline fleets promote repeat demand for overframe blanket and floor pad packs.
- Business aviation supports premium acoustic upgrades tied to cabin comfort and aircraft resale value.
- MRO shops need kit documentation shortening engineering review and limiting rework.
Sales Outlook for Cabin Noise-Reduction Insulation Upgrade Kits in the United Kingdom
Sales in the United Kingdom are forecast to advance at 6.6% CAGR by 2036 as airport traffic keeps aircraft interiors under frequent use. United Kingdom Civil Aviation Authority reported 302.0 million passengers moved through United Kingdom airports in 2025. Airport activity gives airlines a reason to preserve cabin comfort during scheduled checks. Kit suppliers gain once airlines replace noisy zones without changing the whole interior.
- Short-haul fleets generate steady replacement needs for sidewall insulation and door-seal kits.
- Airport traffic recovery supports cabin refresh plans across airline groups serving dense routes.
- Operators favor material packs helping engineering teams close fire performance review quickly.
Growth Outlook for Cabin Noise-Reduction Insulation Upgrade Kits in Germany
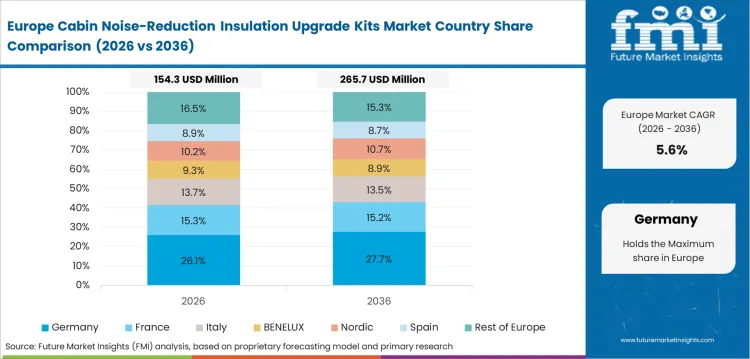
Sector in Germany is projected to rise at 6.2% CAGR by 2036 since cost pressure encourages targeted cabin work instead of full interior replacement. Germany’s Federal Statistical Office said aviation tax was payable for roughly 84.0 million air passengers in 2025. Cost scrutiny makes labor-saving kits more useful for operators managing cabin quality. Suppliers can gain from products integrating planned maintenance slots and avoiding extended downtime.
- Airline cost pressure supports selective kit replacement in noisy cabin zones.
- Maintenance sites value aircraft-zone labeling since it reduces shop-floor measuring time.
- Fleet operators focus on certified materials lowering approval delays before installation.
Sales Analysis of Cabin Noise-Reduction Insulation Upgrade Kits in Japan
Industry in Japan is forecast at 5.8% CAGR by 2036 due to hub traffic and service quality expectations supporting selective cabin upgrades. Japan Airport Terminal Group reported Haneda Airport domestic flight passengers at 64.99 million in fiscal 2024. High-density domestic operations keep cabin comfort visible to airlines serving frequent travelers. Upgrade kits are likely to be specified for quieter premium rows and aging narrow-body cabins.
- Domestic route use supports periodic sidewall and floor-zone acoustic checks.
- Premium service positioning favors lower cabin noise in business and long-haul aircraft.
- MRO teams prefer fit-ready materials avoiding cabin panel delays during overnight work.
Demand Outlook for Cabin Noise-Reduction Insulation Upgrade Kits in France
Demand in France is expected to post 5.5% CAGR by 2036 due to Paris traffic and European cabin retrofit activity sustaining measured demand. Aéroports de Paris reported Paris Aéroport traffic reached 107.0 million passengers in 2025 and rose 3.4% from 2024. Airline groups serving Paris hubs need quieter cabins without major downtime. French demand is expected to favor certified kits used during scheduled cabin refurbishment.
- Hub traffic supports cabin rework on aircraft assigned to dense European and long-haul routes.
- Airport noise policy pressure keeps acoustic performance visible across aviation planning.
- Retrofit demand favors suppliers with compliant materials and local conversion support.
Competitive Landscape and Strategic Positioning
- Integrated insulation suppliers hold an advantage led by combining acoustic materials with aircraft-ready conversion skill.
- Material specialists compete based on lighter foam and barrier options suiting tight cabin spaces.
- Regional converters gain orders by cutting kits quickly for smaller cabin refurbishment programs.
Competition in this market centers on suppliers turning qualified acoustic materials into cabin-ready kit packages. Airlines and MRO shops compare suppliers on material performance and fit accuracy. Certification support and repeat availability across aircraft fleets shape the final choice. Hutchinson SA competes on cabin insulation system depth and aerospace relationships. 3M Company competes through acoustic management materials and overframe blanket options. Polymer Technologies Inc. supports foam-based acoustic treatment. Tex Tech Industries Inc. supports textile-based aircraft insulation. Lamart Corporation and Duracote Corporation compete depending on laminates and converted barrier materials used in aircraft interiors.
Supplier choice depends on certification evidence and fit accuracy before an airline approves a cabin kit. MRO teams check whether blankets and pads match aircraft zones without causing field cutting delays. Smaller firms can acquire low-volume aircraft work by responding quickly to custom kit needs. Larger suppliers hold ground in airline programs requiring repeat availability across fleets. Vendors with conversion skill and reliable kit supply are best placed to achieve repeat cabin refresh budgets.
Key Companies in the Cabin Noise-Reduction Insulation Upgrade Kits Market
Competitive structure is grouped by integrated cabin insulation suppliers, material specialists and kit converters.
- Integrated Cabin Insulation Suppliers: Hutchinson SA and 3M Company supply broad aircraft acoustic and thermal insulation systems.
- Material Specialists: Polymer Technologies Inc. and Tex Tech Industries Inc. support foam and textile insulation needs. InsulTech LLC supports blanket insulation needs.
- Kit Converters: Lamart Corporation and Duracote Corporation support laminate, barrier and cut-to-fit aircraft material requirements.
Competitive Benchmarking: Cabin Noise-Reduction Insulation Upgrade Kits Market
| Company | Cabin Kit Fit | Fire Evidence Depth | Acoustic Material Range | Geographic Footprint |
|---|---|---|---|---|
| Hutchinson SA | High | High | High | Global |
| 3M Company | High | High | High | Global |
| Polymer Technologies Inc. | Medium | Medium | High | United States and global |
| Tex Tech Industries Inc. | Medium | Medium | High | United States and global |
| Lamart Corporation | Medium | Medium | Medium | United States and global |
| Duracote Corporation | Medium | Medium | Medium | United States |
| InsulTech LLC | Medium | High | Medium | North America |
Source: Future Market Insights competitive analysis 2026. Ratings reflect relative positioning based on cabin acoustic material range and kit support capability.
Key Developments in Cabin Noise-Reduction Insulation Upgrade Kits Market
- In December 2024, Lamart detailed tailor-made thermal and acoustic aircraft insulation systems designed to fit specific aircraft models and improve cabin noise reduction.
- In February 2025, Boeing published patent application US20250058867A1 for aircraft insulation blanket assemblies using support rails to reduce moisture transfer and support blanket performance.
- In January 2026, Boeing received patent US12522340B2 for an aircraft sidewall cabin-window insulating seal designed for sidewall cavities around cabin windows.
Key Players in the Cabin Noise-Reduction Insulation Upgrade Kits Market
Major Global Players:
- Hutchinson SA
- 3M Company
- Tex Tech Industries Inc.
- Polymer Technologies Inc.
Specialist and Regional Players:
- Lamart Corporation
- Duracote Corporation
- InsulTech LLC
Market Report Scope
| Parameter | Details |
|---|---|
| Quantitative units | USD 653.7 million in 2026 to USD 1,262.1 million by 2036, at 6.8% CAGR |
| Market definition | Pre-cut acoustic and thermal insulation kits used inside aircraft cabins during upgrade and retrofit work |
| Kit type | Overframe blankets, floor pads, barrier sets, door seals |
| Aircraft type | Narrow body, wide body, business jet, regional jet |
| Material type | Fiberglass, melamine foam, polymer barriers, composite pads |
| Installation channel | MRO shops, OEM retrofit, owner operators, distributors |
| End user | Airlines, business aviation, lessors, government fleets |
| Regions covered | North America, Europe, East Asia, South Asia and Pacific, Latin America, Middle East and Africa |
| Countries covered | India, China, United States, United Kingdom, Germany, Japan, France |
| Key companies profiled | Hutchinson SA, 3M Company, Polymer Technologies Inc., Tex Tech Industries Inc., Lamart Corporation, Duracote Corporation, InsulTech LLC |
| Forecast period | 2026 to 2036 |
| Approach | Hybrid top-down and bottom-up model with fleet use, MRO timing and acoustic kit pricing checks |
Source: Future Market Insights, 2026.
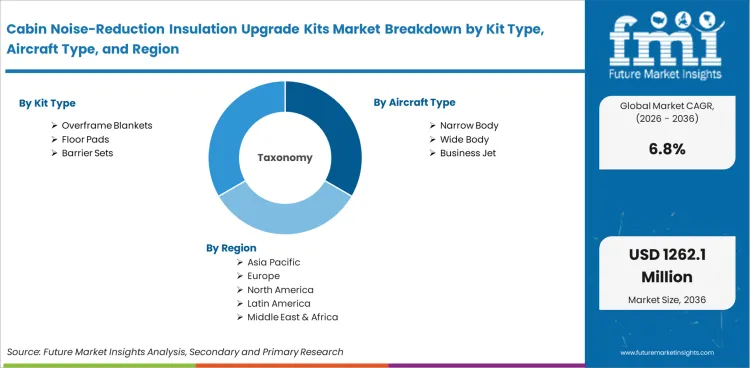
Cabin Noise-Reduction Insulation Upgrade Kits Market Breakdown by Kit Type, Aircraft Type, Material Type, Installation Channel, End User, and Region
By Kit Type:
- Overframe Blankets
- Floor Pads
- Barrier Sets
- Door Seals
By Aircraft Type:
- Narrow Body
- Wide Body
- Business Jet
- Regional Jet
By Material Type:
- Fiberglass
- Melamine Foam
- Polymer Barriers
- Composite Pads
By Installation Channel:
- MRO Shops
- OEM Retrofit
- Owner Operators
- Distributors
By End User:
- Airlines
- Business Aviation
- Lessors
- Government Fleets
By Region:
- North America
- United States
- Europe
- Germany
- France
- United Kingdom
- East Asia
- China
- Japan
- South Asia and Pacific
- India
- Latin America
- Middle East and Africa
Research Sources and Bibliography
- Airbus. (2024, June 4). Airbus Commercial Aircraft specification / Nadcap commodity cross table.
- European Union Aviation Safety Agency. (2024, December 2). Commission Implementing Regulation (EU) 2024/2954.
- Skandia, Inc. (2024, August). Products & services catalog.
- The Boeing Company. (2024, January 2). Aircraft thermal acoustic insulation blanket (USA Patent No. US11858614B2). Google Patents.
- Airbus. (2025, October 9). Airbus projects resilient growth of services market in the next 20 years.
- The Boeing Company. (2025, June 15). Boeing 20-year forecast shows steady demand for nearly 44,000 new airplanes.
- Air India. (2025, October 31). Air India completes first phase of legacy retrofit programme; 104 A320 family aircraft now feature new or upgraded cabin interiors.
- Air New Zealand. (2025, April 17). Runway ready: Air New Zealand’s first retrofitted Dreamliner touches down.
- International Trade Administration. (2025, November 18). Japan: Aircraft and related parts. USA Department of Commerce.
- AerCap Holdings N.V. (2026, February 13). Annual report for the 2025 financial year: Dutch GAAP.
- Ministry of Civil Aviation, Government of India. (2025, April 22). India’s aviation revolution. Press Information Bureau.
- Civil Aviation Administration of China. (2026, January 6). China’s civil aviation sector achieves steady growth in 2025.
- Bureau of Transportation Statistics. (2026, January). October 2025 USA airline traffic data.
- United Kingdom Civil Aviation Authority. (2026, February 24). UK aviation officially breaks records with over 300m passenger journeys in 2025.
- Statistisches Bundesamt. (2026, April). Aviation tax declared in 2025.
- Japan Airport Terminal Co., Ltd. (2025, May). Integrated report 2025.
- Aéroports de Paris SA. (2026, January). December and full-year 2025 traffic figures.
- Lamart Corporation. (2024, December 2). Tailor-made thermal and acoustic aircraft insulation systems.
- European Union Aviation Safety Agency. (2025, September 16). CF-2025-48: Equipment / furnishings - insulation installation - insufficient overlap.
- The Boeing Company. (2026, January 13). Aircraft sidewall having cabin windows with insulating seals (USA Patent No. US12522340B2). Google Patents.
Bibliography uses primary government, official trade body and company sources.
This Report Answers
- What is the 2026 value of the cabin noise-reduction insulation upgrade kits sector?
- Which kit type is forecast to hold the leading share in 2026?
- Which aircraft type generates the most repeat cabin acoustic kit demand?
- How do MRO shops shape installation channel value for cabin insulation kits?
- Which countries are forecast to expand above the global CAGR by 2036?
- Which suppliers are most relevant for aircraft cabin acoustic kit programs?
- What certification and fire evidence issues affect supplier selection?
Frequently Asked Questions
What is the cabin noise-reduction insulation upgrade kits market size in 2026?
The cabin noise-reduction insulation upgrade kits market is forecast to cross USD 653.7 million in 2026 and reach USD 1,262.1 million by 2036.
What is the CAGR for the cabin noise-reduction insulation upgrade kits market?
The sector is projected to expand at 6.8% CAGR from 2026 to 2036 as cabin refresh cycles support acoustic kit replacement.
Which segment leads the cabin noise-reduction insulation upgrade kits market?
Airlines are forecast to hold 62.7% share in 2026, led by fleet operators controlling most cabin comfort and refresh budgets.
Which country grows fastest in the cabin noise-reduction insulation upgrade kits market?
India is forecast to record 8.4% CAGR by 2036 due to fleet growth and local maintenance capacity influencing retrofit demand.
Who are key players in the cabin noise-reduction insulation upgrade kits market?
Key suppliers include Hutchinson SA and 3M Company among active aerospace material providers. Polymer Technologies Inc. and Lamart Corporation support specialist acoustic materials.
Preview the report firsthand - request a free sample
Get SampleGet the brochure for pricing and purchase details.
Get PDFTable of Content
- Key Takeaways
- Market Size and CAGR
- Top Growth Driver
- Fastest Growing Segment
- Leading Region
- Key Companies
- Emerging Opportunities
- Executive Summary
- Global Market Outlook
- Demand-side Trends
- Supply-side Trends
- Technology Roadmap Analysis
- Analysis and Recommendations
- Analyst Perspective (What is happening? Why now? What should investors know?)
- Key Questions Answered
- How large is the market?
- What is the CAGR?
- What are key trends?
- Which region dominates?
- Who are the leaders?
- Market Overview
- Market Coverage / Taxonomy
- Market Definition / Scope / Limitations
- Research Methodology
- Chapter Orientation
- Analytical Lens and Working Hypotheses
- Market Structure, Signals, and Trend Drivers
- Benchmarking and Cross-market Comparability
- Market Sizing, Forecasting, and Opportunity Mapping
- Research Design and Evidence Framework
- Desk Research Programme (Secondary Evidence)
- Expert Input and Fieldwork (Primary Evidence)
- Tooling, Models, and Reference Databases
- Data Engineering and Model Build
- Quality Assurance and Audit Trail
- Market Background
- Market Dynamics (Drivers, Restraints, Opportunity, Trends)
- Scenario Forecast (Optimistic, Likely, Conservative)
- Impact Analysis
- AI Impact
- Sustainability Impact
- Regulatory Impact
- Technology Impact
- Consumer / Buyer Analysis
- Purchase Drivers
- Adoption Barriers
- Buyer Journey
- Opportunity Map Analysis
- Product Life Cycle Analysis
- Supply Chain Analysis
- Investment Feasibility Matrix
- Value Chain Analysis
- PESTLE and Porter's Analysis
- Regulatory Landscape
- Regional Parent Market Outlook
- Production and Consumption Statistics
- Import and Export Statistics
- Global Market Analysis and Forecast, 2021 to 2036
- Historical Market Size Value (USD Million) & Volume (Unit) Analysis, 2021 to 2025
- Current and Future Market Size Value (USD Million) & Volume (Unit) Projections, 2026 to 2036
- Y-o-Y Growth Trend Analysis
- Absolute $ Opportunity Analysis
- Global Market Pricing Analysis, 2021 to 2036
- Global Market Analysis and Forecast, By Kit Type, 2021 to 2036
- Introduction / Key Findings
- Historical Market Size Value (USD Million) & Volume (Unit) Analysis By Kit Type, 2021 to 2025
- Current and Future Market Size Value (USD Million) & Volume (Unit) Analysis and Forecast By Kit Type, 2026 to 2036
- Overframe Blankets
- Floor Pads
- Barrier Sets
- Door Seals
- Overframe Blankets
- Y-o-Y Growth Trend Analysis By Kit Type, 2021 to 2025
- Absolute $ Opportunity Analysis By Kit Type, 2026 to 2036
- Global Market Analysis and Forecast, By Aircraft Type, 2021 to 2036
- Introduction / Key Findings
- Historical Market Size Value (USD Million) & Volume (Unit) Analysis By Aircraft Type, 2021 to 2025
- Current and Future Market Size Value (USD Million) & Volume (Unit) Analysis and Forecast By Aircraft Type, 2026 to 2036
- Narrow Body
- Wide Body
- Business Jet
- Regional Jet
- Narrow Body
- Y-o-Y Growth Trend Analysis By Aircraft Type, 2021 to 2025
- Absolute $ Opportunity Analysis By Aircraft Type, 2026 to 2036
- Global Market Analysis and Forecast, By Material Type, 2021 to 2036
- Introduction / Key Findings
- Historical Market Size Value (USD Million) & Volume (Unit) Analysis By Material Type, 2021 to 2025
- Current and Future Market Size Value (USD Million) & Volume (Unit) Analysis and Forecast By Material Type, 2026 to 2036
- Fiberglass
- Melamine Foam
- Polymer Barriers
- Composite Pads
- Fiberglass
- Y-o-Y Growth Trend Analysis By Material Type, 2021 to 2025
- Absolute $ Opportunity Analysis By Material Type, 2026 to 2036
- Global Market Analysis and Forecast, By Installation Channel, 2021 to 2036
- Introduction / Key Findings
- Historical Market Size Value (USD Million) & Volume (Unit) Analysis By Installation Channel, 2021 to 2025
- Current and Future Market Size Value (USD Million) & Volume (Unit) Analysis and Forecast By Installation Channel, 2026 to 2036
- MRO Shops
- OEM Retrofit
- Owner Operators
- Distributors
- MRO Shops
- Y-o-Y Growth Trend Analysis By Installation Channel, 2021 to 2025
- Absolute $ Opportunity Analysis By Installation Channel, 2026 to 2036
- Global Market Analysis and Forecast, By End User, 2021 to 2036
- Introduction / Key Findings
- Historical Market Size Value (USD Million) & Volume (Unit) Analysis By End User, 2021 to 2025
- Current and Future Market Size Value (USD Million) & Volume (Unit) Analysis and Forecast By End User, 2026 to 2036
- Airlines
- Business Aviation
- Lessors
- Government Fleets
- Airlines
- Y-o-Y Growth Trend Analysis By End User, 2021 to 2025
- Absolute $ Opportunity Analysis By End User, 2026 to 2036
- Global Market Analysis and Forecast, By Region, 2021 to 2036
- Introduction
- Historical Market Size Value (USD Million) & Volume (Unit) Analysis By Region, 2021 to 2025
- Current Market Size Value (USD Million) & Volume (Unit) Analysis and Forecast By Region, 2026 to 2036
- North America
- Latin America
- Western Europe
- Eastern Europe
- East Asia
- South Asia and Pacific
- Middle East & Africa
- Market Attractiveness Analysis By Region
- North America Market Analysis and Forecast, By Country, 2021 to 2036
- Historical Market Size Value (USD Million) & Volume (Unit) Trend Analysis By Market Taxonomy, 2021 to 2025
- Market Size Value (USD Million) & Volume (Unit) Forecast By Market Taxonomy, 2026 to 2036
- By Country
- USA
- Canada
- Mexico
- By Kit Type
- By Aircraft Type
- By Material Type
- By Installation Channel
- By End User
- By Country
- Market Attractiveness Analysis
- By Country
- By Kit Type
- By Aircraft Type
- By Material Type
- By Installation Channel
- By End User
- Key Takeaways
- Latin America Market Analysis and Forecast, By Country
- Historical Market Size Value (USD Million) & Volume (Unit) Trend Analysis By Market Taxonomy, 2021 to 2025
- Market Size Value (USD Million) & Volume (Unit) Forecast By Market Taxonomy, 2026 to 2036
- By Country
- Brazil
- Chile
- Rest of Latin America
- By Kit Type
- By Aircraft Type
- By Material Type
- By Installation Channel
- By End User
- By Country
- Market Attractiveness Analysis
- By Country
- By Kit Type
- By Aircraft Type
- By Material Type
- By Installation Channel
- By End User
- Key Takeaways
- Western Europe Market Analysis and Forecast, By Country
- Historical Market Size Value (USD Million) & Volume (Unit) Trend Analysis By Market Taxonomy, 2021 to 2025
- Market Size Value (USD Million) & Volume (Unit) Forecast By Market Taxonomy, 2026 to 2036
- By Country
- Germany
- UK
- Italy
- Spain
- France
- Nordic
- BENELUX
- Rest of Western Europe
- By Kit Type
- By Aircraft Type
- By Material Type
- By Installation Channel
- By End User
- By Country
- Market Attractiveness Analysis
- By Country
- By Kit Type
- By Aircraft Type
- By Material Type
- By Installation Channel
- By End User
- Key Takeaways
- Eastern Europe Market Analysis and Forecast, By Country
- Historical Market Size Value (USD Million) & Volume (Unit) Trend Analysis By Market Taxonomy, 2021 to 2025
- Market Size Value (USD Million) & Volume (Unit) Forecast By Market Taxonomy, 2026 to 2036
- By Country
- Russia
- Poland
- Hungary
- Balkan & Baltic
- Rest of Eastern Europe
- By Kit Type
- By Aircraft Type
- By Material Type
- By Installation Channel
- By End User
- By Country
- Market Attractiveness Analysis
- By Country
- By Kit Type
- By Aircraft Type
- By Material Type
- By Installation Channel
- By End User
- Key Takeaways
- East Asia Market Analysis and Forecast, By Country
- Historical Market Size Value (USD Million) & Volume (Unit) Trend Analysis By Market Taxonomy, 2021 to 2025
- Market Size Value (USD Million) & Volume (Unit) Forecast By Market Taxonomy, 2026 to 2036
- By Country
- China
- Japan
- South Korea
- By Kit Type
- By Aircraft Type
- By Material Type
- By Installation Channel
- By End User
- By Country
- Market Attractiveness Analysis
- By Country
- By Kit Type
- By Aircraft Type
- By Material Type
- By Installation Channel
- By End User
- Key Takeaways
- South Asia and Pacific Market Analysis and Forecast, By Country
- Historical Market Size Value (USD Million) & Volume (Unit) Trend Analysis By Market Taxonomy, 2021 to 2025
- Market Size Value (USD Million) & Volume (Unit) Forecast By Market Taxonomy, 2026 to 2036
- By Country
- India
- ASEAN
- Australia & New Zealand
- Rest of South Asia and Pacific
- By Kit Type
- By Aircraft Type
- By Material Type
- By Installation Channel
- By End User
- By Country
- Market Attractiveness Analysis
- By Country
- By Kit Type
- By Aircraft Type
- By Material Type
- By Installation Channel
- By End User
- Key Takeaways
- Middle East & Africa Market Analysis and Forecast, By Country
- Historical Market Size Value (USD Million) & Volume (Unit) Trend Analysis By Market Taxonomy, 2021 to 2025
- Market Size Value (USD Million) & Volume (Unit) Forecast By Market Taxonomy, 2026 to 2036
- By Country
- Kingdom of Saudi Arabia
- Other GCC Countries
- Türkiye
- South Africa
- Other African Union
- Rest of Middle East & Africa
- By Kit Type
- By Aircraft Type
- By Material Type
- By Installation Channel
- By End User
- By Country
- Market Attractiveness Analysis
- By Country
- By Kit Type
- By Aircraft Type
- By Material Type
- By Installation Channel
- By End User
- Key Takeaways
- Key Countries Market Analysis
- USA
- Pricing Analysis
- Market Share Analysis, 2025
- By Kit Type
- By Aircraft Type
- By Material Type
- By Installation Channel
- By End User
- Canada
- Pricing Analysis
- Market Share Analysis, 2025
- By Kit Type
- By Aircraft Type
- By Material Type
- By Installation Channel
- By End User
- Mexico
- Pricing Analysis
- Market Share Analysis, 2025
- By Kit Type
- By Aircraft Type
- By Material Type
- By Installation Channel
- By End User
- Brazil
- Pricing Analysis
- Market Share Analysis, 2025
- By Kit Type
- By Aircraft Type
- By Material Type
- By Installation Channel
- By End User
- Chile
- Pricing Analysis
- Market Share Analysis, 2025
- By Kit Type
- By Aircraft Type
- By Material Type
- By Installation Channel
- By End User
- Germany
- Pricing Analysis
- Market Share Analysis, 2025
- By Kit Type
- By Aircraft Type
- By Material Type
- By Installation Channel
- By End User
- UK
- Pricing Analysis
- Market Share Analysis, 2025
- By Kit Type
- By Aircraft Type
- By Material Type
- By Installation Channel
- By End User
- Italy
- Pricing Analysis
- Market Share Analysis, 2025
- By Kit Type
- By Aircraft Type
- By Material Type
- By Installation Channel
- By End User
- Spain
- Pricing Analysis
- Market Share Analysis, 2025
- By Kit Type
- By Aircraft Type
- By Material Type
- By Installation Channel
- By End User
- France
- Pricing Analysis
- Market Share Analysis, 2025
- By Kit Type
- By Aircraft Type
- By Material Type
- By Installation Channel
- By End User
- India
- Pricing Analysis
- Market Share Analysis, 2025
- By Kit Type
- By Aircraft Type
- By Material Type
- By Installation Channel
- By End User
- ASEAN
- Pricing Analysis
- Market Share Analysis, 2025
- By Kit Type
- By Aircraft Type
- By Material Type
- By Installation Channel
- By End User
- Australia & New Zealand
- Pricing Analysis
- Market Share Analysis, 2025
- By Kit Type
- By Aircraft Type
- By Material Type
- By Installation Channel
- By End User
- China
- Pricing Analysis
- Market Share Analysis, 2025
- By Kit Type
- By Aircraft Type
- By Material Type
- By Installation Channel
- By End User
- Japan
- Pricing Analysis
- Market Share Analysis, 2025
- By Kit Type
- By Aircraft Type
- By Material Type
- By Installation Channel
- By End User
- South Korea
- Pricing Analysis
- Market Share Analysis, 2025
- By Kit Type
- By Aircraft Type
- By Material Type
- By Installation Channel
- By End User
- Russia
- Pricing Analysis
- Market Share Analysis, 2025
- By Kit Type
- By Aircraft Type
- By Material Type
- By Installation Channel
- By End User
- Poland
- Pricing Analysis
- Market Share Analysis, 2025
- By Kit Type
- By Aircraft Type
- By Material Type
- By Installation Channel
- By End User
- Hungary
- Pricing Analysis
- Market Share Analysis, 2025
- By Kit Type
- By Aircraft Type
- By Material Type
- By Installation Channel
- By End User
- Kingdom of Saudi Arabia
- Pricing Analysis
- Market Share Analysis, 2025
- By Kit Type
- By Aircraft Type
- By Material Type
- By Installation Channel
- By End User
- Türkiye
- Pricing Analysis
- Market Share Analysis, 2025
- By Kit Type
- By Aircraft Type
- By Material Type
- By Installation Channel
- By End User
- South Africa
- Pricing Analysis
- Market Share Analysis, 2025
- By Kit Type
- By Aircraft Type
- By Material Type
- By Installation Channel
- By End User
- USA
- Market Structure Analysis
- Competition Dashboard
- Competition Benchmarking
- Market Share Analysis of Top Players
- By Regional
- By Kit Type
- By Aircraft Type
- By Material Type
- By Installation Channel
- By End User
- Emerging Startups
- Innovation Benchmarking
- Competition Analysis
- Competition Deep Dive
- Hutchinson SA
- Overview
- Product Portfolio
- Profitability by Market Segments (Product/Region/Sales Channel)
- Sales Footprint
- Strategy Overview
- Marketing Strategy
- Product Strategy
- Channel Strategy
- 3M Company
- Tex Tech Industries Inc.
- Polymer Technologies Inc.
- Lamart Corporation
- Duracote Corporation
- InsulTech LLC
- Hutchinson SA
- Case Studies
- Success Stories
- Recent Developments
- Competition Deep Dive
- Assumptions & Acronyms Used


