

- Market Size (2026)
- USD 0.9 Bn
- Forecast (2036)
- USD 1.4 Bn
- CAGR (2026 to 2036)
- 5.4%
Cabin Environmental Monitoring Sensor Networks Market Size, Market Forecast and Outlook By FMI
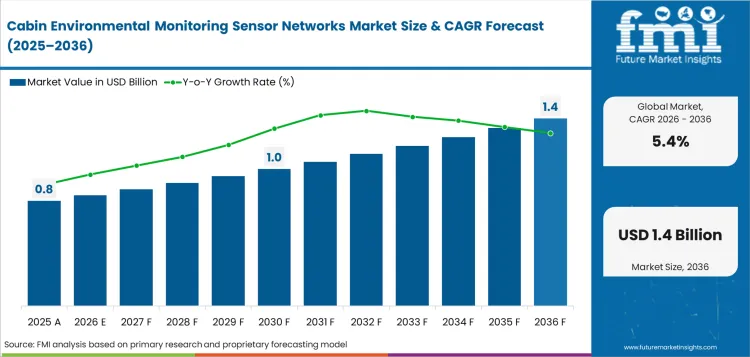
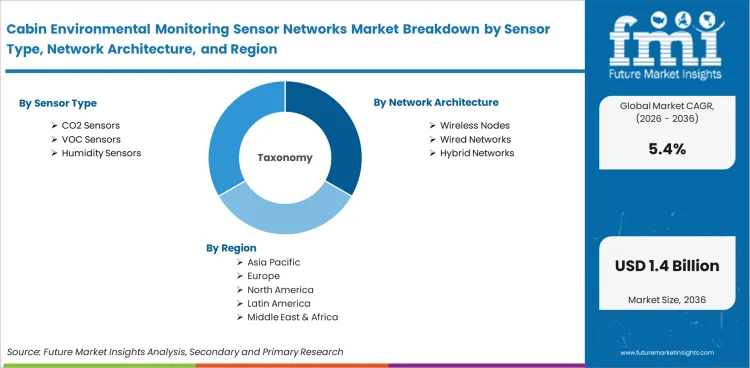
The cabin environmental monitoring sensor networks market was valued at USD 0.8 billion in 2025. The market is expected to reach USD 0.9 billion by 2026-end and expand at a CAGR of 5.4% between 2026 and 2036 to reach USD 1.4 billion by 2036. Airlines are expected to dominate with a 57.5% end user share, and wireless nodes are projected to lead the network architecture segment with a 38.5% share.
Summary of the Cabin Environmental Monitoring Sensor Networks Market
- Demand and Growth Drivers
- Cabin air quality records strengthen demand for sensor networks as airlines need objective flight-level data after air quality complaints.
- Fleet utilization increases the need for automatic monitoring as full aircraft cabins place greater pressure on ventilation checks.
- Connected aircraft programs raise the value of sensor feeds as maintenance teams use cabin data to review faults faster.
- Product and Segment View
- CO2 sensors are expected to lead the sensor type segment with 31.0% share in 2026 as airlines use them for direct cabin ventilation checks.
- Retrofit cabin programs favor wireless nodes, which are projected to hold 38.5% share in 2026 by reducing wiring work and installation downtime.
- Airlines are projected to account for 57.5% of end user demand in 2026, driven by fleet-wide needs for verified cabin condition records.
- Geography and Competitive Outlook
- India is expected to record a CAGR of 7.2% through 2036, as airport expansion and airline fleet growth lift monitoring needs.
- China is projected to expand at 6.8% CAGR through 2036, as domestic traffic and aircraft programs expand the addressable fleet base.
- Companies combining certified cabin air monitoring with secure aircraft data transfer are strengthening their market position during the forecast period.
- Analyst Opinion
- Nikhil Kaitwade, Principal Consultant for Automotive at FMI says, “Cabin environmental monitoring is becoming evidence for air quality complaints and maintenance review. Cabin teams need CO2 VOC and particulate readings in one workflow. Certified modules with secure data transfer reduce manual checks while calibration needs shape retrofit approvals.”
- Cabin Environmental Monitoring Sensor Networks Market Value Analysis
- The cabin environmental monitoring sensor networks market is moving from isolated cabin checks into structured data capture across aircraft fleets.
- Adoption is driven by cabin air evidence needs for airlines operating dense short-haul and long-haul networks.
- The market is benefiting from wider use of connected cabin air data systems across cabin upgrade programs.
- Demand is backed by the need for sensor records meeting airline safety and service documentation needs.
Key Takeaways, Market Size and Forecast
- The cabin environmental monitoring sensor networks market was valued at USD 0.8 billion in 2025.
- By 2036, the cabin environmental monitoring sensor networks market is expected to be worth USD 1.4 billion.
- From 2026 to 2036, the market is projected to expand at a CAGR of 5.4%.
- The market is projected to create an incremental opportunity of USD 0.5 billion between 2026 and 2036.
- In 2026, airlines are expected to account for 57.5% of end user demand.
- India, with a 7.2% CAGR, and China, with a 6.8% CAGR, are projected to be the faster-growing country markets.
Airlines need cabin air records they can review after a complaint or maintenance issue. Teledyne ACES helps address this need by collecting cabin environmental data for every flight and sending it through Wi-Fi or cellular transfer. This makes sensor networks useful for evidence, not only for comfort monitoring. FAA cabin air guidance states that aircraft ventilation systems must provide 0.55 pounds of fresh air per minute per occupant, which makes measurable cabin airflow important for airlines.
ASHRAE Standard 161-2024 also defines air quality requirements for commercial passenger aircraft carrying 20 or more passengers. This gives OEMs and retrofit teams a clearer reference for cabin air measurement. Safran’s June 2025 predictive maintenance update indicates how aircraft operators already use onboard sensors for temperature and pressure monitoring. Cabin monitoring vendors with certified modules and secure data transfer can fit into this broader aircraft data workflow.
Cabin Environmental Monitoring Sensor Networks Market Definition
The cabin environmental monitoring sensor networks market includes connected sensing systems used inside passenger aircraft cabins and flight decks. These systems assess carbon dioxide, volatile organic compounds, humidity, pressure, temperature and particulate conditions during aircraft operation. Scope includes sensor modules, wireless nodes, wired networks, gateways and cabin air dashboards. Airport building monitors, passenger wearables and engine-only health sensors are outside the scope.
Cabin Environmental Monitoring Sensor Networks Market Inclusions
Market scope covers all commercially traded cabin environmental monitoring sensor network systems categorized by sensor type, including CO2 sensors, VOC sensors, humidity sensors, pressure sensors, temperature sensors, and particulate sensors; network architecture, including wireless nodes, wired networks, hybrid networks, gateway units, and cloud dashboards; aircraft class, including narrow-body aircraft, wide-body aircraft, regional jets, business jets, and helicopters; and installation channel, including OEM fitment, retrofit kits, line maintenance, and cabin upgrades. Revenue scope covers 2026 to 2036. The key stakeholders include aircraft sensor manufacturers, cabin system integrators, aircraft OEMs, airlines, MRO providers, avionics suppliers, connectivity platform providers, calibration service firms, certification bodies, and aviation regulators.
Cabin Environmental Monitoring Sensor Networks Market Exclusions
Scope does not include airport terminal air quality systems, building HVAC controls, cargo bay fire detection systems, passenger entertainment electronics or engine health monitoring sensors.
Cabin Environmental Monitoring Sensor Networks Market Research Methodology
- Primary Research: FMI analysts reviewed input from airline engineering teams and cabin system suppliers in key markets.
- Desk Research: Combined aviation traffic records with company product portfolios.
- Market sizing and forecasting: Added sensor use across aircraft classes from the bottom up.
- Data validation: Cross-checked against airline traffic patterns and cabin monitoring coverage.
Why is the Cabin Environmental Monitoring Sensor Networks Market Growing?
- Airlines are using cabin air monitoring earlier to reduce uncertainty after odor, smoke or ventilation complaints.
- Monitoring partners are becoming important as aircraft cabins combine airflow controls with connected data systems.
- Manufacturers are placing sensor-ready cabin hardware into new programs to reduce later retrofit work.
Global airline utilization is placing more value on cabin air records across active fleets. IATA reported full-year 2025 passenger demand up 5.3% and a record 83.6% load factor for full-year traffic. Higher occupancy increases the usefulness of CO2 and humidity readings during flight. Sensor networks help airlines separate actual cabin air changes from isolated service complaints.
Airport passenger activity also expands the operating base for cabin environmental monitoring. ACI World forecast global passenger traffic at 10.2 billion in 2026 and 18.8 billion by 2045. Larger traffic flows place more aircraft into frequent cabin cycles. Monitoring systems gain value as operators need repeatable records without adding manual checks during aircraft turnaround.
Market Segmentation Analysis
- CO2 Sensors are projected to hold 31.0% of sensor type demand in 2026 as airlines rely on direct readings for cabin ventilation review.
- Retrofit cabin programs favor Wireless Nodes, with the segment expected to capture 38.5% share across network architecture.
- Narrow-body aircraft are forecast to represent 46.0% of aircraft class revenue, backed by frequent short-haul service cycles.
- OEM fitment is expected at 52.0% share within installation channels as aircraft builders integrate sensors during cabin design.
- Airlines are expected to lead the end user segment with 57.5% share, driven by fleet-level needs for verified cabin condition records.
The market is divided into five primary segment groups based on sensor type, network architecture, aircraft class, installation channel and end user. Sensor type defines the cabin condition measured, and architecture defines how readings move across aircraft systems. Aircraft class shapes sensor density, while installation channel decides downtime and approval cost. End user analysis reveals airlines leading demand as flight-level records help cabin maintenance review.
Insights into Cabin Environmental Monitoring Sensor Networks Market by Sensor Type
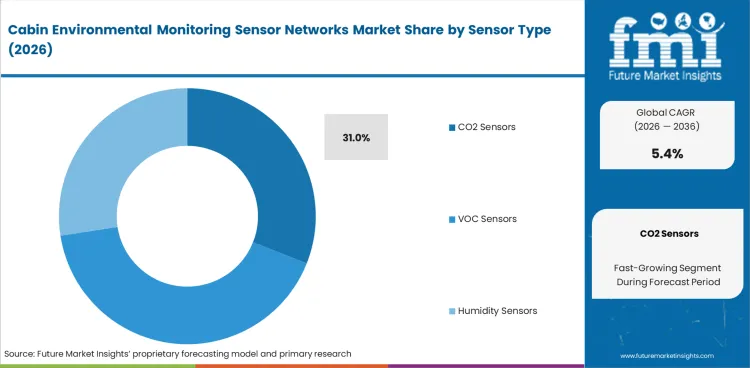
- CO2 sensors are expected to account for 31.0% of the sensor type segment in 2026. Cabin teams use these sensors to verify ventilation performance across occupied aircraft interiors.
- VOC and particulate sensors address selected incident review needs. Their value improves during odor complaints and air quality checks requiring deeper investigation.
Insights into Cabin Environmental Monitoring Sensor Networks Market by Network Architecture
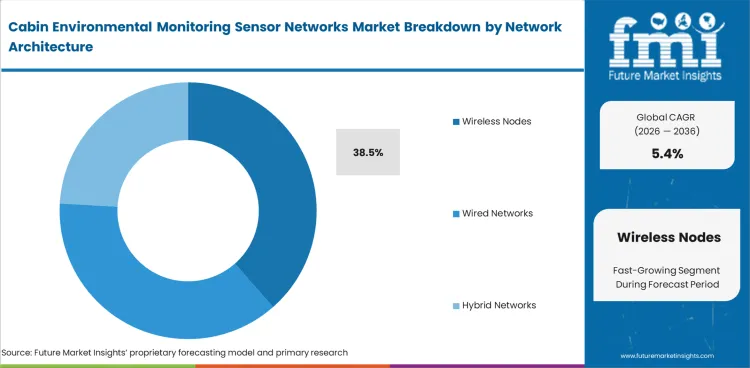
- Wireless nodes are projected to account for 38.5% of the network architecture segment in 2026. Retrofit programs prefer them for lower wiring work and shorter aircraft downtime.
- Wired networks suit new aircraft programs requiring fixed cabin data links. Hybrid formats serve larger cabins needing secure transfer between sensors and gateways.
Insights into Cabin Environmental Monitoring Sensor Networks Market by Aircraft Class
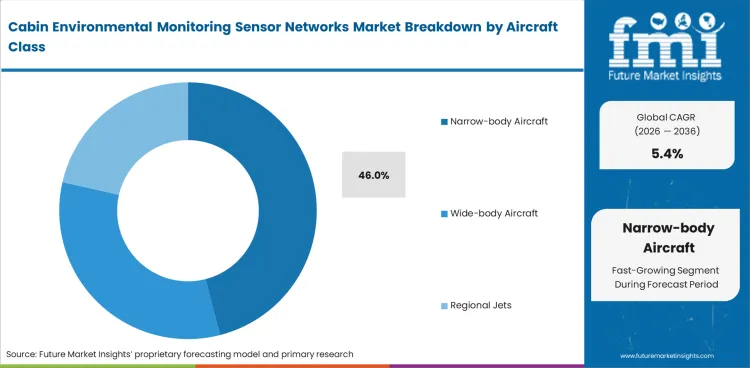
- Narrow-body aircraft are expected to account for 46.0% share in 2026. Short-haul fleets create repeated cabin cycles across dense domestic and regional routes.
- Wide-body aircraft need broader zone coverage for premium cabins and longer flight durations. Regional jets use compact modules where space and service access stay limited.
Insights into Cabin Environmental Monitoring Sensor Networks Market by Installation Channel
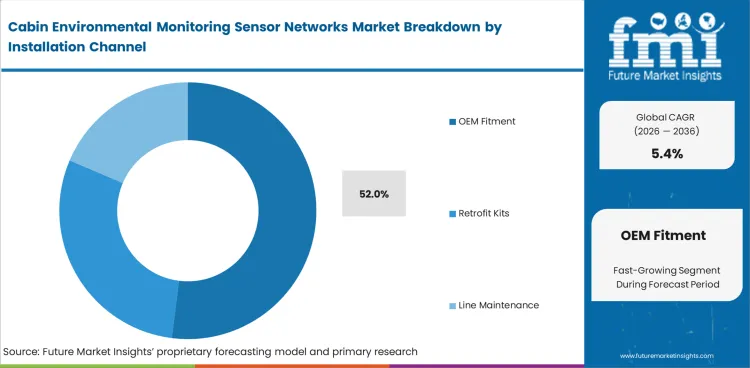
- OEM fitment is expected to represent 52.0% share in 2026. Aircraft makers can place sensors and data gateways during cabin design with lower rework risk.
- Retrofit kits address active fleets requiring air quality monitoring after delivery. Line maintenance channels serve smaller upgrades and replacement needs during scheduled checks.
Insights into Cabin Environmental Monitoring Sensor Networks Market by End User
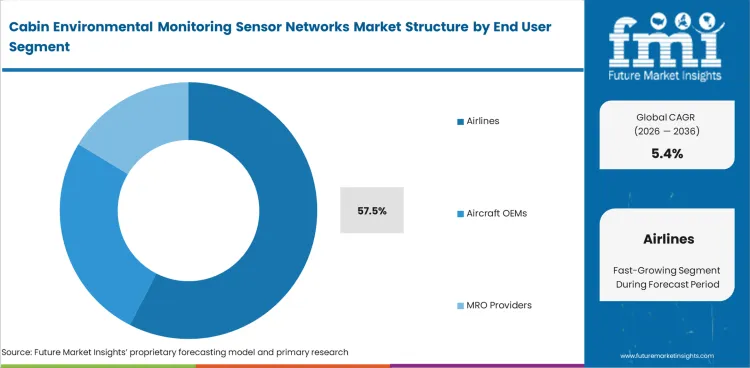
- Airlines are projected to hold 57.5% share in 2026. Fleet operators need flight-level cabin records to review comfort issues and maintenance alerts.
- Aircraft OEMs use sensor-ready cabins to improve system integration during production. MRO providers support installed networks through calibration work and component replacement.
Cabin Environmental Monitoring Sensor Networks Market Drivers, Restraints, and Opportunities
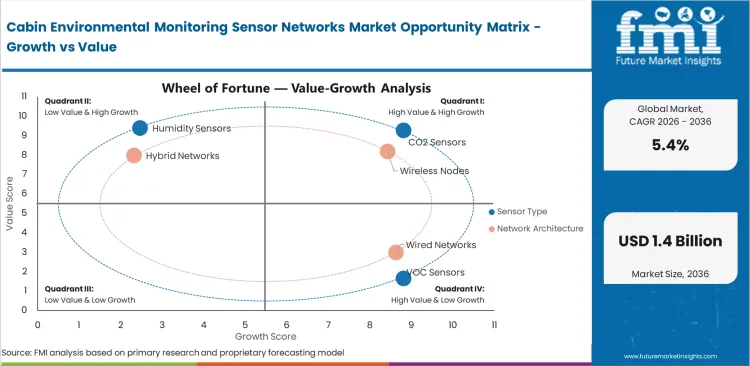
- Cabin air complaint review is creating structured demand for CO2, VOC and particulate records across passenger aircraft.
- The requirement for certified hardware and cabin approval work increases pricing pressure for smaller sensor providers.
- Connected cabins improve service opportunity through secure data transfer and fleet-level dashboard needs.
Cabin environmental monitoring sensor networks keep growing as airlines need verified air quality readings and practical cabin condition records during flight. Cost pressure and certification work can slow broader retrofit activity. Growth continues through wireless sensing nodes and connected aircraft maintenance workflows.
Certification Evidence Is Lifting System Quotes
Cabin environmental monitoring sensor network pricing is moving upward as buyers require flight ready evidence and not just sensor hardware. In September 2025, the FAA said its cabin air-quality work had completed Section 362(a) studies, issued InFO24013 for Section 362(b), and signed agreements with NASEM for Section 362(c). Its earlier test program used an FAA-owned Boeing 747 and measured bleed-air contamination with multiple sensors after oil and hydraulic-fluid injections For suppliers this situation shifts pricing toward validated sensor nodes with calibration records and data logging capabilities. Airlines that compare bids should expect a broader gap between basic sensors and certified networked cabin monitoring packages.
Airline Margin Pressure Is Reshaping Retrofit Pricing
Retrofit pricing for cabin environmental monitoring sensor networks is becoming more disciplined because airlines are protecting cash despite stronger traffic. In December 2025, IATA projected a 3.9% airline net margin for 2026, with profit per passenger at only $7.90, while non-fuel costs were forecast to reach $729 billion, up 5.8% from 2025. IATA also noted the average aircraft age would exceed 15 years as fleet renewal is constrained. This favors strong demand for cabin sensor retrofits on older aircraft fleets. It keeps sourcing focused on payback, modular installation and bundled maintenance pricing not premium hardware only quotes.
Analysis of Cabin Environmental Monitoring Sensor Networks Market By Key Countries
.webp "Top Country Growth Comparison Cabin Environmental Monitoring Sensor Networks Market Cagr (2026 2036)")
| Country | CAGR |
|---|---|
| India | 7.2% |
| China | 6.8% |
| UAE | 6.1% |
| USA | 5.3% |
| Germany | 4.6% |
Source: Future Market Insights, 2026.
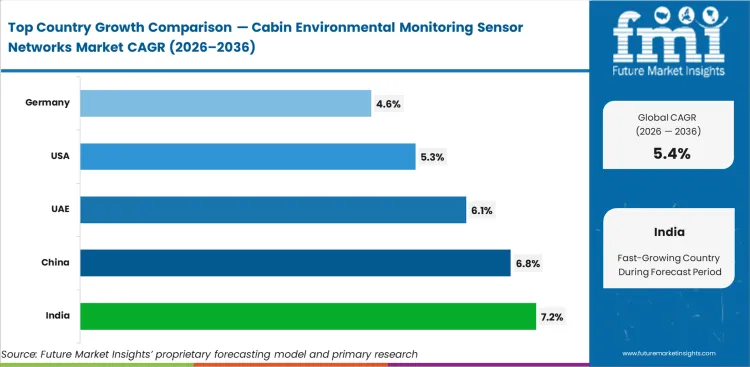
Cabin Environmental Monitoring Sensor Networks Market CAGR Analysis By Country
- India is projected to record a 7.2% CAGR through 2036, supported by airport expansion and airline fleet additions.
- China’s 6.8% CAGR is linked to domestic aviation scale and stronger quality control across local aircraft programs.
- Hub airline activity places the UAE at a 6.1% CAGR, with premium cabin service needs driving monitoring use.
- The USA is forecast at 5.3% CAGR by 2036 as mature fleets adopt selective retrofit and aircraft data systems.
- Germany’s established aerospace service base keeps the country at 4.6% CAGR, with demand centered on controlled cabin system upgrades.
Demand for cabin environmental monitoring sensor networks is forecast to rise at 5.4% CAGR from 2026 to 2036. Country-level analysis covers the major markets contributing to this forecast, with the key markets listed below.
Demand Outlook for Cabin Environmental Monitoring Sensor Networks Market in India
Cabin environmental monitoring sensor networks industry in India is projected to record a CAGR of 7.2% through 2036. India’s airport network reached 163 airports as of October 2025. This aviation base backs demand for India cabin environmental monitoring sensor networks. Local airlines can gain from sensor systems helping maintenance teams document cabin comfort conditions.
- Delhi and Mumbai trunk routes back demand for compact cabin monitoring across high-frequency aircraft use.
- Navi Mumbai airport expansion improves the long-term case for cabin upgrade planning across western India.
- UDAN airport expansion improves service access across smaller cities using regional aircraft and narrow-body routes.
Sales Analysis of Cabin Environmental Monitoring Sensor Networks Market in China
The cabin environmental monitoring sensor networks sector in China is expected to expand at a CAGR of 6.8% during the assessment period. CAAC reported 770.1468 million passenger trips in 2025 and 4,574 commercial aircraft by year-end. This aircraft base backs demand for China cabin environmental monitoring sensor networks. Testing and quality records gain value as domestic aircraft programs scale.
- Beijing and Shanghai trunk corridors increase high cabin utilization across domestic and international services.
- CAAC oversight keeps aircraft cabin equipment changes aligned with certification and airworthiness records.
- C919 fleet activity enhances local learning for electric aircraft sensors and cabin electronics integration.
Demand Outlook for Cabin Environmental Monitoring Sensor Networks Market in the United States
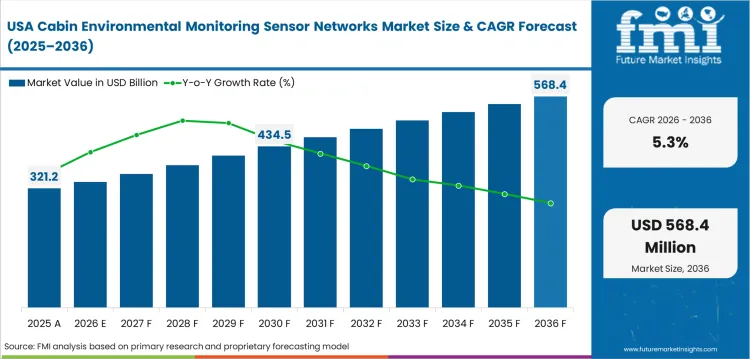
The USA cabin environmental monitoring sensor networks industry is forecast to grow at a CAGR of 5.3% by 2036. BTS reported 68.2 million systemwide scheduled passengers on USA airlines in February 2026. Airlines value certified monitoring partners with aircraft data knowledge and retrofit documentation expertise. Aging aircraft fleets drive demand for selective cabin upgrades without requiring full cabin redesign programs.
- Atlanta and Dallas-Fort Worth hub activity backs demand for cabin records across high-frequency networks.
- FAA certification discipline favors vendors with clear installation instructions and approved aircraft data methods.
- Large Boeing 737 and Airbus A320 fleets create a retrofit base for aircraft sensors learning.
Opportunity Analysis of Cabin Environmental Monitoring Sensor Networks Market in Germany
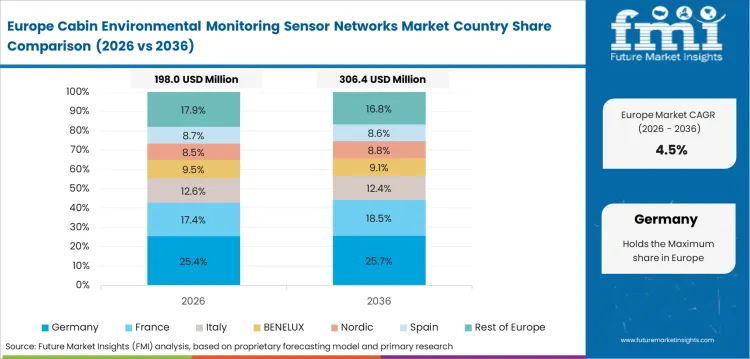
The cabin environmental monitoring sensor networks segment in Germany is projected to advance at 4.6% CAGR over the forecast years. ACI Europe reported airports in Germany posted 3.5% passenger traffic improvement in January 2026. Established MRO and engineering capacity backs demand for Germany cabin environmental monitoring sensor networks. Demand is strongest for certified cabin upgrades needing reliable documentation.
- Hamburg aircraft cabin activity backs demand for sensor-ready interior integration and retrofit planning.
- Frankfurt hub operations raise cabin comfort needs across long-haul aircraft and premium passenger flows.
- Lufthansa Technik capability strengthens aftermarket access for certified cabin monitoring upgrades.
Future Outlook for Cabin Environmental Monitoring Sensor Networks Market in the United Arab Emirates
The UAE cabin environmental monitoring sensor networks industry is expected to post 6.1% CAGR through 2036. UAE airports welcomed 75.4 million passengers during the first half of 2025. This favors demand for UAE cabin environmental monitoring sensor networks as hub airlines protect service quality. Suppliers with fast installation planning and reliable cloud dashboards can serve premium fleets.
- Dubai International hub traffic backs demand for cabin records across long-haul and transfer-heavy operations.
- Abu Dhabi aviation expansion strengthens demand for monitoring across premium aircraft cabins and new routes.
- GCAA oversight favors cabin equipment suppliers with clear approval documents and secure data handling.
Competitive Landscape and Strategic Positioning
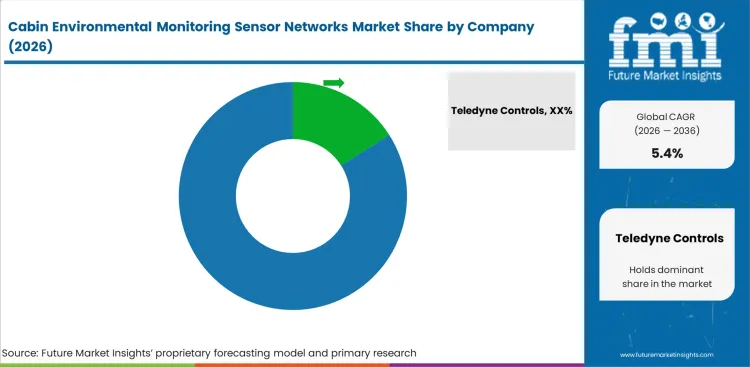
Competition in cabin environmental monitoring sensor networks is shaped by aviation electronics firms with certified sensing systems and secure aircraft data workflows. Airline selection centers on airworthiness records and cabin installation experience for reliable transfer of flight-level environmental data.
- Teledyne Controls leads through ACES cabin air monitoring and secure data transfer capability for airline maintenance teams.
- Honeywell Aerospace competes through aircraft sensing breadth and environmental control knowledge across commercial aviation programs.
- Safran Cabin competes through cabin integration access and interior system experience across commercial aircraft platforms.
- Specialist component providers strengthen the supply base through pressure and humidity sensing modules for cabin equipment makers.
Teledyne Controls holds a strong position through ACES and aviation data handling built for airline maintenance workflows. Honeywell Aerospace brings sensor breadth and aircraft systems experience across commercial aviation programs. Safran Cabin adds cabin interiors knowledge and integration access for aircraft platform work. Component specialists serve equipment makers needing dedicated sensor modules with dependable performance records.
Certification cost and documentation depth continue to limit new entrants across aircraft cabin equipment. Airlines prefer vendors able to combine environmental readings with secure transfer records in one serviceable workflow. Companies with approved modules and proven cabin integration records are better positioned to secure repeat airline programs.
Key Companies in the Cabin Environmental Monitoring Sensor Networks Market
Key global companies leading the cabin environmental monitoring sensor networks market include:
- Teledyne Controls has strong cabin air monitoring infrastructure for certified sensing and secure aircraft data transfer.
- Honeywell Aerospace serves aircraft operators through environmental control system depth and sensor integration capability.
- Safran Cabin holds a strong cabin systems position across aircraft interiors and connected service workflows.
- Amphenol Advanced Sensors supplies aerospace-grade pressure, temperature and humidity sensing components for aircraft platforms.
Competitive Benchmarking: Cabin Environmental Monitoring Sensor Networks Market
| Company | Cabin Sensing Depth | Aircraft Data Transfer | Certification Access | Geographic Footprint |
|---|---|---|---|---|
| Teledyne Controls | High | High | Strong | North America-led footprint with key operations in California and global airline customer reach |
| Honeywell Aerospace | High | High | Strong | Global footprint across North America, Europe, Asia Pacific, Middle East and Africa |
| Safran Cabin | Medium | Medium | Strong | Global cabin interiors footprint with 25 sites across 10 countries |
| Amphenol Advanced Sensors | High | Medium | Moderate | Americas, Europe and Asia presence with sites in the USA, Mexico, Brazil and China |
| Parker Meggitt | Medium | Medium | Strong | Global aerospace footprint with production plants, research facilities, service centers and sales offices worldwide |
| Collins Aerospace | Medium | High | Strong | Global presence across North America, Europe, Asia Pacific and other major aerospace regions |
| Liebherr-Aerospace | Medium | Medium | Strong | Worldwide aerospace and transport systems footprint across Europe, North America and Asia |
Source: Future Market Insights, 2026.
Key Developments in Cabin Environmental Monitoring Sensor Networks Market
- In April 2026, Sensirion announced global availability of the SEN62 environmental sensing platform. The compact module measures particulate matter, humidity, and temperature, while its factory-calibrated output and onboard algorithms reduce integration work for air quality monitors, HVAC systems, and connected environmental sensing nodes. This is relevant to cabin environmental monitoring sensor networks because compact PM and climate sensing modules support distributed cabin-level air quality tracking.
- In March 2026, Honeywell, Boeing, and the University of Reading announced Project MIST to develop aircraft-based sensing for contrail forecasting and weather modelling. The work is relevant to cabin environmental monitoring sensor networks because aircraft-grade humidity and temperature sensing supports broader in-flight environmental data architectures.
Key Players in the Cabin Environmental Monitoring Sensor Networks Market
Major Global Players:
- Teledyne Controls
- Honeywell Aerospace
- Safran Cabin
- Collins Aerospace
- Parker Meggitt
- Liebherr-Aerospace
- Amphenol Advanced Sensors
Report Scope and Coverage
| Parameter | Details |
|---|---|
| Quantitative Units | USD 0.9 billion to USD 1.4 billion, at a CAGR of 5.4% |
| Market Definition | The cabin environmental monitoring sensor networks market encompasses connected aircraft cabin systems used to assess air quality and comfort conditions during flight. |
| Regions Covered | North America, Latin America, Europe, East Asia, South Asia and Pacific, Middle East and Africa |
| Countries Covered | USA, Germany, China, India, UAE and 30 plus countries |
| Key Companies Profiled | Teledyne Controls, Honeywell Aerospace, Safran Cabin, Collins Aerospace and Amphenol Advanced Sensors |
| Forecast Period | 2026 to 2036 |
| Approach | Hybrid bottom-up and top-down methodology starting with sensor use and verified aviation operating patterns. |
Cabin Environmental Monitoring Sensor Networks Market by Segments
Cabin Environmental Monitoring Sensor Networks Market Segmented by Sensor Type:
- CO2 Sensors
- VOC Sensors
- Humidity Sensors
- Pressure Sensors
- Temperature Sensors
- Particulate Sensors
Cabin Environmental Monitoring Sensor Networks Market Segmented by Network Architecture:
- Wireless Nodes
- Wired Networks
- Hybrid Networks
- Gateway Units
- Cloud Dashboards
Cabin Environmental Monitoring Sensor Networks Market Segmented by Aircraft Class:
- Narrow-body Aircraft
- Wide-body Aircraft
- Regional Jets
- Business Jets
- Helicopters
Cabin Environmental Monitoring Sensor Networks Market Segmented by Installation Channel:
- OEM Fitment
- Retrofit Kits
- Line Maintenance
- Cabin Upgrade
Cabin Environmental Monitoring Sensor Networks Market Segmented by End User:
- Airlines
- Aircraft OEMs
- MRO Providers
- Business Aviation
- Defense Operators
Cabin Environmental Monitoring Sensor Networks Market Segmented by Region:
- North America
- USA
- Canada
- Mexico
- Latin America
- Brazil
- Chile
- Rest of Latin America
- Europe
- Germany
- UK
- Italy
- Spain
- France
- Rest of Europe
- East Asia
- China
- Japan
- South Korea
- South Asia and Pacific
- India
- ASEAN
- Australia & New Zealand
- Rest of South Asia and Pacific
- Middle East and Africa
- Saudi Arabia
- Other GCC Countries
- South Africa
- Rest of Middle East and Africa
Research Sources and Bibliography
- International Air Transport Association. (2026, January). Passenger demand data.
- Airports Council International. (2026, January). Airport traffic forecasts.
- India Brand Equity Foundation. (2026). Indian aviation sector.
- Civil Aviation Administration of China. (2026, April). Civil aviation bulletin.
- Bureau of Transportation Statistics. (2026, May). USA airline traffic data.
- Airports Council International Europe. (2026, March). January airport traffic.
- Emirates News Agency. (2025, August). UAE airport traffic.
- Teledyne Controls. (2026). ACES aircraft cabin environment sensor.
- Teledyne Technologies. (2024 to 2025). eADL XS aircraft certifications. Boeing 737NG certification and Airbus A320 aircraft family certification
- Honeywell Aerospace. (2026, March). Project MIST sensing collaboration.
- Safran. (2025, June). Predictive maintenance services.
- American Society of Heating, Refrigerating and Air-Conditioning Engineers. (2024). ANSI/ASHRAE Standard 161-2024: Air quality within commercial aircraft.
- Federal Aviation Administration. (2025, September 4). Cabin air quality.
- Safran. (2025, June 18). Safran’s customers are signing up for its predictive maintenance services.
- Teledyne Controls. (2026). ACES: Aircraft cabin environment sensor.
- Sensirion AG. (2026, April 21). Sensirion announces global availability of the environmental sensing platform SEN62. Sensirion announces global availability of the environmental...
- Senseair AB. (2026, January 9). S12 CO₂ - New Product Announcement. S12 CO₂ | Ultra-Compact True NDIR CO₂ Sensor
- International Air Transport Association. (2025, December 9). Airline Profitability Stabilizes with 3.9% Net Margin Expected in 2026. IATA - Airline Profitability Stabilizes with 3.9% Net Margin Expected in 2026
- Federal Aviation Administration. (2025, September 4). Cabin Air Quality. USA Department of Transportation. Cabin Air Quality | Federal Aviation Administration
This bibliography is provided for reader reference and is not exhaustive. The full report contains the complete reference list and detailed citations.
Frequently Asked Questions
What is the global market demand for Cabin Environmental Monitoring Sensor Networks in 2026?
In 2026, the global market for cabin environmental monitoring sensor networks is expected to be worth USD 0.9 billion.
How big will the market for Cabin Environmental Monitoring Sensor Networks be in 2036?
By 2036, the market for cabin environmental monitoring sensor networks is expected to be worth USD 1.4 billion.
How much is demand for Cabin Environmental Monitoring Sensor Networks expected to expand between 2026 and 2036?
Between 2026 and 2036, demand for cabin environmental monitoring sensor networks is expected to expand at a CAGR of 5.4%.
Which sensor type segment is expected to lead globally by 2026?
CO2 sensors are expected to contribute 31.0% of the sensor type segment in 2026.
What is causing demand to rise in India?
The India cabin environmental monitoring sensor networks market is projected to record 7.2% CAGR through 2036, backed by airport expansion and airline fleet additions.
What is causing demand to rise in China?
The China cabin environmental monitoring sensor networks market is projected to expand at 6.8% CAGR through 2036, backed by domestic aviation scale and aircraft programs.
What does this report mean by Cabin Environmental Monitoring Sensor Networks Market definition?
The cabin environmental monitoring sensor networks market includes connected aircraft cabin sensors used to assess air quality and comfort conditions during flight.
Preview the report firsthand - request a free sample
Get SampleGet the brochure for pricing and purchase details.
Get PDFTable of Content
- Executive Summary
- Global Market Outlook
- Demand-side Trends
- Supply-side Trends
- Technology Roadmap Analysis
- Analysis and Recommendations
- Market Overview
- Market Coverage / Taxonomy
- Market Definition / Scope / Limitations
- Research Methodology
- Chapter Orientation
- Analytical Lens and Working Hypotheses
- Market Structure, Signals, and Trend Drivers
- Benchmarking and Cross-market Comparability
- Market Sizing, Forecasting, and Opportunity Mapping
- Research Design and Evidence Framework
- Desk Research Programme (Secondary Evidence)
- Company Annual and Sustainability Reports
- Peer-reviewed Journals and Academic Literature
- Corporate Websites, Product Literature, and Technical Notes
- Earnings Decks and Investor Briefings
- Statutory Filings and Regulatory Disclosures
- Technical White Papers and Standards Notes
- Trade Journals, Industry Magazines, and Analyst Briefs
- Conference Proceedings, Webinars, and Seminar Materials
- Government Statistics Portals and Public Data Releases
- Press Releases and Reputable Media Coverage
- Specialist Newsletters and Curated Briefings
- Sector Databases and Reference Repositories
- FMI Internal Proprietary Databases and Historical Market Datasets
- Subscription Datasets and Paid Sources
- Social Channels, Communities, and Digital Listening Inputs
- Additional Desk Sources
- Expert Input and Fieldwork (Primary Evidence)
- Primary Modes
- Qualitative Interviews and Expert Elicitation
- Quantitative Surveys and Structured Data Capture
- Blended Approach
- Why Primary Evidence is Used
- Field Techniques
- Interviews
- Surveys
- Focus Groups
- Observational and In-context Research
- Social and Community Interactions
- Stakeholder Universe Engaged
- C-suite Leaders
- Board Members
- Presidents and Vice Presidents
- R&D and Innovation Heads
- Technical Specialists
- Domain Subject-matter Experts
- Scientists
- Physicians and Other Healthcare Professionals
- Governance, Ethics, and Data Stewardship
- Research Ethics
- Data Integrity and Handling
- Primary Modes
- Tooling, Models, and Reference Databases
- Desk Research Programme (Secondary Evidence)
- Data Engineering and Model Build
- Data Acquisition and Ingestion
- Cleaning, Normalisation, and Verification
- Synthesis, Triangulation, and Analysis
- Quality Assurance and Audit Trail
- Market Background
- Market Dynamics
- Drivers
- Restraints
- Opportunity
- Trends
- Scenario Forecast
- Demand in Optimistic Scenario
- Demand in Likely Scenario
- Demand in Conservative Scenario
- Opportunity Map Analysis
- Product Life Cycle Analysis
- Supply Chain Analysis
- Investment Feasibility Matrix
- Value Chain Analysis
- PESTLE and Porter’s Analysis
- Regulatory Landscape
- Regional Parent Market Outlook
- Production and Consumption Statistics
- Import and Export Statistics
- Market Dynamics
- Global Market Analysis 2021 to 2025 and Forecast, 2026 to 2036
- Historical Market Size Value (USD Million) Analysis, 2021 to 2025
- Current and Future Market Size Value (USD Million) Projections, 2026 to 2036
- Y-o-Y Growth Trend Analysis
- Absolute $ Opportunity Analysis
- Global Market Pricing Analysis 2021 to 2025 and Forecast 2026 to 2036
- Global Market Analysis 2021 to 2025 and Forecast 2026 to 2036, By Sensor Type
- Introduction / Key Findings
- Historical Market Size Value (USD Million) Analysis By Sensor Type , 2021 to 2025
- Current and Future Market Size Value (USD Million) Analysis and Forecast By Sensor Type , 2026 to 2036
- CO2 Sensors
- VOC Sensors
- Humidity Sensors
- CO2 Sensors
- Y-o-Y Growth Trend Analysis By Sensor Type , 2021 to 2025
- Absolute $ Opportunity Analysis By Sensor Type , 2026 to 2036
- Global Market Analysis 2021 to 2025 and Forecast 2026 to 2036, By Network Architecture
- Introduction / Key Findings
- Historical Market Size Value (USD Million) Analysis By Network Architecture, 2021 to 2025
- Current and Future Market Size Value (USD Million) Analysis and Forecast By Network Architecture, 2026 to 2036
- Wireless Nodes
- Wired Networks
- Hybrid Networks
- Wireless Nodes
- Y-o-Y Growth Trend Analysis By Network Architecture, 2021 to 2025
- Absolute $ Opportunity Analysis By Network Architecture, 2026 to 2036
- Global Market Analysis 2021 to 2025 and Forecast 2026 to 2036, By Aircraft Class
- Introduction / Key Findings
- Historical Market Size Value (USD Million) Analysis By Aircraft Class, 2021 to 2025
- Current and Future Market Size Value (USD Million) Analysis and Forecast By Aircraft Class, 2026 to 2036
- Narrow-body Aircraft
- Wide-body Aircraft
- Regional Jets
- Narrow-body Aircraft
- Y-o-Y Growth Trend Analysis By Aircraft Class, 2021 to 2025
- Absolute $ Opportunity Analysis By Aircraft Class, 2026 to 2036
- Global Market Analysis 2021 to 2025 and Forecast 2026 to 2036, By Installation Channel
- Introduction / Key Findings
- Historical Market Size Value (USD Million) Analysis By Installation Channel, 2021 to 2025
- Current and Future Market Size Value (USD Million) Analysis and Forecast By Installation Channel, 2026 to 2036
- OEM Fitment
- Retrofit Kits
- Line Maintenance
- OEM Fitment
- Y-o-Y Growth Trend Analysis By Installation Channel, 2021 to 2025
- Absolute $ Opportunity Analysis By Installation Channel, 2026 to 2036
- Global Market Analysis 2021 to 2025 and Forecast 2026 to 2036, By End User
- Introduction / Key Findings
- Historical Market Size Value (USD Million) Analysis By End User, 2021 to 2025
- Current and Future Market Size Value (USD Million) Analysis and Forecast By End User, 2026 to 2036
- Airlines
- Aircraft OEMs
- MRO Providers
- Airlines
- Y-o-Y Growth Trend Analysis By End User, 2021 to 2025
- Absolute $ Opportunity Analysis By End User, 2026 to 2036
- Global Market Analysis 2021 to 2025 and Forecast 2026 to 2036, By Region
- Introduction
- Historical Market Size Value (USD Million) Analysis By Region, 2021 to 2025
- Current Market Size Value (USD Million) Analysis and Forecast By Region, 2026 to 2036
- North America
- Latin America
- Western Europe
- Eastern Europe
- East Asia
- South Asia and Pacific
- Middle East & Africa
- Market Attractiveness Analysis By Region
- North America Market Analysis 2021 to 2025 and Forecast 2026 to 2036, By Country
- Historical Market Size Value (USD Million) Trend Analysis By Market Taxonomy, 2021 to 2025
- Market Size Value (USD Million) Forecast By Market Taxonomy, 2026 to 2036
- By Country
- USA
- Canada
- Mexico
- By Sensor Type
- By Network Architecture
- By Aircraft Class
- By Installation Channel
- By End User
- By Country
- Market Attractiveness Analysis
- By Country
- By Sensor Type
- By Network Architecture
- By Aircraft Class
- By Installation Channel
- By End User
- Key Takeaways
- Latin America Market Analysis 2021 to 2025 and Forecast 2026 to 2036, By Country
- Historical Market Size Value (USD Million) Trend Analysis By Market Taxonomy, 2021 to 2025
- Market Size Value (USD Million) Forecast By Market Taxonomy, 2026 to 2036
- By Country
- Brazil
- Chile
- Rest of Latin America
- By Sensor Type
- By Network Architecture
- By Aircraft Class
- By Installation Channel
- By End User
- By Country
- Market Attractiveness Analysis
- By Country
- By Sensor Type
- By Network Architecture
- By Aircraft Class
- By Installation Channel
- By End User
- Key Takeaways
- Western Europe Market Analysis 2021 to 2025 and Forecast 2026 to 2036, By Country
- Historical Market Size Value (USD Million) Trend Analysis By Market Taxonomy, 2021 to 2025
- Market Size Value (USD Million) Forecast By Market Taxonomy, 2026 to 2036
- By Country
- Germany
- UK
- Italy
- Spain
- France
- Nordic
- BENELUX
- Rest of Western Europe
- By Sensor Type
- By Network Architecture
- By Aircraft Class
- By Installation Channel
- By End User
- By Country
- Market Attractiveness Analysis
- By Country
- By Sensor Type
- By Network Architecture
- By Aircraft Class
- By Installation Channel
- By End User
- Key Takeaways
- Eastern Europe Market Analysis 2021 to 2025 and Forecast 2026 to 2036, By Country
- Historical Market Size Value (USD Million) Trend Analysis By Market Taxonomy, 2021 to 2025
- Market Size Value (USD Million) Forecast By Market Taxonomy, 2026 to 2036
- By Country
- Russia
- Poland
- Hungary
- Balkan & Baltic
- Rest of Eastern Europe
- By Sensor Type
- By Network Architecture
- By Aircraft Class
- By Installation Channel
- By End User
- By Country
- Market Attractiveness Analysis
- By Country
- By Sensor Type
- By Network Architecture
- By Aircraft Class
- By Installation Channel
- By End User
- Key Takeaways
- East Asia Market Analysis 2021 to 2025 and Forecast 2026 to 2036, By Country
- Historical Market Size Value (USD Million) Trend Analysis By Market Taxonomy, 2021 to 2025
- Market Size Value (USD Million) Forecast By Market Taxonomy, 2026 to 2036
- By Country
- China
- Japan
- South Korea
- By Sensor Type
- By Network Architecture
- By Aircraft Class
- By Installation Channel
- By End User
- By Country
- Market Attractiveness Analysis
- By Country
- By Sensor Type
- By Network Architecture
- By Aircraft Class
- By Installation Channel
- By End User
- Key Takeaways
- South Asia and Pacific Market Analysis 2021 to 2025 and Forecast 2026 to 2036, By Country
- Historical Market Size Value (USD Million) Trend Analysis By Market Taxonomy, 2021 to 2025
- Market Size Value (USD Million) Forecast By Market Taxonomy, 2026 to 2036
- By Country
- India
- ASEAN
- Australia & New Zealand
- Rest of South Asia and Pacific
- By Sensor Type
- By Network Architecture
- By Aircraft Class
- By Installation Channel
- By End User
- By Country
- Market Attractiveness Analysis
- By Country
- By Sensor Type
- By Network Architecture
- By Aircraft Class
- By Installation Channel
- By End User
- Key Takeaways
- Middle East & Africa Market Analysis 2021 to 2025 and Forecast 2026 to 2036, By Country
- Historical Market Size Value (USD Million) Trend Analysis By Market Taxonomy, 2021 to 2025
- Market Size Value (USD Million) Forecast By Market Taxonomy, 2026 to 2036
- By Country
- Kingdom of Saudi Arabia
- Other GCC Countries
- Turkiye
- South Africa
- Other African Union
- Rest of Middle East & Africa
- By Sensor Type
- By Network Architecture
- By Aircraft Class
- By Installation Channel
- By End User
- By Country
- Market Attractiveness Analysis
- By Country
- By Sensor Type
- By Network Architecture
- By Aircraft Class
- By Installation Channel
- By End User
- Key Takeaways
- Key Countries Market Analysis
- USA
- Pricing Analysis
- Market Share Analysis, 2025
- By Sensor Type
- By Network Architecture
- By Aircraft Class
- By Installation Channel
- By End User
- Canada
- Pricing Analysis
- Market Share Analysis, 2025
- By Sensor Type
- By Network Architecture
- By Aircraft Class
- By Installation Channel
- By End User
- Mexico
- Pricing Analysis
- Market Share Analysis, 2025
- By Sensor Type
- By Network Architecture
- By Aircraft Class
- By Installation Channel
- By End User
- Brazil
- Pricing Analysis
- Market Share Analysis, 2025
- By Sensor Type
- By Network Architecture
- By Aircraft Class
- By Installation Channel
- By End User
- Chile
- Pricing Analysis
- Market Share Analysis, 2025
- By Sensor Type
- By Network Architecture
- By Aircraft Class
- By Installation Channel
- By End User
- Germany
- Pricing Analysis
- Market Share Analysis, 2025
- By Sensor Type
- By Network Architecture
- By Aircraft Class
- By Installation Channel
- By End User
- UK
- Pricing Analysis
- Market Share Analysis, 2025
- By Sensor Type
- By Network Architecture
- By Aircraft Class
- By Installation Channel
- By End User
- Italy
- Pricing Analysis
- Market Share Analysis, 2025
- By Sensor Type
- By Network Architecture
- By Aircraft Class
- By Installation Channel
- By End User
- Spain
- Pricing Analysis
- Market Share Analysis, 2025
- By Sensor Type
- By Network Architecture
- By Aircraft Class
- By Installation Channel
- By End User
- France
- Pricing Analysis
- Market Share Analysis, 2025
- By Sensor Type
- By Network Architecture
- By Aircraft Class
- By Installation Channel
- By End User
- India
- Pricing Analysis
- Market Share Analysis, 2025
- By Sensor Type
- By Network Architecture
- By Aircraft Class
- By Installation Channel
- By End User
- ASEAN
- Pricing Analysis
- Market Share Analysis, 2025
- By Sensor Type
- By Network Architecture
- By Aircraft Class
- By Installation Channel
- By End User
- Australia & New Zealand
- Pricing Analysis
- Market Share Analysis, 2025
- By Sensor Type
- By Network Architecture
- By Aircraft Class
- By Installation Channel
- By End User
- China
- Pricing Analysis
- Market Share Analysis, 2025
- By Sensor Type
- By Network Architecture
- By Aircraft Class
- By Installation Channel
- By End User
- Japan
- Pricing Analysis
- Market Share Analysis, 2025
- By Sensor Type
- By Network Architecture
- By Aircraft Class
- By Installation Channel
- By End User
- South Korea
- Pricing Analysis
- Market Share Analysis, 2025
- By Sensor Type
- By Network Architecture
- By Aircraft Class
- By Installation Channel
- By End User
- Russia
- Pricing Analysis
- Market Share Analysis, 2025
- By Sensor Type
- By Network Architecture
- By Aircraft Class
- By Installation Channel
- By End User
- Poland
- Pricing Analysis
- Market Share Analysis, 2025
- By Sensor Type
- By Network Architecture
- By Aircraft Class
- By Installation Channel
- By End User
- Hungary
- Pricing Analysis
- Market Share Analysis, 2025
- By Sensor Type
- By Network Architecture
- By Aircraft Class
- By Installation Channel
- By End User
- Kingdom of Saudi Arabia
- Pricing Analysis
- Market Share Analysis, 2025
- By Sensor Type
- By Network Architecture
- By Aircraft Class
- By Installation Channel
- By End User
- Turkiye
- Pricing Analysis
- Market Share Analysis, 2025
- By Sensor Type
- By Network Architecture
- By Aircraft Class
- By Installation Channel
- By End User
- South Africa
- Pricing Analysis
- Market Share Analysis, 2025
- By Sensor Type
- By Network Architecture
- By Aircraft Class
- By Installation Channel
- By End User
- USA
- Market Structure Analysis
- Competition Dashboard
- Competition Benchmarking
- Market Share Analysis of Top Players
- By Regional
- By Sensor Type
- By Network Architecture
- By Aircraft Class
- By Installation Channel
- By End User
- Competition Analysis
- Competition Deep Dive
- Teledyne Controls
- Overview
- Product Portfolio
- Profitability by Market Segments (Product/Age /Sales Channel/Region)
- Sales Footprint
- Strategy Overview
- Marketing Strategy
- Product Strategy
- Channel Strategy
- Honeywell Aerospace
- Safran Cabin
- Collins Aerospace
- Parker Meggitt
- Liebherr-Aerospace
- Teledyne Controls
- Competition Deep Dive
- Assumptions & Acronyms Used


