

- Market Size (2026)
- USD 1.2 Bn
- Forecast (2036)
- USD 2.5 Bn
- CAGR (2026 to 2036)
- 7.6%
Cabin Data Integration and Analytics Platforms Market Size, Market Forecast and Outlook By FMI
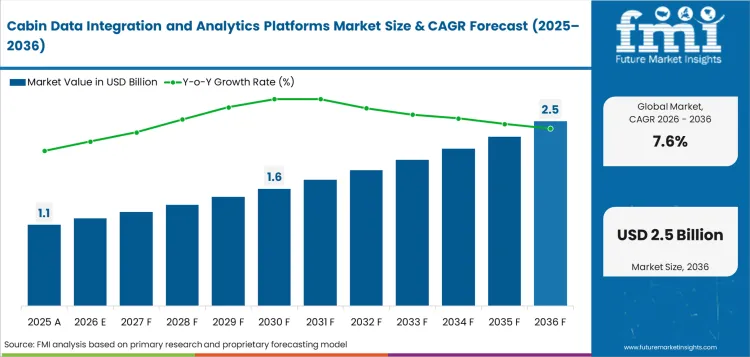
The cabin data integration and analytics platforms market was valued at USD 1.1 billion in 2025. Market revenue is projected to reach USD 1.2 billion in 2026 and is projected to reach USD 2.5 billion by 2036 at 7.6% CAGR. Airlines are projected to represent 72.4% share of end user demand in 2026. Narrow body aircraft are projected to account for 61.8% share of aircraft type in 2026.
Summary of Cabin Data Integration and Analytics Platforms Market
- Demand and Growth Drivers
- Connected cabin programs produce more data from entertainment systems and crew devices across each flight cycle.
- Airline service teams need faster fault tracing as cabin equipment failures affect passenger experience and aircraft turnaround.
- Aircraft makers are building open data paths so cabin applications can work across linefit and retrofit fleets.
- Product and Segment View
- Airlines are projected to account for 72.4% share in 2026, driven by carriers owning cabin service rules and data decisions.
- Narrow body aircraft are expected to capture 61.8% share in 2026 due to short haul fleets generating frequent cabin events.
- Analytics suites are forecast to represent 36.9% share in 2026 since managers prefer dashboards over raw data files.
- Geography and Competitive Outlook
- China demand is projected to record 8.8% CAGR by 2036, influenced by airport throughput supporting connected cabin service tools.
- India demand is expected to expand at 8.5% CAGR by 2036 since domestic flight activity raises cabin event volume.
- Panasonic Avionics and Thales Group anchor supply based on onboard hosting and cabin software depth.
- Analyst Opinion
- Nikhil Kaitwade, Principal Consultant for Automotive at FMI, observes, "Cabin data platforms are becoming the central control system of connected aircraft. Airlines pay for fewer manual checks and faster crew decisions. Suppliers need open interfaces before carriers trust a platform across mixed fleets. Audit-ready data handling is part of that trust."
- Cabin Data Integration and Analytics Platforms Market Value Analysis
- Market value is tied to fleets using aviation analytics to connect cabin faults with passenger service outcomes.
- Supplier pricing reflects onboard hosting hardware and data integration software that airline teams can use after each flight.
- Revenue rises beyond cabin hardware as aircraft interface devices collect system data and move it into airline workflows.
- Cloud hosted platforms gain value as aviation cloud tools let operators compare cabin service patterns across routes.
Key Takeaways, Market Size, and Forecast
- The cabin data integration and analytics platforms market size stood at USD 1.1 billion in 2025.
- Market value is projected to reach USD 2.5 billion by 2036 as connected cabins turn aircraft data into service decisions.
- From 2026 to 2036, the sector is projected to expand at 7.6% CAGR.
- Industry revenue is forecast to create incremental opportunity of USD 1.3 billion from 2026 to 2036.
- Airlines are expected to account for 72.4% share of end user demand in 2026.
- Narrow body aircraft are expected to account for 61.8% share of aircraft type in 2026.
- China leads the country set at a projected 8.8% CAGR, followed by India at 8.5% CAGR by 2036.
Cabin reliability is harder to manage as digital seats and entertainment screens generate more signals during every flight. Crew tools add another stream of service data that airlines must sort before the aircraft turns. Onboard computing works as the first filter for this data. Kontron’s April 2026 Ace Flight 4609 pairs a 14-core Intel i7 processor with 64 GB DDR5 memory for connected aircraft applications. Airlines are likely to treat server capacity as part of the service decision chain.
Security approval is anticipated to be the next step. Federal Aviation Administration proposed in August 2024, aircraft systems and networks must be protected from unauthorized electronic interactions affecting safety. Suppliers with clear security files will face fewer barriers in airline trials. Passenger experience tools are entering the same data path. Delta’s January 2025 cloud-based seatback platform included 96-terabyte storage and recommendation features. Cabin analytics platforms are expected to gain value after turning onboard signals into repair actions and service planning.
Cabin Data Integration and Analytics Platforms Market Definition
Cabin data integration and analytics platforms are software and onboard systems that collect non-safety cabin data from aircraft interiors and service equipment. Scope covers data hubs and analytics suites used by airlines to read cabin health and crew service events. Scope includes crew applications tied to IoT in aviation sensors and connected service equipment. Revenue includes platform software and onboard data integration sold for new aircraft programs and retrofit fleets.
Cabin Data Integration and Analytics Platforms Market Inclusions
Scope includes platforms collecting cabin system status and passenger service data from connected interiors. Scope also includes onboard data hubs and crew apps that connect seat functions with service records. Cabin data modules used in aircraft cabin interiors are included if data capture and analytics form part of the supplied package. Integration work sold with airline dashboards is counted only if the software has a cabin operations role.
Cabin Data Integration and Analytics Platforms Market Exclusions
Scope excludes standalone entertainment content and simple Wi-Fi access sold without cabin data tools. Pure cockpit flight analytics are excluded unless cabin service data is part of the same product. Basic cabin hardware and aircraft seats are excluded unless analytics software is supplied with the cabin data path. Airport passenger systems and booking tools are excluded from the revenue scope.
Cabin Data Integration and Analytics Platforms Market Research Methodology
- Primary Research: Future Market Insights analysts reviewed airline digital cabin needs and supplier fit across onboard hosting platforms.
- Desk Research: Public aviation traffic data and company disclosures supported checks against aviation test equipment and aircraft cabin systems.
- Market Sizing and Forecasting: Forecasting used aircraft fleet size and connected cabin attachment rates. Software value adjustments align pricing by aircraft type.
- Data Validation: Checks compared 2026 value with 2036 value and tested CAGR consistency. Country rates were reviewed against traffic scale and supplier activity.
Why is the Cabin Data Integration and Analytics Platforms Market Growing?
- Airlines are moving cabin data into fleet planning as service issues need quicker review between aircraft rotations.
- Connected aircraft programs are driving demand for platforms linking cabin systems with airline service workflows.
- Digital cabin demand is rising as operators need cleaner fault records before aircraft return to service.
Cabin data integration and analytics platforms are expected to gain wider use as airlines move from manual cabin checks toward connected service decisions. International Air Transport Association forecast in December 2025 that passenger traffic will rise 4.9% in 2026, led by 7.3% growth in Asia Pacific. Higher aircraft use increases the value of systems sorting cabin faults before ground teams inspect the aircraft. Airbus stated in October 2025 that digital and connectivity services are expected to rise from USD 9.0 billion in 2025 to USD 26.0 billion by 2044. Such outlook supports a stronger buying case for cabin analytics platforms, since airlines need connected tools linking service events with maintenance planning and passenger experience work.
Market Segmentation Analysis
- Analytics suites are forecast to capture 36.9% share in 2026, led by airlines needing usable dashboards instead of raw system logs.
- Cloud hosted systems are expected to represent 54.7% share in 2026 due to cross-route comparisons across aircraft and crews.
- Narrow body aircraft are projected to account for 61.8% share in 2026, reflecting high flight cycles and frequent cabin events.
- Cabin operations applications are expected to represent 38.6% share in 2026, driven by service task and fault data needs.
- Airlines are projected to account for 72.4% share in 2026, since carriers control cabin service rules and data use.
Segmentation is divided into five parent groups based on how airline teams buy and use cabin data. Platform type separates analytics suites from data hubs and crew apps. Deployment model separates cloud hosted systems from onboard edge systems and hybrid systems. Aircraft type reflects flight cycle volume and cabin data volume. Application separates cabin operations from passenger experience and retail analytics. End user shows whether airlines or aircraft makers control the buying decision. Adjacent commercial cabin interiors programs shape integration needs during cabin refresh cycles.
Insights into Cabin Data Integration and Analytics Platforms Market by Platform Type
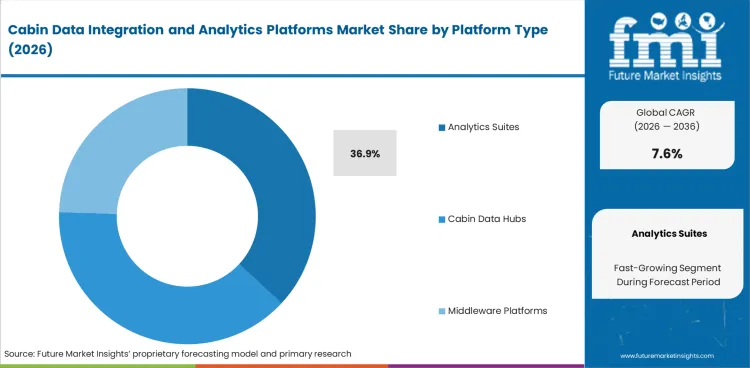
- Analytics suites are projected to account for 36.9% share in 2026 due to airline managers needing clean views of cabin faults and service delays.
- Cabin data hubs add value for fleets collecting signals from entertainment servers and lighting controllers before data reaches ground systems.
Insights into Cabin Data Integration and Analytics Platforms Market by Deployment Model
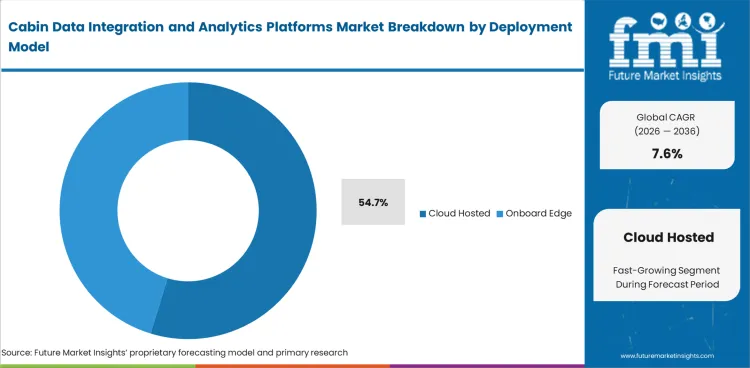
- Cloud hosted systems are expected to represent 54.7% share in 2026 since airlines compare service patterns across aircraft and routes.
- Onboard edge systems gain use in aircraft requiring local processing before cabin data moves through connectivity links.
Insights into Cabin Data Integration and Analytics Platforms Market by Aircraft Type
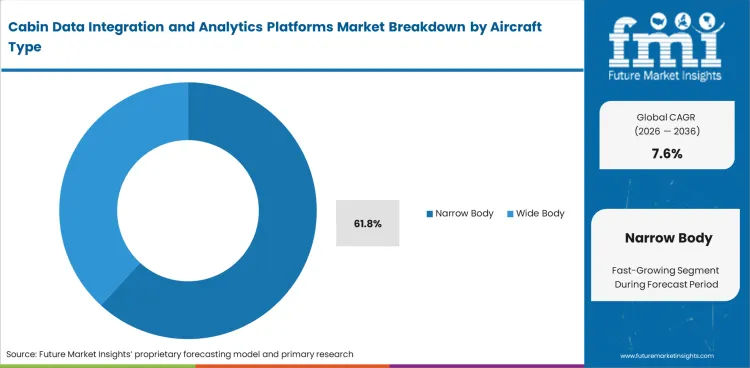
- Narrow body aircraft are forecast to account for 61.8% share in 2026, driven by short haul fleets producing frequent cabin service events.
- Wide body aircraft support higher value per shipset as premium cabins seeking deeper service monitoring and passenger experience data.
Insights into Cabin Data Integration and Analytics Platforms Market by Application
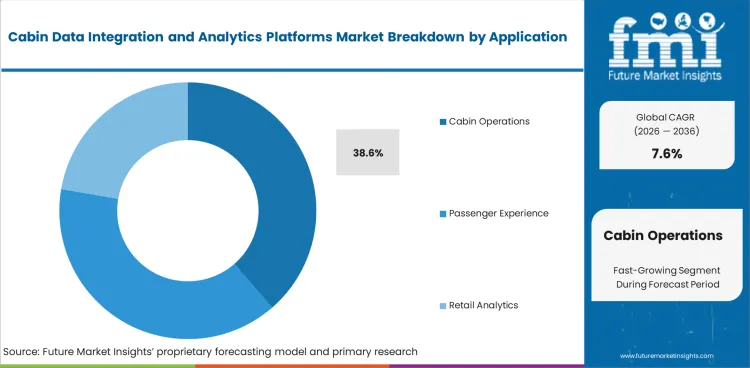
- Cabin operations are projected to account for 38.6% share in 2026, led by airlines focusing first on crew tasks and fault tracking.
- Passenger experience analytics expand as airlines connect service timing with entertainment use and seat function records.
Insights into Cabin Data Integration and Analytics Platforms Market by End User
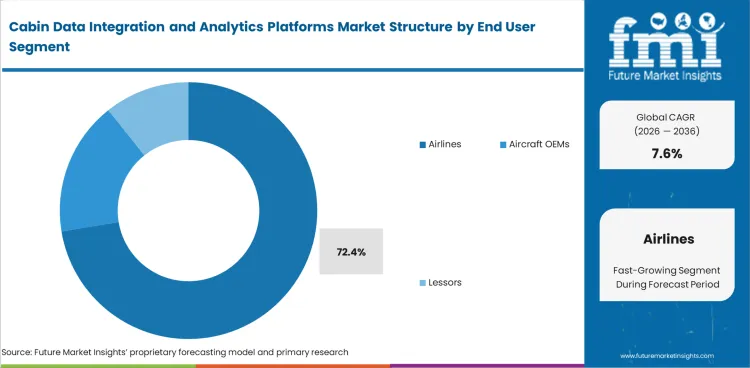
- Airlines are expected to account for 72.4% share in 2026 as carriers own route service rules and cabin repair decisions.
- Aircraft OEMs support early integration since connected cabin architecture moves into linefit programs and standard data interfaces.
Cabin Data Integration and Analytics Platforms Market Drivers, Restraints and Opportunities
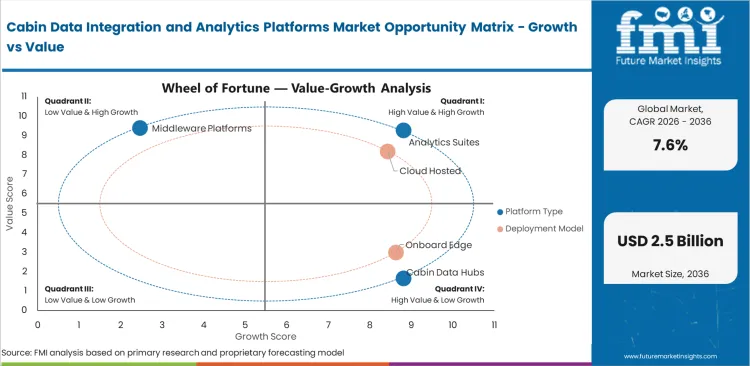
- Connected cabin architecture is raising demand for platforms that turn cabin equipment signals into airline service decisions.
- Mixed fleet software and data consistency issues limit supplier access across aircraft programs.
- Retrofit and cabin refresh work generates scope for analytics platforms linked with service records.
Cabin data integration and analytics platforms are expected to gain traction as busier flight networks make cabin reliability harder to manage through manual checks. Airports Council International reported in April 2026, international passenger traffic reached 4.0 billion in 2025, up 5.9% from 2024 and 8.3% above 2019. Higher traffic increases repeated cabin events across aircraft turns, strengthening demand for platforms sorting faults before delay costs build. Boston Consulting Group reported in October 2025, around 70% of surveyed airlines plan to invest in platforms supporting data capture and operational use cases. European Union Aviation Safety Agency’s December 2025 information security rules add another filter, as connected cabin suppliers must prove controlled data handling before airlines expand fleetwide use.
Import Dependence and Trade Flow Analysis
Cabin data integration and analytics platforms will remain tied to cross-border aerospace equipment flows, since airlines often buy cabin data tools alongside aircraft systems and maintenance packages. United States International Trade Administration reported in April 2026, India’s total aerospace imports reached USD 13,912 million in 2024, while USA aerospace exports to India reached USD 3,009 million. This supports a trade-driven opportunity for suppliers offering cabin data modules and analytics software that can move through certified aerospace supply routes. India’s uniform 5% tax rate on aircraft and engine parts also improves repair and re-import conditions, supporting retrofit-linked cabin data upgrades.
Installed Base and Replacement Cycle Analysis
Cabin data integration and analytics platforms are expected to gain value as airlines modernize aircraft service systems during fleet renewal and maintenance cycles. Boeing’s 2025 Commercial Services Market Outlook estimates the commercial aviation support and services pool at USD 4.7 trillion between 2025 and 2044, with digital solutions and analytics included in the service mix. This makes cabin analytics a practical upgrade area, as airlines can add data tools during maintenance and cabin refresh work instead of waiting for full aircraft replacement. The outlook also points to a larger service-backed installed base, influencing steady demand for platforms extending older cabin systems into connected airline workflows.
Analysis of Cabin Data Integration and Analytics Platforms Market by Key Countries
.webp "Top Country Growth Comparison Cabin Data Integration And Analytics Platforms Market Cagr (2026 2036)")
| Country | CAGR |
|---|---|
| China | 8.8% |
| India | 8.5% |
| United States | 7.9% |
| United Kingdom | 7.4% |
| France | 7.1% |
| Germany | 6.8% |
| Japan | 6.5% |
Source: Future Market Insights, 2026.
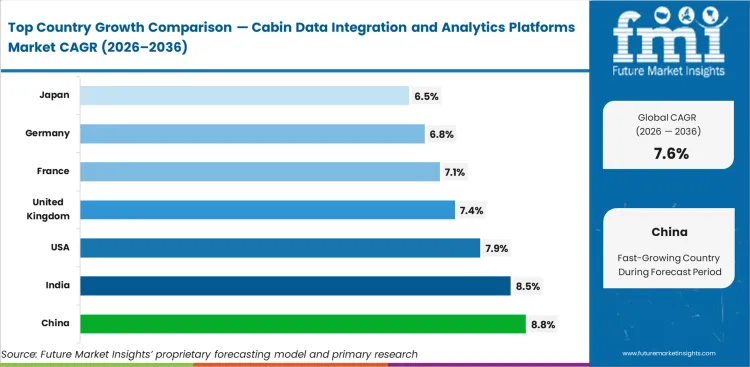
Cabin Data Integration and Analytics Platforms Market CAGR Analysis by Country
- China is projected to record 8.8% CAGR by 2036, driven by large airport throughput and domestic airline programs.
- India is expected to expand at 8.5% CAGR by 2036 due to rising domestic flight activity and fleet use.
- United States is forecast to grow at 7.9% CAGR by 2036 with large airline fleets funding digital cabin work.
- United Kingdom is expected to advance at 7.4% CAGR by 2036 as traffic recovery supports analytics upgrades.
- France is projected to rise at 7.1% CAGR by 2036 through aircraft integration and connected cabin supplier depth.
- Germany is forecast at 6.8% CAGR by 2036, led by premium cabin service needs and fleet data integration.
- Japan is expected to post 6.5% CAGR by 2036 since quality-focused airline programs adopt richer cabin analytics.
Country performance varies by airline scale and connected aircraft investment. China and India track above the global rate as traffic growth gives cabin systems a larger data pool. United States growth stays above the global average as fleet size supports platform spending. France and Germany track closer to the global rate through supplier depth and measured airline growth. Japan records below the global pace but keeps steady value through quality-focused airline programs.
Demand Outlook for Cabin Data Integration and Analytics Platforms in China
China combines large airport traffic with fast airline digital programs. Civil Aviation Administration of China data from March 2026 showed annual passenger throughput at 1,529.0 million across civil transport airports in 2025. Such scale promotes frequent cabin service events across domestic and international routes. Industry in China is projected to record 8.8% CAGR by 2036, led by airlines needing cleaner service data from high-cycle fleets. Supplier fit depends on local integration support and data routing that suits domestic airline systems.
- High domestic flight density raises demand for dashboards that sort cabin issues before aircraft return to service.
- Large airport throughput generates repeated service signals being used by airlines to rank fault patterns across routes.
- Cross-border travel recovery adds pressure for cabin data platforms supporting bilingual crew workflows and service records.
Demand Analysis of Cabin Data Integration and Analytics Platforms in India
Demand in India is expected to expand at 8.5% CAGR by 2036 due to domestic passenger traffic and fleet use rising together. India’s Press Information Bureau said airlines carried 538,429 domestic departing passengers on November 23, 2025 across 3,356 domestic flights. Daily activity at that level increases cabin fault records and passenger service events. Vendors need simple tools that support mixed aircraft and busy domestic turnarounds. Airline teams are likely to favor platforms that shorten manual checks after short sector flights.
- High daily flight activity creates more cabin service records that need fast sorting before aircraft rotation.
- Regional air connectivity expands the number of route pairs requiring consistent cabin fault reporting.
- Cost-sensitive carriers favor platforms reducing manual checks without adding heavy training or complex data workflows.
Sales Outlook for Cabin Data Integration and Analytics Platforms in the United States
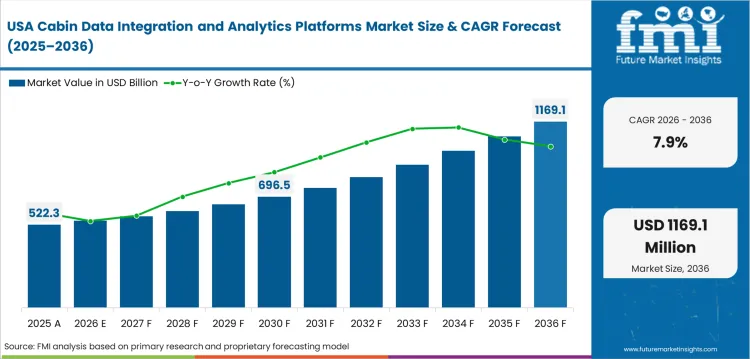
Sales in the United States are forecast to grow at 7.9% CAGR by 2036, driven by large fleet scale and digital service programs. Bureau of Transportation Statistics data from October 2025 showed USA airlines carried 92.2 million scheduled passengers in July 2025. Large monthly traffic gives carriers a clear reason to connect cabin faults with service outcomes. Operators use flight tracking systems and cabin records to improve fleet planning. Suppliers need cyber controls and data links that work with complex airline systems.
- Large network fleets require cabin data mapping that can work across several aircraft families and retrofit histories.
- Federal aviation approval practices make change control evidence important for onboard data hardware and cabin software updates.
- High passenger volumes keep cabin service faults visible to airline managers as service recovery costs rise.
Industry Outlook for Cabin Data Integration and Analytics Platforms in the United Kingdom
Sector in the United Kingdom is expected to advance at 7.4% CAGR by 2036 as traffic recovery supports service quality work. United Kingdom Civil Aviation Authority data from February 2026 showed 302.0 million passengers passing through UK airports in 2025. Record activity raises cabin data volume across short haul and long haul routes. Airlines connect economy cabin refurbishment with analytics as older cabins move through refresh programs. Suppliers gain value when platforms reduce manual reports and support disruption recovery.
- Passenger service scrutiny keeps cabin reliability visible during airline technology reviews and service planning.
- Slot pressure raises the value of quicker cabin fault sorting before aircraft return to departure queues.
- Mixed short haul and long-haul networks need dashboards that separate minor service issues from repeat equipment faults.
Growth Outlook for Cabin Data Integration and Analytics Platforms in France
Sector in France is projected to rise at 7.1% CAGR by 2036 through connected aircraft architecture and cabin software depth. Eurostat reported in December 2025 that Paris Charles de Gaulle recorded 70.0 million air passengers in 2024. Hub activity at this scale supports cabin tools connecting service faults with passenger flow. Local aerospace engineering capacity keeps software evidence central during linefit planning.
- Aircraft integration work supports connected architecture decisions before cabin systems reach airline service.
- Large passenger flows generate enough service data to justify analytics for fault ranking and crew task planning.
- Data protection reviews keep privacy handling important for platforms that touch cabin video or passenger service records.
Demand Outlook for Cabin Data Integration and Analytics Platforms in Germany
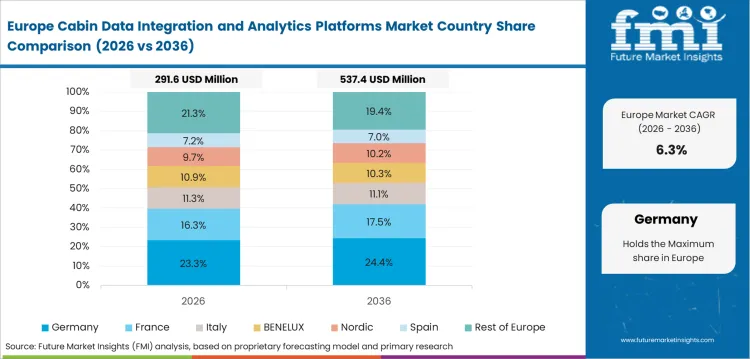
Demand in Germany is forecast at 6.8% CAGR by 2036, reflecting premium airline needs and supplier depth in cabin systems. German Federal Statistical Office data showed 207.2 million air transport passengers in 2025. Passenger traffic at this level keeps cabin service reliability important for airline brand and schedule control. Carriers link aircraft interior lighting and cabin equipment data with service tools. Adoption is steady as carriers balance new software value with cost pressure.
- Premium cabin programs create a higher value pool for service records tied to seats and lighting functions.
- Long haul schedule discipline raises the need for quick cabin fault isolation during narrow ground windows.
- Engineering review culture favors platforms with clear documentation and stable update control across fleet cycles.
Sales Analysis of Cabin Data Integration and Analytics Platforms in Japan
Sales in Japan are expected to post 6.5% CAGR by 2036, influenced by high service expectations and careful airline validation. International Air Transport Association data from August 2025 showed Japan recorded 205.0 million passengers in 2024. Passenger scale supports cabin data tools focused on reliability before fast rollout. Airlines test aircraft cabin sensors and onboard service sensors with strict quality gates. Suppliers need proven uptime and local support for long service cycles.
- Dense domestic route activity makes cabin service reliability important across frequent aircraft turns.
- Airline service culture favors platforms turning cabin faults into clear maintenance tasks before passenger impact.
- Careful validation slows early rollout but supports stable long-term demand for proven cabin analytics tools.
Competitive Landscape and Strategic Positioning
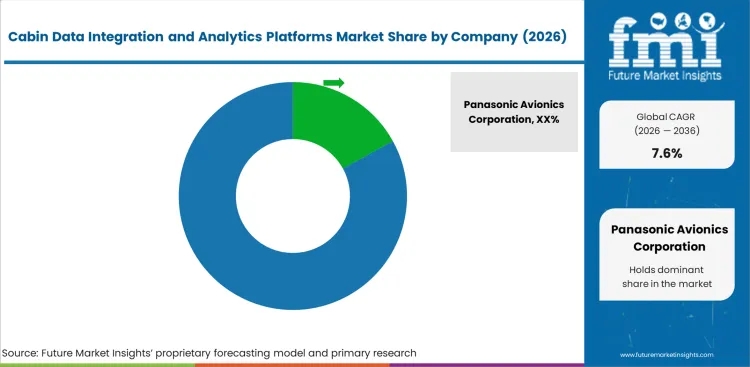
- Onboard hosting suppliers hold an advantage since they manage the path between cabin systems and airline work tools.
- Cabin software firms gain ground on proving secure data handling and cross-fleet mapping during airline trials.
- Hardware specialists support platform growth once servers and cabin interfaces meet required aircraft certification needs.
Competition in cabin data integration and analytics platforms is led by suppliers connecting aircraft cabin systems with airline service tools. Panasonic Avionics and Thales Group hold strong positions through onboard hosting and inflight entertainment software depth. Collins Aerospace and RAVE Aerospace bring broad cabin system relationships to airline and aircraft maker programs. Diehl Aviation and Lufthansa Technik support cabin integration and retrofit work across complex fleet environments. Astronics Corporation adds aircraft data systems and cabin electronics supporting platform value.
Supplier selection depends on proven data movement from aircraft equipment into airline systems without security or certification risk. Smaller firms can support dashboards or app layers but often lack control over full aircraft integration. Airlines are expected to favor suppliers supporting mixed fleets from retrofit planning through daily operations. Companies with open interfaces and disciplined software change control are best positioned to achieve repeat platform awards.
Key Companies in the Cabin Data Integration and Analytics Platforms Market
Competitive structure is grouped by onboard hosting suppliers, cabin system integrators and aircraft data specialists.
- Onboard Hosting Suppliers: Panasonic Avionics Corporation and Thales Group supply platforms tied to cabin applications and data hosting.
- Cabin System Integrators: Collins Aerospace, RAVE Aerospace and Diehl Aviation support cabin equipment data and service interfaces.
- Aircraft Data Specialists: Lufthansa Technik and Astronics Corporation support airline data pathways and cabin electronics integration.
Competitive Benchmarking: Cabin Data Integration and Analytics Platforms Market
| Company | Cabin Data Depth | Onboard Hosting Fit | Airline Service Fit | Geographic Footprint |
|---|---|---|---|---|
| Panasonic Avionics Corporation | High | Strong | Strong | Global |
| Thales Group | High | Strong | Strong | Europe and global |
| Collins Aerospace | High | Medium | Strong | Global |
| RAVE Aerospace | Medium | Strong | Medium | Europe and North America |
| Diehl Aviation | Medium | Medium | Strong | Europe and global |
| Lufthansa Technik | Medium | Medium | Strong | Europe and global |
| Astronics Corporation | Medium | Medium | Medium | North America and global |
Source: Future Market Insights competitive analysis 2026. Ratings reflect relative positioning based on cabin data depth and airline service fit.
Key Developments in Cabin Data Integration and Analytics Platforms Market
- In April 2025, Panasonic Avionics introduced Converix as an aircraft-wide application hosting platform for non-safety critical cabin, crew, and airline analytics services.
- In April 2025, Airbus signed a memorandum with Panasonic Avionics to explore co-development of a future Connected Aircraft platform covering onboard, ground, and cloud data flows.
- In April 2026, Thales launched FlytEDGE Aura for its cloud-native FlytEDGE platform and onboard data center.
Key Players in the Cabin Data Integration and Analytics Platforms Market
Major Global Players:
- Panasonic Avionics Corporation
- Thales Group
- Collins Aerospace
- RAVE Aerospace
- Diehl Aviation
Specialist and Regional Players:
- Lufthansa Technik
- Astronics Corporation
Market Report Scope
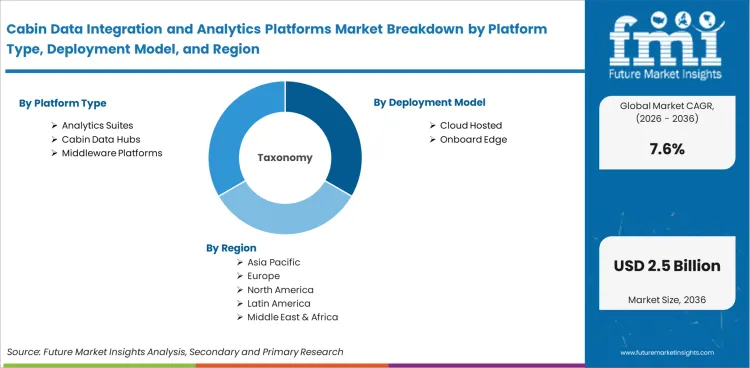
| Parameter | Details |
|---|---|
| Quantitative Units | USD 1.2 billion to USD 2.5 billion, at 7.6% CAGR |
| Market Definition | Software and onboard systems integrating non-safety cabin data for airline service, maintenance and passenger experience decisions |
| Platform type | Analytics suites, cabin data hubs, middleware platforms, crew applications |
| Deployment model | Cloud hosted, onboard edge, hybrid systems |
| Aircraft type | Narrow body, wide body, regional aircraft, business jets |
| Application | Cabin operations, passenger experience, retail analytics, maintenance planning |
| End user | Airlines, aircraft OEMs, lessors, maintenance providers |
| Regions covered | North America, Europe, East Asia, South Asia and Pacific, Latin America, Rest of World |
| Countries covered | China, India, United States, United Kingdom, France, Germany, Japan |
| Key companies profiled | Panasonic Avionics Corporation, Thales Group, Collins Aerospace, Safran Passenger Innovations, Diehl Aviation, Lufthansa Technik, Astronics Corporation |
| Forecast period | 2026 to 2036 |
| Approach | Hybrid top-down and bottom-up model with airline traffic, aircraft fleet size, connected cabin adoption and supplier launch checks |
Source: Future Market Insights, 2026.
Research Sources and Bibliography
- International Air Transport Association. (2025, December 9). Global outlook for air transport in 2026: December 2025.
- Airbus. (2025, October 9). Airbus projects resilient growth of services market in the next 20 years.
- United States International Trade Administration. (2026, April 17). India - Aerospace and defense. USA Department of Commerce.
- Boeing. (2025). Commercial Services Market Outlook 2025-2044.
- Airports Council International. (2026, April 14). World’s busiest airports revealed in latest global rankings.
- European Union Aviation Safety Agency. (2025, December 5). Easy Access Rules for Information Security: Regulations (EU) 2023/203 and 2022/1645.
- Boston Consulting Group. (2025, October 6). From turbulence to transformation: How airlines can win with digital.
- Kontron. (2026, April 7). Kontron launches new-generation Ace Flight™ 4609 avionics server now in production.
- Federal Aviation Administration. (2024, August 21). Equipment, systems, and network information security protection. Federal Register, 89(162), 67564-67572.
- Delta Air Lines. (2025, January 7). Delta unveils onboard: YouTube partnership, cloud-based seatback experience, personalized features and more.
- Airbus. (2025, April 9). Airbus and Panasonic Avionics to co-develop the future Connected Aircraft platform.
- Astronics Corporation. (2025, July 8). Astronics Corporation augments FAA certification services with acquisition of Envoy Aerospace.
- Civil Aviation Administration of China. (2026, March 4). 2025 National Civil Transport Airport Production Statistics Bulletin.
- Bureau of Transportation Statistics. (2025, October 10). July 2025 USA airline traffic data up 0.4% from the same month last year.
- Eurostat. (2025, December 8). Number of air passengers up 8% in 2024.
- International Air Transport Association. (2026, January 29). Strong 2025 passenger demand masks ongoing capacity constraints.
- International Air Transport Association. (2025, August 4). Japan aviation contributes to national growth and connectivity.
- Panasonic Avionics Corporation. (2025, April 8). Panasonic Avionics introduces Converix™.
- Press Information Bureau. (2025, November 24). India records highest ever single-day domestic air passenger traffic. Government of India.
- Thales Group. (2026, April 14). Thales launches FlytEDGE Aura: The power of FlytEDGE with a IFE seat-end.
- United Kingdom Civil Aviation Authority. (2026, February 24). UK aviation officially breaks records with over 300m passenger journeys in 2025.
- Kingswood Capital Management. (2026, February 5). Kingswood Capital Management completes acquisition of Safran Passenger Innovations and unveils the new RAVE Aerospace name.
Bibliography uses official aviation agencies, public statistical bodies and company sources.
This Report Answers
- How large is the cabin data integration and analytics platforms industry in 2026 and 2036?
- Which parent segments carry the leading share percentages in 2026?
- How do connected cabin programs and digital airline operations affect platform demand?
- Which countries show stronger readiness for cabin data integration and analytics platforms?
- How do deployment models affect airline data control and platform value?
- Which suppliers are positioned across onboard hosting and cabin analytics platforms?
Frequently Asked Questions
What is the cabin data integration and analytics platforms market value in 2026?
The cabin data integration and analytics platforms market size is anticipated to cross USD 1.2 billion in 2026.
What is the expected value of cabin data integration and analytics platforms market by 2036?
The cabin data integration and analytics platforms industry revenue is forecast to reach USD 2.5 billion by 2036 as connected cabin data use increases.
What CAGR is expected for cabin data integration and analytics platforms market?
The cabin data integration and analytics platforms sector is projected to expand at 7.6% CAGR from 2026 to 2036 with connected cabin support.
Which platform type holds the leading share in cabin data integration and analytics platforms market?
Analytics suites are expected to account for 36.9% share in 2026, led by airline teams needing usable dashboards.
Which aircraft type is prominent in cabin data integration and analytics platforms market?
Narrow body aircraft are projected to account for 61.8% share in 2026 due to frequent short haul flight cycles.
Which country grows faster in cabin data integration and analytics platforms market?
China is projected to record 8.8% CAGR by 2036 as airport throughput raises connected cabin service data.
What are cabin data integration and analytics platforms?
Cabin data integration and analytics platforms are onboard and cloud systems that organize non-safety cabin data for airline decisions.
How is cabin data integration and analytics platforms market forecast estimated?
Forecast is based on airline traffic and connected cabin adoption across the forecast period.
Why do cabin data integration and analytics platforms need software validation?
Cabin data systems touch onboard aircraft networks, so airlines need proof of secure updates and reliable data handling.
Do cabin data integration and analytics platforms support retrofit fleets?
Cabin data integration and analytics platforms support retrofit fleets by connecting older cabin equipment with dashboards and service records.
Who uses cabin data integration and analytics platforms?
Airlines and aircraft makers use cabin data integration and analytics platforms across passenger service and cabin operations.
Are cabin data integration and analytics platforms tied to connected aircraft programs?
Cabin data integration and analytics platforms support connected aircraft programs by turning cabin events into usable service data.
Preview the report firsthand - request a free sample
Get SampleGet the brochure for pricing and purchase details.
Get PDFTable of Content
- Executive Summary
- Global Market Outlook
- Demand-side Trends
- Supply-side Trends
- Technology Roadmap Analysis
- Analysis and Recommendations
- Market Overview
- Market Coverage / Taxonomy
- Market Definition / Scope / Limitations
- Research Methodology
- Chapter Orientation
- Analytical Lens and Working Hypotheses
- Market Structure, Signals, and Trend Drivers
- Benchmarking and Cross-market Comparability
- Market Sizing, Forecasting, and Opportunity Mapping
- Research Design and Evidence Framework
- Desk Research Programme (Secondary Evidence)
- Company Annual and Sustainability Reports
- Peer-reviewed Journals and Academic Literature
- Corporate Websites, Product Literature, and Technical Notes
- Earnings Decks and Investor Briefings
- Statutory Filings and Regulatory Disclosures
- Technical White Papers and Standards Notes
- Trade Journals, Industry Magazines, and Analyst Briefs
- Conference Proceedings, Webinars, and Seminar Materials
- Government Statistics Portals and Public Data Releases
- Press Releases and Reputable Media Coverage
- Specialist Newsletters and Curated Briefings
- Sector Databases and Reference Repositories
- FMI Internal Proprietary Databases and Historical Market Datasets
- Subscription Datasets and Paid Sources
- Social Channels, Communities, and Digital Listening Inputs
- Additional Desk Sources
- Expert Input and Fieldwork (Primary Evidence)
- Primary Modes
- Qualitative Interviews and Expert Elicitation
- Quantitative Surveys and Structured Data Capture
- Blended Approach
- Why Primary Evidence is Used
- Field Techniques
- Interviews
- Surveys
- Focus Groups
- Observational and In-context Research
- Social and Community Interactions
- Stakeholder Universe Engaged
- C-suite Leaders
- Board Members
- Presidents and Vice Presidents
- R&D and Innovation Heads
- Technical Specialists
- Domain Subject-matter Experts
- Scientists
- Physicians and Other Healthcare Professionals
- Governance, Ethics, and Data Stewardship
- Research Ethics
- Data Integrity and Handling
- Primary Modes
- Tooling, Models, and Reference Databases
- Desk Research Programme (Secondary Evidence)
- Data Engineering and Model Build
- Data Acquisition and Ingestion
- Cleaning, Normalisation, and Verification
- Synthesis, Triangulation, and Analysis
- Quality Assurance and Audit Trail
- Market Background
- Market Dynamics
- Drivers
- Restraints
- Opportunity
- Trends
- Scenario Forecast
- Demand in Optimistic Scenario
- Demand in Likely Scenario
- Demand in Conservative Scenario
- Opportunity Map Analysis
- Product Life Cycle Analysis
- Supply Chain Analysis
- Investment Feasibility Matrix
- Value Chain Analysis
- PESTLE and Porter’s Analysis
- Regulatory Landscape
- Regional Parent Market Outlook
- Production and Consumption Statistics
- Import and Export Statistics
- Market Dynamics
- Global Market Analysis 2021 to 2025 and Forecast, 2026 to 2036
- Historical Market Size Value (USD Million) Analysis, 2021 to 2025
- Current and Future Market Size Value (USD Million) Projections, 2026 to 2036
- Y-o-Y Growth Trend Analysis
- Absolute $ Opportunity Analysis
- Global Market Pricing Analysis 2021 to 2025 and Forecast 2026 to 2036
- Global Market Analysis 2021 to 2025 and Forecast 2026 to 2036, By Platform Type
- Introduction / Key Findings
- Historical Market Size Value (USD Million) Analysis By Platform Type , 2021 to 2025
- Current and Future Market Size Value (USD Million) Analysis and Forecast By Platform Type , 2026 to 2036
- Analytics Suites
- Cabin Data Hubs
- Middleware Platforms
- Analytics Suites
- Y-o-Y Growth Trend Analysis By Platform Type , 2021 to 2025
- Absolute $ Opportunity Analysis By Platform Type , 2026 to 2036
- Global Market Analysis 2021 to 2025 and Forecast 2026 to 2036, By Deployment Model
- Introduction / Key Findings
- Historical Market Size Value (USD Million) Analysis By Deployment Model, 2021 to 2025
- Current and Future Market Size Value (USD Million) Analysis and Forecast By Deployment Model, 2026 to 2036
- Cloud Hosted
- Onboard Edge
- Cloud Hosted
- Y-o-Y Growth Trend Analysis By Deployment Model, 2021 to 2025
- Absolute $ Opportunity Analysis By Deployment Model, 2026 to 2036
- Global Market Analysis 2021 to 2025 and Forecast 2026 to 2036, By Aircraft Type
- Introduction / Key Findings
- Historical Market Size Value (USD Million) Analysis By Aircraft Type, 2021 to 2025
- Current and Future Market Size Value (USD Million) Analysis and Forecast By Aircraft Type, 2026 to 2036
- Narrow Body
- Wide Body
- Narrow Body
- Y-o-Y Growth Trend Analysis By Aircraft Type, 2021 to 2025
- Absolute $ Opportunity Analysis By Aircraft Type, 2026 to 2036
- Global Market Analysis 2021 to 2025 and Forecast 2026 to 2036, By Application
- Introduction / Key Findings
- Historical Market Size Value (USD Million) Analysis By Application, 2021 to 2025
- Current and Future Market Size Value (USD Million) Analysis and Forecast By Application, 2026 to 2036
- Cabin Operations
- Passenger Experience
- Retail Analytics
- Cabin Operations
- Y-o-Y Growth Trend Analysis By Application, 2021 to 2025
- Absolute $ Opportunity Analysis By Application, 2026 to 2036
- Global Market Analysis 2021 to 2025 and Forecast 2026 to 2036, By End User
- Introduction / Key Findings
- Historical Market Size Value (USD Million) Analysis By End User, 2021 to 2025
- Current and Future Market Size Value (USD Million) Analysis and Forecast By End User, 2026 to 2036
- Airlines
- Aircraft OEMs
- Lessors
- Airlines
- Y-o-Y Growth Trend Analysis By End User, 2021 to 2025
- Absolute $ Opportunity Analysis By End User, 2026 to 2036
- Global Market Analysis 2021 to 2025 and Forecast 2026 to 2036, By Region
- Introduction
- Historical Market Size Value (USD Million) Analysis By Region, 2021 to 2025
- Current Market Size Value (USD Million) Analysis and Forecast By Region, 2026 to 2036
- North America
- Latin America
- Western Europe
- Eastern Europe
- East Asia
- South Asia and Pacific
- Middle East & Africa
- Market Attractiveness Analysis By Region
- North America Market Analysis 2021 to 2025 and Forecast 2026 to 2036, By Country
- Historical Market Size Value (USD Million) Trend Analysis By Market Taxonomy, 2021 to 2025
- Market Size Value (USD Million) Forecast By Market Taxonomy, 2026 to 2036
- By Country
- USA
- Canada
- Mexico
- By Platform Type
- By Deployment Model
- By Aircraft Type
- By Application
- By End User
- By Country
- Market Attractiveness Analysis
- By Country
- By Platform Type
- By Deployment Model
- By Aircraft Type
- By Application
- By End User
- Key Takeaways
- Latin America Market Analysis 2021 to 2025 and Forecast 2026 to 2036, By Country
- Historical Market Size Value (USD Million) Trend Analysis By Market Taxonomy, 2021 to 2025
- Market Size Value (USD Million) Forecast By Market Taxonomy, 2026 to 2036
- By Country
- Brazil
- Chile
- Rest of Latin America
- By Platform Type
- By Deployment Model
- By Aircraft Type
- By Application
- By End User
- By Country
- Market Attractiveness Analysis
- By Country
- By Platform Type
- By Deployment Model
- By Aircraft Type
- By Application
- By End User
- Key Takeaways
- Western Europe Market Analysis 2021 to 2025 and Forecast 2026 to 2036, By Country
- Historical Market Size Value (USD Million) Trend Analysis By Market Taxonomy, 2021 to 2025
- Market Size Value (USD Million) Forecast By Market Taxonomy, 2026 to 2036
- By Country
- Germany
- UK
- Italy
- Spain
- France
- Nordic
- BENELUX
- Rest of Western Europe
- By Platform Type
- By Deployment Model
- By Aircraft Type
- By Application
- By End User
- By Country
- Market Attractiveness Analysis
- By Country
- By Platform Type
- By Deployment Model
- By Aircraft Type
- By Application
- By End User
- Key Takeaways
- Eastern Europe Market Analysis 2021 to 2025 and Forecast 2026 to 2036, By Country
- Historical Market Size Value (USD Million) Trend Analysis By Market Taxonomy, 2021 to 2025
- Market Size Value (USD Million) Forecast By Market Taxonomy, 2026 to 2036
- By Country
- Russia
- Poland
- Hungary
- Balkan & Baltic
- Rest of Eastern Europe
- By Platform Type
- By Deployment Model
- By Aircraft Type
- By Application
- By End User
- By Country
- Market Attractiveness Analysis
- By Country
- By Platform Type
- By Deployment Model
- By Aircraft Type
- By Application
- By End User
- Key Takeaways
- East Asia Market Analysis 2021 to 2025 and Forecast 2026 to 2036, By Country
- Historical Market Size Value (USD Million) Trend Analysis By Market Taxonomy, 2021 to 2025
- Market Size Value (USD Million) Forecast By Market Taxonomy, 2026 to 2036
- By Country
- China
- Japan
- South Korea
- By Platform Type
- By Deployment Model
- By Aircraft Type
- By Application
- By End User
- By Country
- Market Attractiveness Analysis
- By Country
- By Platform Type
- By Deployment Model
- By Aircraft Type
- By Application
- By End User
- Key Takeaways
- South Asia and Pacific Market Analysis 2021 to 2025 and Forecast 2026 to 2036, By Country
- Historical Market Size Value (USD Million) Trend Analysis By Market Taxonomy, 2021 to 2025
- Market Size Value (USD Million) Forecast By Market Taxonomy, 2026 to 2036
- By Country
- India
- ASEAN
- Australia & New Zealand
- Rest of South Asia and Pacific
- By Platform Type
- By Deployment Model
- By Aircraft Type
- By Application
- By End User
- By Country
- Market Attractiveness Analysis
- By Country
- By Platform Type
- By Deployment Model
- By Aircraft Type
- By Application
- By End User
- Key Takeaways
- Middle East & Africa Market Analysis 2021 to 2025 and Forecast 2026 to 2036, By Country
- Historical Market Size Value (USD Million) Trend Analysis By Market Taxonomy, 2021 to 2025
- Market Size Value (USD Million) Forecast By Market Taxonomy, 2026 to 2036
- By Country
- Kingdom of Saudi Arabia
- Other GCC Countries
- Turkiye
- South Africa
- Other African Union
- Rest of Middle East & Africa
- By Platform Type
- By Deployment Model
- By Aircraft Type
- By Application
- By End User
- By Country
- Market Attractiveness Analysis
- By Country
- By Platform Type
- By Deployment Model
- By Aircraft Type
- By Application
- By End User
- Key Takeaways
- Key Countries Market Analysis
- USA
- Pricing Analysis
- Market Share Analysis, 2025
- By Platform Type
- By Deployment Model
- By Aircraft Type
- By Application
- By End User
- Canada
- Pricing Analysis
- Market Share Analysis, 2025
- By Platform Type
- By Deployment Model
- By Aircraft Type
- By Application
- By End User
- Mexico
- Pricing Analysis
- Market Share Analysis, 2025
- By Platform Type
- By Deployment Model
- By Aircraft Type
- By Application
- By End User
- Brazil
- Pricing Analysis
- Market Share Analysis, 2025
- By Platform Type
- By Deployment Model
- By Aircraft Type
- By Application
- By End User
- Chile
- Pricing Analysis
- Market Share Analysis, 2025
- By Platform Type
- By Deployment Model
- By Aircraft Type
- By Application
- By End User
- Germany
- Pricing Analysis
- Market Share Analysis, 2025
- By Platform Type
- By Deployment Model
- By Aircraft Type
- By Application
- By End User
- UK
- Pricing Analysis
- Market Share Analysis, 2025
- By Platform Type
- By Deployment Model
- By Aircraft Type
- By Application
- By End User
- Italy
- Pricing Analysis
- Market Share Analysis, 2025
- By Platform Type
- By Deployment Model
- By Aircraft Type
- By Application
- By End User
- Spain
- Pricing Analysis
- Market Share Analysis, 2025
- By Platform Type
- By Deployment Model
- By Aircraft Type
- By Application
- By End User
- France
- Pricing Analysis
- Market Share Analysis, 2025
- By Platform Type
- By Deployment Model
- By Aircraft Type
- By Application
- By End User
- India
- Pricing Analysis
- Market Share Analysis, 2025
- By Platform Type
- By Deployment Model
- By Aircraft Type
- By Application
- By End User
- ASEAN
- Pricing Analysis
- Market Share Analysis, 2025
- By Platform Type
- By Deployment Model
- By Aircraft Type
- By Application
- By End User
- Australia & New Zealand
- Pricing Analysis
- Market Share Analysis, 2025
- By Platform Type
- By Deployment Model
- By Aircraft Type
- By Application
- By End User
- China
- Pricing Analysis
- Market Share Analysis, 2025
- By Platform Type
- By Deployment Model
- By Aircraft Type
- By Application
- By End User
- Japan
- Pricing Analysis
- Market Share Analysis, 2025
- By Platform Type
- By Deployment Model
- By Aircraft Type
- By Application
- By End User
- South Korea
- Pricing Analysis
- Market Share Analysis, 2025
- By Platform Type
- By Deployment Model
- By Aircraft Type
- By Application
- By End User
- Russia
- Pricing Analysis
- Market Share Analysis, 2025
- By Platform Type
- By Deployment Model
- By Aircraft Type
- By Application
- By End User
- Poland
- Pricing Analysis
- Market Share Analysis, 2025
- By Platform Type
- By Deployment Model
- By Aircraft Type
- By Application
- By End User
- Hungary
- Pricing Analysis
- Market Share Analysis, 2025
- By Platform Type
- By Deployment Model
- By Aircraft Type
- By Application
- By End User
- Kingdom of Saudi Arabia
- Pricing Analysis
- Market Share Analysis, 2025
- By Platform Type
- By Deployment Model
- By Aircraft Type
- By Application
- By End User
- Turkiye
- Pricing Analysis
- Market Share Analysis, 2025
- By Platform Type
- By Deployment Model
- By Aircraft Type
- By Application
- By End User
- South Africa
- Pricing Analysis
- Market Share Analysis, 2025
- By Platform Type
- By Deployment Model
- By Aircraft Type
- By Application
- By End User
- USA
- Market Structure Analysis
- Competition Dashboard
- Competition Benchmarking
- Market Share Analysis of Top Players
- By Regional
- By Platform Type
- By Deployment Model
- By Aircraft Type
- By Application
- By End User
- Competition Analysis
- Competition Deep Dive
- Panasonic Avionics Corporation
- Overview
- Product Portfolio
- Profitability by Market Segments (Product/Age /Sales Channel/Region)
- Sales Footprint
- Strategy Overview
- Marketing Strategy
- Product Strategy
- Channel Strategy
- Thales Group
- Collins Aerospace
- RAVE Aerospace
- Diehl Aviation
- Panasonic Avionics Corporation
- Competition Deep Dive
- Assumptions & Acronyms Used


