

- Market Size (2026)
- USD 671.5 Mn
- Forecast (2036)
- USD 1504.3 Mn
- CAGR (2026 to 2036)
- 8.4%
Premium Cabin Acoustic Privacy Solutions Market Size, Market Forecast and Outlook By FMI
Premium cabin acoustic privacy solutions market was valued at USD 619.5 million in 2025 and is projected to reach USD 671.5 million in 2026. It is forecast to reach USD 1,504.3 million by 2036 at 8.4% CAGR. Acoustic suite shells are projected to lead the solution type segment with 38.0% share, and retrofit programs are anticipated to hold 54.0% share by fit type in 2026.
Summary of the Premium Cabin Acoustic Privacy Solutions Market
- Demand and Growth Drivers
- Demand for premium cabin acoustic privacy solutions is rising as airlines protect fare premiums through quieter personal space.
- Adoption is moving faster in long-haul business cabins where door systems and shell height shape passenger choice.
- Cabin retrofit activity supports near-term demand as airlines refresh older wide-body fleets without waiting for new aircraft.
- Business jet completions create a smaller but high-value route for deeper acoustic treatment and private cabin zones.
- Product and Segment View
- Acoustic suite shells are projected to account for 38.0% share in 2026 as seat surrounds carry most privacy work.
- Business class suites are forecast to account for 48.0% share in 2026 as long-haul airlines compete on enclosed seating.
- Wide-body aircraft are expected to hold 56.0% share in 2026 because long sectors make noise control easier to sell.
- Lightweight composites are projected to account for 42.0% share in 2026 as airlines manage acoustic gain against weight.
- Geography and Competitive Outlook
- The United Arab Emirates is expected to post 9.6% CAGR through 2036 as premium long-haul fleets remain central to hub strategy.
- Japan is projected at 9.0% CAGR through 2036 as cabin quality remains a key point on long international routes.
- Key players such as Safran Seats and Collins Aerospace shape suite architecture, while RECARO Aircraft Seating supports retrofit scale.
- Greenpoint Technologies and Lufthansa Technik influence VVIP and private aircraft acoustic work through completion expertise.
- Analyst Opinion
- Nikhil Kaitwade, Principal Consultant at FMI says, "The next stage of premium cabin privacy will be decided by quietness that can be certified, maintained and sold as a clear cabin benefit. Airlines will not pay just for a door or taller shell. They will pay for a full acoustic zone that improves rest and fits within weight limits."
- Premium Cabin Acoustic Privacy Solutions Market Value Analysis
- The market is moving from custom first-class privacy work toward repeatable business suite packages with measured noise control.
- The market is expanding steadily as airlines invest in premium cabin upgrades to enhance passenger privacy and comfort.
- Demand growth is being driven by increasing adoption of enclosed suites and quieter cabin environments, especially on long‑haul routes.
- Rising retrofit activity and ongoing fleet modernization are further supporting sustained expansion in demand for acoustic privacy solutions.
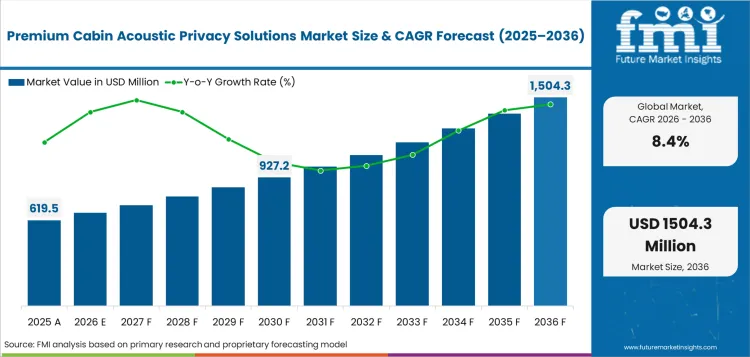
Key Takeaways, Market Size, and Forecast
- The premium cabin acoustic privacy solutions market was valued at USD 619.5 million in 2025.
- By 2036, the premium cabin acoustic privacy solutions market is expected to be worth USD 1,504.3 million.
- From 2026 to 2036, the market is projected to expand at 8.4% CAGR.
- The market is projected to create an incremental opportunity of USD 832.8 million between 2026 and 2036.
- Acoustic suite shells are projected to account for 38.0% share of solution type demand in 2026.
- Retrofit programs are expected to account for 54.0% share of fit type demand in 2026.
- The United Arab Emirates at 9.6% CAGR and Japan at 9.0% CAGR are some of the countries with stronger adoption outlook.
Premium cabin acoustic privacy has shifted from a soft comfort feature into a cabin revenue tool. Airlines use higher shell walls and door systems. Trim packages to protect personal space in premium cabins. International Air Transport Association data showed that full-year passenger demand rose 5.3% in 2025, which keeps airline planning focused on paid seat yield. Airbus expects 9,170 new wide-body aircraft through 2044, creating a long runway for premium cabin work. The market is projected to be influenced by changing aircraft cabin interiors preferences, since acoustic zoning must be designed around seat structures and sidewall panels.
Premium Cabin Acoustic Privacy Solutions Market Definition
The premium cabin acoustic privacy solutions market covers engineered products that reduce perceived noise and protect personal space in aircraft premium cabins. Scope includes acoustic suite shells, privacy doors, absorptive panels, soft trim packages and personal sound-masking features. Revenue covers components sold to seat makers, cabin integrators, airlines, business jet completion centers and aircraft manufacturers. The market operates inside the wider commercial aircraft cabin interior value chain but excludes standard economy seating and unrelated cabin décor.
Premium Cabin Acoustic Privacy Solutions Market Inclusions
Market scope includes business class suite shells and first class privacy enclosures. Sliding privacy doors and acoustic trim define the remaining scope. It includes premium seat parts supplied through aircraft seating channels when the product is specified for acoustic privacy. The scope includes business jet suites when acoustic treatment is sold as part of a completion package. It includes sound-masking features linked with in-flight entertainment and connectivity where the feature supports private listening or lower perceived cabin noise.
Premium Cabin Acoustic Privacy Solutions Market Exclusions
Scope does not include standard economy seat cushions, routine upholstery replacement, general cabin cleaning, non-acoustic lighting systems or purely visual trim. It excludes aircraft structural insulation that is not linked to premium cabin privacy. It excludes headphones sold as consumer accessories and passenger entertainment screens sold without an acoustic or privacy function.
Premium Cabin Acoustic Privacy Solutions Market Research Methodology
- Primary Research: FMI analysts reviewed cabin supplier portfolios, airline retrofit programs, completion center capabilities and premium seat specification patterns across major aviation countries.
- Desk Research: The study used public aviation forecasts, regulator traffic data, airline fleet signals and official company newsroom releases dated 2024 onward.
- Market sizing and forecasting: Market size was estimated through a hybrid bottom-up and top-down method using premium seat counts, retrofit cycles and acoustic component value ranges.
- Data validation: Forecast checks compared wide-body delivery outlook, premium cabin retrofit activity, VVIP completion signals and supplier product announcements.
Why is the Premium Cabin Acoustic Privacy Solutions Market Growing?
- Airlines are using enclosed suites to protect premium cabin fares on long routes where rest quality affects brand choice.
- Retrofit planners are adding privacy features to older wide-body fleets as new aircraft delivery timing remains tight.
- Business jet completions are raising expectations for quieter private zones across high-value cabin programs.
Premium cabin privacy is rising because airlines need visible differences between business products and premium economy upgrades. IATA reported 83.6% passenger load factor for full-year 2025, which shows that airlines are filling seats across a tight capacity base. Higher utilization pushes cabin teams to earn more from each premium square foot. This keeps enclosed suite systems and quieter personal zones part of route-level revenue planning. Suppliers tied to aircraft seat programs can win when they prove the privacy benefit without adding avoidable weight.
Retrofit demand has also witnessed expansion as many airlines cannot wait for a full fleet renewal cycle. Airbus stated that around 18,930 aircraft deliveries through 2044 will replace older-generation models. Replacement flow supports new line-fit cabins, but it also creates pressure to refresh existing long-haul aircraft first. Retrofit teams need solutions that fit certified seat footprints and cabin monuments. Replacement timing creates work for suppliers connected to air transport MRO and premium interior modification programs.
Market Segmentation Analysis
- Acoustic suite shells are projected to reach 38.0% share in 2026 as shell geometry carries the main privacy function.
- Business class suites are expected to represent 48.0% share in 2026 as airlines widen door-equipped products beyond first class.
- Wide-body aircraft are forecast to account for 56.0% share in 2026 given long-haul routes and higher premium cabin density.
- Retrofit programs are projected to capture 54.0% share in 2026 as airlines refresh cabin products before fleet replacement.
- Lightweight composites are estimated to account for 42.0% share of material platform demand in 2026 as weight limits guide design.
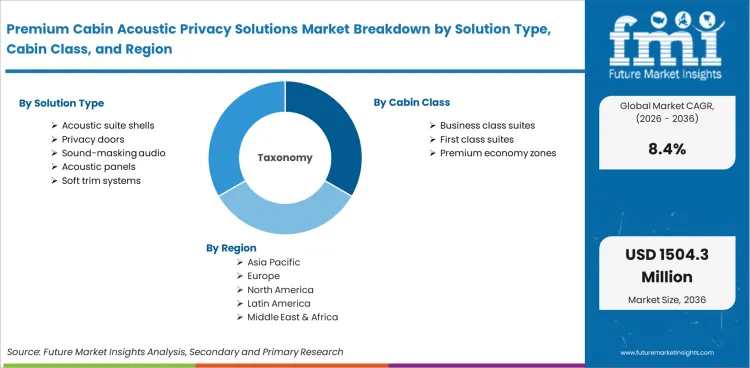
The market is divided into five primary segment groups based on solution type and cabin class. Aircraft type, fit type and material platform complete the structure. Solution type covers acoustic suite shells, privacy doors, sound-masking audio, acoustic panels and soft trim systems. Cabin class explains how the product is specified across business, first and premium economy zones. Aircraft type and fit type show whether demand comes from new production or retrofit work. Material platform links the market with aerospace interior design and cabin weight planning.
Insights into the Acoustic Suite Shells Solution Type Segment
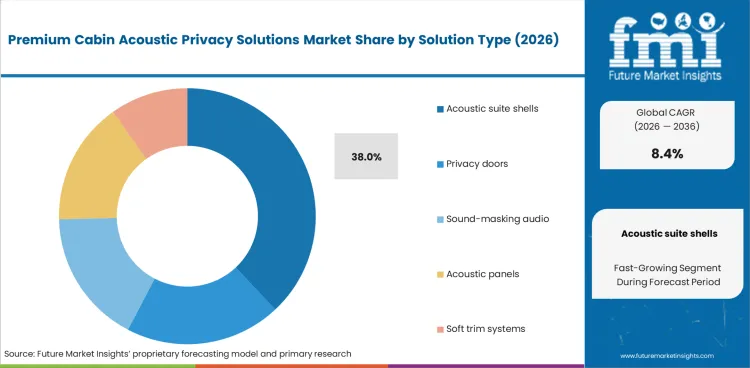
- Acoustic suite shells are projected to account for 38.0% share of solution type demand in 2026 as shell height creates the first privacy barrier.
- Suppliers in the segment can secure lead as shell panels reduce reflected cabin noise while leaving clear routes for certification and seat service.
Insights into the Business Class Suites Cabin Class Segment
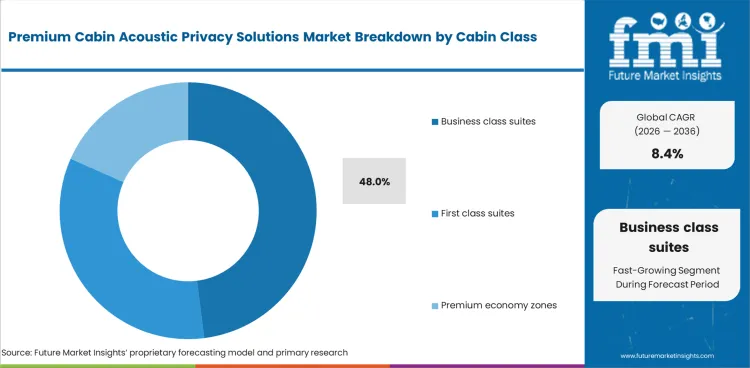
- Business class suites are expected to represent 48.0% share in 2026 as door-equipped products move beyond flagship aircraft.
- Airlines prefer this cabin class because it combines fare premium with greater seat count than first class cabins on many long routes.
Insights into the Wide-Body Aircraft Type Segment
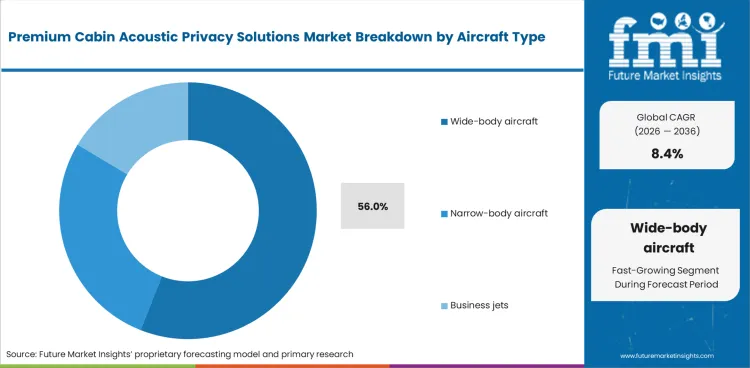
- Wide-body aircraft are forecast to account for 56.0% share in 2026 because long routes place more value on rest quality.
- Premium cabin acoustic packages gain stronger traction on A350, Boeing 787 and Boeing 777 programs where cabin redesign budgets are larger.
Insights into the Retrofit Fit Type Segment
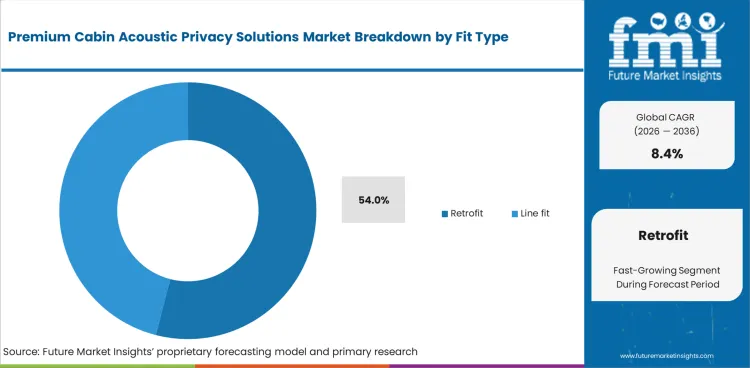
- Retrofit programs are projected to account for 54.0% share in 2026 as airlines refresh seats between fleet cycles.
- Retrofit work favors modular privacy doors and shell kits that can be installed without major changes to cabin power or monuments.
Insights into the Lightweight Composites Material Platform Segment
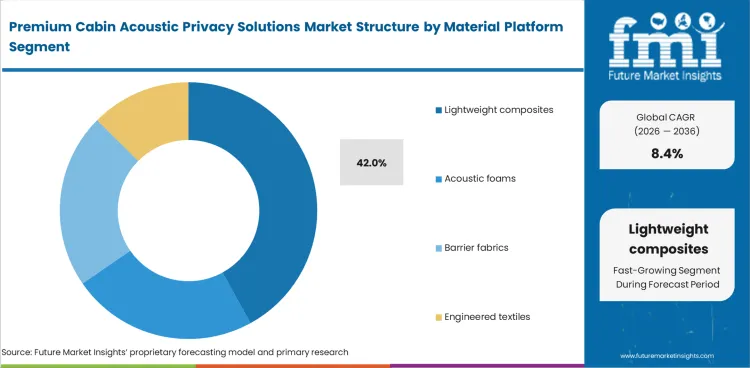
- Lightweight composites are estimated to account for 42.0% share of material platform demand in 2026 as airlines manage privacy gain against weight.
- The platform is witnessing demand with certified aerospace composite materials because shell panels need stiffness and repeatable acoustic performance inside premium cabins.
Premium Cabin Acoustic Privacy Solutions Market Drivers, Restraints, and Opportunities
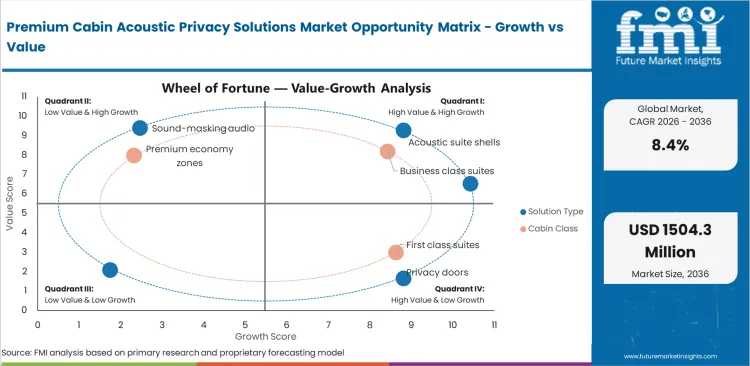
- Door-equipped suite demand raises the need for stronger acoustic zoning inside premium cabin layouts.
- Weight and certification limits slow adoption when a privacy feature adds mass without a clear revenue gain.
- Retrofit-ready acoustic kits create opportunity as airlines update older long-haul cabins during scheduled checks.
Airlines need to make premium cabins feel private while protecting revenue seats on long-haul aircraft. RECARO Aircraft Seating said its LATAM Boeing 787 retrofit includes 20 R7 suites in B787-8s and 30 in B787-9s across 24 shipsets. The seats include increased shell height and suite doors. The LATAM program shows that privacy is becoming a standard business class expectation on long-haul retrofits. The same buying pattern supports acoustic doors, trim and shell panels in premium cabin programs.
Weight and Certification Slow Wider Use
The main restraint is the need to prove weight, flammability and emergency access performance together. A privacy panel that improves quietness can lose appeal if it adds inspection work or limits crew access. Certification teams therefore prefer measured acoustic improvement over visual privacy claims. Suppliers that cannot provide test data face longer approval cycles and weaker airline trust.
Retrofit Kits Create Repeatable Value
Opportunity is available for companies that can offer acoustic privacy features that can be packaged into retrofit-ready kits. Airbus noted that almost 600 A350 aircraft had been delivered since 2014 and the first retrofit wave had started by 2024. Wide-body refresh cycles create openings for doors/shell panels and quieter trim packages. Suppliers of insulation and cabin panels can secure share by offering low-weight acoustic performance with clear installation steps.
Analysis of Premium Cabin Acoustic Privacy Solutions Market by Key Countries
.webp "Top Country Growth Comparison Premium Cabin Acoustic Privacy Solutions Market Cagr (2026 2036)")
| Country | CAGR |
|---|---|
| United States | 7.9% CAGR |
| France | 8.3% CAGR |
| Germany | 7.6% CAGR |
| United Kingdom | 8.1% CAGR |
| China | 8.8% CAGR |
| Japan | 9.0% CAGR |
| United Arab Emirates | 9.6% CAGR |
Source: Future Market Insights, 2026.
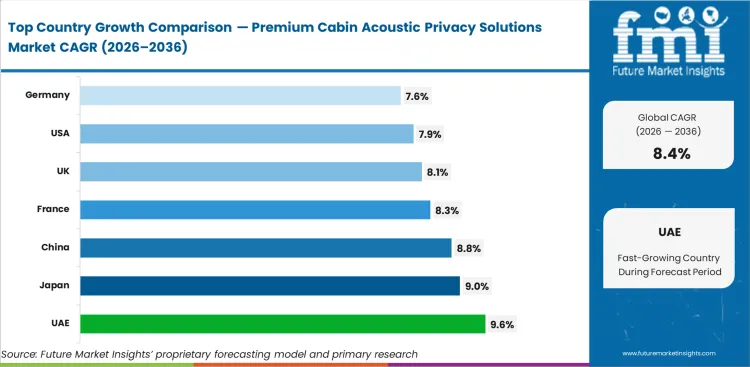
Premium Cabin Acoustic Privacy Solutions Market CAGR Analysis by Country
- The United Arab Emirates is anticipated to post 9.6% CAGR by 2036 as hub airlines keep long-haul premium cabins central to brand value.
- Japan is expected to record 9.0% CAGR by 2036 as premium privacy features fit the country’s long-haul service standards.
- China is predicted at 8.8% CAGR by 2036 as wide-body travel recovery supports premium cabin refurbishment.
- France and the United Kingdom are forecast to advance at 8.3% CAGR and 8.1% CAGR through 2036 as seat suppliers and flag carriers support cabin renewal.
- The United States and Germany remain large service bases, with 7.9% CAGR and 7.6% CAGR based on established retrofit and certification depth.
Demand for premium cabin acoustic privacy solutions is forecast to rise at 8.4% CAGR from 2026 to 2036. Country-level analysis covers markets where long-haul fleets, seat makers, completion centers and premium airline brands support early adoption.
Demand Outlook for Premium Cabin Acoustic Privacy Solutions Market in the United States
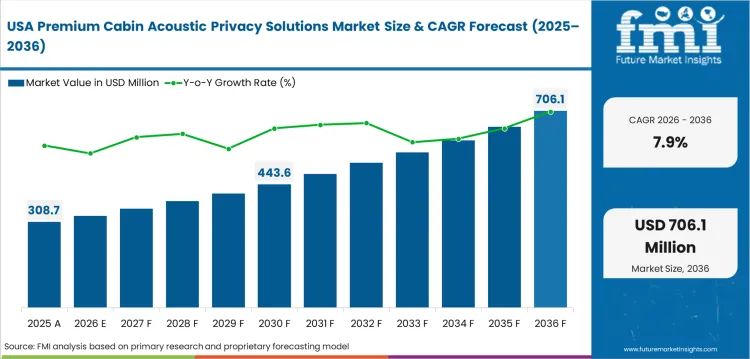
The United States is projected to record 7.9% CAGR through 2036 as airlines and completion centers tie premium cabin refresh work to long-route yield. The Federal Aviation Administration forecast expects system enplanements to grow at 2.5% per year from 2025 to 2045. The traffic base supports cabin renewal planning at major carriers and private aviation centers. Wichita and Dallas remain important routes for supplier engagement across completions and airline planning work. S
- Wichita completion and modification shops can use acoustic panels in business jet cabins and special mission interiors.
- Dallas airline planning teams can test suite privacy features on long-haul aircraft serving premium business routes.
- Seattle engineering links support cabin suppliers that need aircraft integration knowledge and certification support.
Demand Analysis of Premium Cabin Acoustic Privacy Solutions Market in France
France is forecast at 8.3% CAGR through 2036 as cabin suppliers and premium fleet operators remain close to aircraft manufacturing networks. French transport statistics show that international traffic represented 83% of air passenger traffic in 2024. International exposure supports higher interest in privacy features for long sectors. Toulouse and Paris give suppliers a route into design and integration decisions for premium cabin programs.
- Toulouse aircraft programs create demand for cabin concepts that link acoustic comfort with seat and monument planning.
- Paris airline routes support premium cabin privacy work on long-haul products where sleep quality affects brand choice.
- Bordeaux interiors suppliers can support acoustic trim and panel work around certified cabin components.
Opportunity Analysis of Premium Cabin Acoustic Privacy Solutions Market in Germany
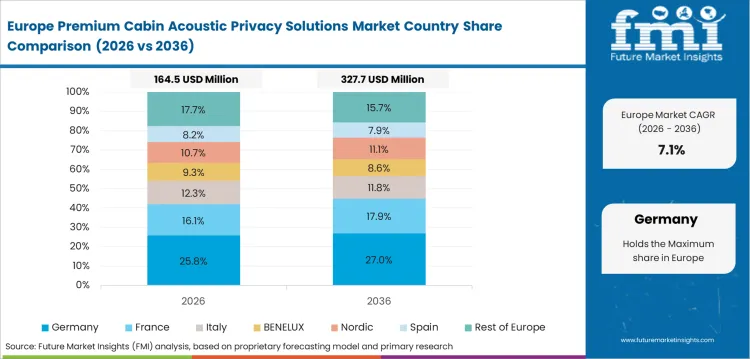
Germany is expected to advance at 7.6% CAGR through 2036 as engineering depth supports certification-heavy cabin upgrades. The Federal Statistical Office of Germany reported 199.5 million passengers at 22 main airports in 2024. That volume keeps airline cabin programs tied to international travel recovery. Hamburg and Frankfurt remain central to supplier activity across interiors and long-haul airline planning routes.
- Hamburg aircraft interiors suppliers can support suite shell engineering and acoustic validation for premium cabins.
- Frankfurt long-haul network depth supports privacy features for business cabins serving global corporate routes.
- Munich aviation engineering teams can evaluate lightweight shell materials with lower service risk.
Demand Outlook for Premium Cabin Acoustic Privacy Solutions Market in the United Kingdom
The United Kingdom is expected to post 8.1% CAGR through 2036 as premium cabin competition remains visible on Atlantic and Gulf routes. The United Kingdom Civil Aviation Authority reported that 302 million passengers passed through UK airports in 2025. This traffic record supports airline interest in cabin products that protect premium fare positioning. London and Belfast remain important touchpoints for airline planning and seat engineering across premium long-haul programs.
- London airline route planners can use privacy-led cabin upgrades on premium routes to North America and the Middle East.
- Belfast seat engineering links support shell and door work where certification experience affects supplier choice.
- Wales maintenance activity can support retrofit programs that install privacy parts during planned cabin work.
Sales Analysis of Premium Cabin Acoustic Privacy Solutions Market in China
China is expected to expand at 8.8% CAGR through 2036 as international flight recovery and fleet growth lift premium cabin planning. The Civil Aviation Administration of China reported 730 million passenger trips in 2024, up 17.9% from the prior year. That scale gives airlines more reason to refresh premium cabins for long routes. Shanghai and Beijing remain major demand nodes for premium cabin planning on international services routes.
- Shanghai carriers can evaluate enclosed suites for international services where privacy affects premium product ranking.
- Beijing long-haul routes create demand for quieter cabin zones on flagship aircraft and diplomatic travel segments.
- Guangzhou airline groups can support retrofit packages as wide-body utilization rises on overseas routes.
Future Outlook for Premium Cabin Acoustic Privacy Solutions Market in Japan
Japan is forecast at 9.0% CAGR through 2036 as cabin quality remains central to long-haul service design. Ministry-linked Japanese aviation statistics showed domestic passengers above 107 million in 2024. Long international routes add a stronger need for privacy and rest quality than domestic travel alone. Tokyo and Nagoya can act as early nodes for premium cabin acoustic work among Japanese airlines and suppliers.
- Tokyo airline headquarters can specify door-equipped suites and soft acoustic trim for long-haul premium cabins.
- Nagoya aerospace suppliers can support material qualification around lightweight cabin parts and acoustic panels.
- Osaka premium travel routes create demand for quieter cabin zones on international services.
Sales Analysis of Premium Cabin Acoustic Privacy Solutions Market in the United Arab Emirates
The United Arab Emirates is projected to rise at 9.6% CAGR through 2036 as hub airlines compete heavily on long-haul premium products. The General Civil Aviation Authority reported 147.8 million passengers across the country in 2024. That passenger base gives cabin privacy features a clear commercial role on connecting routes. Dubai and Abu Dhabi remain the main demand centers for long-haul premium cabin planning.
- Dubai long-haul fleets create strong demand for enclosed business suites and first class privacy zones.
- Abu Dhabi premium cabin plans can use acoustic shells to protect rest quality on ultra-long sectors.
- Al Ain and Dubai South aviation zones support modification work tied to business aviation interiors.
Competitive Landscape and Strategic Positioning
- Competition outlook in the sector centers on acoustic material proof and certification support over visual design alone.
- Seat suppliers secure positioning when privacy doors and shell height can be certified across repeated aircraft programs.
- Completion centers gain value when they combine acoustic design, monument work and entry-into-service support.
- Entry barriers include burn testing and cabin maintenance access under airline service conditions.
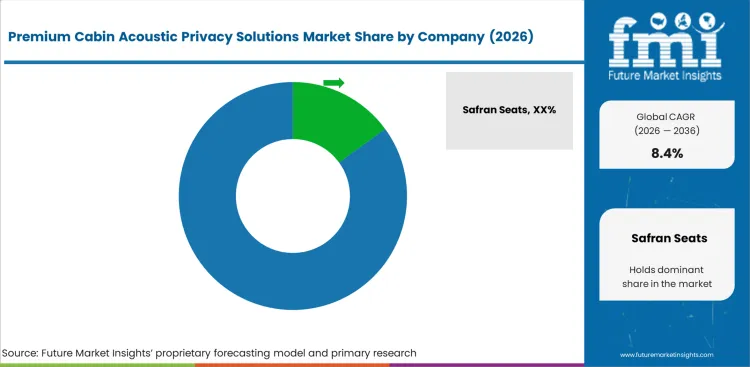
Premium cabin acoustic privacy competition outlook is led by suppliers that can combine a private zone with certifiable aircraft hardware. Safran Seats and Collins Aerospace compete by offering fully integrated business suite solutions, combining privacy doors, optimized shell designs, and system integration capabilities. RECARO Aircraft Seating differentiates itself through strong retrofit expertise and lightweight mini‑suite solutions, while Thompson Aero Seating and Jamco Corporation compete by leveraging their established track record in premium seating programs.
Completion specialists shape the high-end side of the sector. Lufthansa Technik and AIM Altitude support adjacent cabin modification work where engineering control matters. Suppliers with stronger positions treat privacy as an engineered cabin system. Collins Aerospace and Panasonic Avionics showed MAYA in May 2024 with an integrated business class suite and an Astrova Curve 45-inch OLED display. The MAYA launch links seating, media and personal sound space in one package. Suppliers connected to aircraft lighting and cabin electronics can gain advantage when acoustic privacy is paired with ambience and screen design.
Key Companies in the Premium Cabin Acoustic Privacy Solutions Market
Competition is clearest by role as seat integration, cabin completion and acoustic material capability differ sharply.
- Premium Seat and Suite Leaders: Safran Seats, Collins Aerospace, RECARO Aircraft Seating, Thompson Aero Seating and Jamco Corporation hold strong positions through premium suite design and privacy doors. Aircraft certification work supports their position.
- Cabin Completion and Integration Specialists: Greenpoint Technologies, Lufthansa Technik and AIM Altitude are better placed to deliver private zones in business jets, VVIP aircraft and complex cabin modifications.
- Adjacent Cabin Technology Participants: Panasonic Avionics and Diehl Aviation support the ecosystem through cabin electronics, interior panels and passenger environment systems that affect perceived privacy.
Competitive Benchmarking: Premium Cabin Acoustic Privacy Solutions Market
| Company | Acoustic Zoning Depth | Privacy Suite Integration | Certification Support | Geographic Footprint |
|---|---|---|---|---|
| Safran Seats | High | Strong | Strong | Global with France and United States cabin program depth |
| Collins Aerospace | High | Strong | Strong | Global with United States engineering and airline program reach |
| RECARO Aircraft Seating | Medium | Strong | Strong | Global with Germany centered retrofit and seating depth |
| Thompson Aero Seating | Medium | Strong | Medium | United Kingdom centered with premium long-haul seating exposure |
| Jamco Corporation | Medium | Medium | Strong | Japan centered with aircraft interiors and premium cabin work |
| Greenpoint Technologies | High | Medium | Strong | United States centered with VVIP and Boeing business jet completions |
| Lufthansa Technik | Medium | Medium | Strong | Germany centered with airline modification and completion support |
| Diehl Aviation | Medium | Medium | Strong | Germany centered with cabin panels and interior systems |
| Panasonic Avionics | Low | Medium | Medium | Global cabin electronics footprint with premium suite integration exposure |
| AIM Altitude | Medium | Medium | Medium | United Kingdom centered with monuments and cabin interior products |
Source: Future Market Insights competitive analysis, 2026. Ratings reflect relative positioning based on acoustic zoning depth, privacy suite integration and certification support.
Key Developments in Premium Cabin Acoustic Privacy Solutions Market
- In June 2025, Safran Seats and All Nippon Airways introduced THE Room FX business class on Boeing 787-9 aircraft with a privacy door for each seat. The program shows how door-equipped privacy is entering refreshed long-haul cabins.
- In April 2024, Greenpoint Technologies inducted a BBJ 787-9 for V-VIP completion at Moses Lake with exceptionally quiet acoustics and AeroSuite private spaces. The program signals demand for acoustic privacy in private aircraft interiors.
- In September 2024, RECARO Aircraft Seating was selected for LATAM’s Boeing 787 retrofit with 20 R7 suites in B787-8s and 30 in B787-9s. The suite doors show how privacy features are entering wider retrofit programs.
Key Players in the Premium Cabin Acoustic Privacy Solutions Market
Major Global Players:
- Safran Seats
- Collins Aerospace
- RECARO Aircraft Seating
- Thompson Aero Seating
- Jamco Corporation
- Diehl Aviation
Specialist and Regional Players:
- Greenpoint Technologies
- Lufthansa Technik
- Panasonic Avionics
- AIM Altitude
Report Scope and Coverage
| Parameter | Details |
|---|---|
| Quantitative Units | USD 671.5 million to USD 1,504.3 million, at 8.4% CAGR |
| Market Definition | Acoustic and privacy components used in premium aircraft cabin zones |
| Solution Type | Acoustic suite shells, Privacy doors, Sound-masking audio, Acoustic panels, Soft trim systems |
| Cabin Class | Business class suites, First class suites, Premium economy zones |
| Aircraft Type | Wide-body aircraft, Narrow-body aircraft, Business jets |
| Fit Type | Retrofit, Line fit |
| Material Platform | Lightweight composites, Acoustic foams, Barrier fabrics, Engineered textiles |
| Regions Covered | North America, Latin America, Western Europe, Eastern Europe, East Asia, South Asia and Pacific, Middle East and Africa |
| Countries Covered | United States, France, Germany, United Kingdom, China, Japan, United Arab Emirates, and 30+ countries |
| Key Companies Profiled | Safran Seats, Collins Aerospace, RECARO Aircraft Seating, Thompson Aero Seating, Jamco Corporation, Diehl Aviation, Greenpoint Technologies, Lufthansa Technik, Panasonic Avionics, AIM Altitude |
| Forecast Period | 2026 to 2036 |
| Approach | Hybrid bottom-up and top-down methodology using premium seat programs, retrofit cycles, supplier activity and aviation traffic signals |
Source: Future Market Insights, 2026.
Premium Cabin Acoustic Privacy Solutions Market Breakdown by Solution Type, Cabin Class, Aircraft Type, Fit Type, Material Platform, and Region
Premium Cabin Acoustic Privacy Solutions Market Segmented by Solution Type:
- Acoustic suite shells
- Privacy doors
- Sound-masking audio
- Acoustic panels
- Soft trim systems
Premium Cabin Acoustic Privacy Solutions Market Segmented by Cabin Class:
- Business class suites
- First class suites
- Premium economy zones
Premium Cabin Acoustic Privacy Solutions Market Segmented by Aircraft Type:
- Wide-body aircraft
- Narrow-body aircraft
- Business jets
Premium Cabin Acoustic Privacy Solutions Market Segmented by Fit Type:
- Retrofit
- Line fit
Premium Cabin Acoustic Privacy Solutions Market Segmented by Material Platform:
- Lightweight composites
- Acoustic foams
- Barrier fabrics
- Engineered textiles
Premium Cabin Acoustic Privacy Solutions Market by Region:
- North America
- United States
- Canada
- Mexico
- Latin America
- Brazil
- Chile
- Rest of Latin America
- Western Europe
- Germany
- France
- United Kingdom
- Italy
- Spain
- Nordics
- Benelux
- Rest of Western Europe
- Eastern Europe
- Poland
- Russia
- Rest of Eastern Europe
- East Asia
- China
- Japan
- South Korea
- South Asia and Pacific
- India
- Australia
- ASEAN
- Rest of South Asia and Pacific
- Middle East and Africa
- United Arab Emirates
- Saudi Arabia
- South Africa
- Rest of Middle East and Africa
Research Sources and Bibliography
- International Air Transport Association. (2026, January 29). Strong 2025 passenger demand masks ongoing capacity constraints.
- Airbus. (2025, June 12). Airbus Global Market Forecast 2025: People and commerce driving air traffic growth.
- Boeing. (2025, June). Commercial Market Outlook 2025 to 2044.
- Federal Aviation Administration. (2025, October 1). FAA Aerospace Forecast Fiscal Years 2025 to 2045.
- International Civil Aviation Organization. (2025). Annual Report 2024: The world of air transport in 2024.
- United Kingdom Civil Aviation Authority. (2026, February). UK aviation officially breaks records with over 300m passenger journeys in 2025.
- Federal Statistical Office of Germany. (2025, March 20). 7.7% more passengers in 2024.
- Ministry of Ecology, Energy, Sustainable Development and Spatial Planning, France. (2026, April). Key transport figures 2026: Rail and air passenger transport.
- Civil Aviation Administration of China. (2025, January 10). China civil aviation sector soars in 2024.
- Safran Group. (2025, June 17). All Nippon Airways takes business class to new heights with THE Room FX.
- Greenpoint Technologies. (2024, April 22). Greenpoint Technologies inducts BBJ 787-9 for V-VIP interior completion.
- Panasonic Avionics. (2024, May 28). RTX’s Collins Aerospace and Panasonic Avionics unveil MAYA.
- RECARO Aircraft Seating. (2024, September 19). RECARO Aircraft Seating’s R7 selected for LATAM Boeing 787 retrofit.
- RTX. (2026, April 14). Collins Aerospace and Air Canada unveil Aurora suites and economy seats across the carrier’s A321XLR fleet.
This bibliography is provided for reader reference and is not exhaustive. The full report contains the complete reference list and detailed citations.
This Report Answers
- What is the forecast value of the premium cabin acoustic privacy solutions market by 2036?
- Which solution type is expected to account for the leading share in 2026?
- Why are retrofit programs important for premium cabin acoustic privacy solutions suppliers?
- Which countries are expected to record stronger demand through 2036?
- Which companies influence premium cabin acoustic privacy solutions through seat and completion programs?
- How do weight and certification limits affect product selection in aircraft cabins?
- What is the current and future size of the premium cabin acoustic privacy solutions market?
- How fast is the premium cabin acoustic privacy solutions market expected to expand between 2026 and 2036?
- How does FMI define the premium cabin acoustic privacy solutions market scope?
Frequently Asked Questions
What is the premium cabin acoustic privacy solutions market value in 2026?
The premium cabin acoustic privacy solutions market is projected to reach USD 671.5 million in 2026 and USD 1,504.3 million by 2036.
What is the projected CAGR for the premium cabin acoustic privacy solutions market?
The premium cabin acoustic privacy solutions market is projected to expand at 8.4% CAGR from 2026 to 2036.
Which solution type is projected to lead the premium cabin acoustic privacy solutions market?
Acoustic suite shells are projected to account for 38.0% share in 2026 as shell height carries the main privacy function.
Which fit type is expected to lead the premium cabin acoustic privacy solutions market?
Retrofit programs are expected to hold 54.0% share in 2026 as airlines update older premium cabins between fleet cycles.
Which country is forecast to grow fastest in the premium cabin acoustic privacy solutions market?
The United Arab Emirates is forecast at 9.6% CAGR through 2036 as hub airlines keep premium cabins central to long-haul service.
Who are the main companies in the premium cabin acoustic privacy solutions market?
Safran Seats, Collins Aerospace, RECARO Aircraft Seating and Greenpoint Technologies are main companies across seating and completion work.
How do premium cabin acoustic privacy solutions work?
Solutions combine taller shells and privacy doors to form a private zone around premium passengers. Absorptive trim reduces perceived noise and supports personal space inside the cabin during long-haul rest periods.
Why do airlines use acoustic privacy solutions in premium cabins?
Airlines use them to protect fare premiums by making long-haul seats feel more private and better suited for rest.
How long do premium cabin acoustic privacy solutions last?
Service life depends on seat program design and cleaning cycles over each fleet check cycle. Suppliers design parts around door reliability and aircraft cabin maintenance intervals for long service periods.
What affects the cost of premium cabin acoustic privacy solutions?
Cost depends on material weight and certification testing before airline approval is granted. Door mechanics and installation timing affect pricing during line fit or retrofit work cycles.
Preview the report firsthand - request a free sample
Get SampleGet the brochure for pricing and purchase details.
Get PDFTable of Content
- Key Takeaways
- Market Size and CAGR
- Top Growth Driver
- Fastest Growing Segment
- Leading Region
- Key Companies
- Emerging Opportunities
- Executive Summary
- Global Market Outlook
- Demand-side Trends
- Supply-side Trends
- Technology Roadmap Analysis
- Analysis and Recommendations
- Analyst Perspective (What is happening? Why now? What should investors know?)
- Key Questions Answered
- How large is the market?
- What is the CAGR?
- What are key trends?
- Which region dominates?
- Who are the leaders?
- Market Overview
- Market Coverage / Taxonomy
- Market Definition / Scope / Limitations
- Research Methodology
- Chapter Orientation
- Analytical Lens and Working Hypotheses
- Market Structure, Signals, and Trend Drivers
- Benchmarking and Cross-market Comparability
- Market Sizing, Forecasting, and Opportunity Mapping
- Research Design and Evidence Framework
- Desk Research Programme (Secondary Evidence)
- Expert Input and Fieldwork (Primary Evidence)
- Tooling, Models, and Reference Databases
- Data Engineering and Model Build
- Quality Assurance and Audit Trail
- Market Background
- Market Dynamics (Drivers, Restraints, Opportunity, Trends)
- Scenario Forecast (Optimistic, Likely, Conservative)
- Impact Analysis
- AI Impact
- Sustainability Impact
- Regulatory Impact
- Technology Impact
- Consumer / Buyer Analysis
- Purchase Drivers
- Adoption Barriers
- Buyer Journey
- Opportunity Map Analysis
- Product Life Cycle Analysis
- Supply Chain Analysis
- Investment Feasibility Matrix
- Value Chain Analysis
- PESTLE and Porter's Analysis
- Regulatory Landscape
- Regional Parent Market Outlook
- Production and Consumption Statistics
- Import and Export Statistics
- Global Market Analysis and Forecast, 2021 to 2036
- Historical Market Size Value (USD Million) Analysis, 2021 to 2025
- Current and Future Market Size Value (USD Million) Projections, 2026 to 2036
- Y-o-Y Growth Trend Analysis
- Absolute $ Opportunity Analysis
- Global Market Pricing Analysis, 2021 to 2036
- Global Market Analysis and Forecast, By Solution Type, 2021 to 2036
- Introduction / Key Findings
- Historical Market Size Value (USD Million) Analysis By Solution Type, 2021 to 2025
- Current and Future Market Size Value (USD Million) Analysis and Forecast By Solution Type, 2026 to 2036
- Acoustic suite shells
- Privacy doors
- Sound-masking audio
- Acoustic panels
- Soft trim systems
- Acoustic suite shells
- Y-o-Y Growth Trend Analysis By Solution Type, 2021 to 2025
- Absolute $ Opportunity Analysis By Solution Type, 2026 to 2036
- Global Market Analysis and Forecast, By Cabin Class, 2021 to 2036
- Introduction / Key Findings
- Historical Market Size Value (USD Million) Analysis By Cabin Class, 2021 to 2025
- Current and Future Market Size Value (USD Million) Analysis and Forecast By Cabin Class, 2026 to 2036
- Business class suites
- First class suites
- Premium economy zones
- Business class suites
- Y-o-Y Growth Trend Analysis By Cabin Class, 2021 to 2025
- Absolute $ Opportunity Analysis By Cabin Class, 2026 to 2036
- Global Market Analysis and Forecast, By Aircraft Type, 2021 to 2036
- Introduction / Key Findings
- Historical Market Size Value (USD Million) Analysis By Aircraft Type, 2021 to 2025
- Current and Future Market Size Value (USD Million) Analysis and Forecast By Aircraft Type, 2026 to 2036
- Wide-body aircraft
- Narrow-body aircraft
- Business jets
- Wide-body aircraft
- Y-o-Y Growth Trend Analysis By Aircraft Type, 2021 to 2025
- Absolute $ Opportunity Analysis By Aircraft Type, 2026 to 2036
- Global Market Analysis and Forecast, By Fit Type, 2021 to 2036
- Introduction / Key Findings
- Historical Market Size Value (USD Million) Analysis By Fit Type, 2021 to 2025
- Current and Future Market Size Value (USD Million) Analysis and Forecast By Fit Type, 2026 to 2036
- Retrofit
- Line fit
- Retrofit
- Y-o-Y Growth Trend Analysis By Fit Type, 2021 to 2025
- Absolute $ Opportunity Analysis By Fit Type, 2026 to 2036
- Global Market Analysis and Forecast, By Material Platform, 2021 to 2036
- Introduction / Key Findings
- Historical Market Size Value (USD Million) Analysis By Material Platform, 2021 to 2025
- Current and Future Market Size Value (USD Million) Analysis and Forecast By Material Platform, 2026 to 2036
- Lightweight composites
- Acoustic foams
- Barrier fabrics
- Engineered textiles
- Lightweight composites
- Y-o-Y Growth Trend Analysis By Material Platform, 2021 to 2025
- Absolute $ Opportunity Analysis By Material Platform, 2026 to 2036
- Global Market Analysis and Forecast, By Region, 2021 to 2036
- Introduction
- Historical Market Size Value (USD Million) Analysis By Region, 2021 to 2025
- Current Market Size Value (USD Million) Analysis and Forecast By Region, 2026 to 2036
- North America
- Latin America
- Western Europe
- Eastern Europe
- East Asia
- South Asia and Pacific
- Middle East & Africa
- Market Attractiveness Analysis By Region
- North America Market Analysis and Forecast, By Country, 2021 to 2036
- Historical Market Size Value (USD Million) Trend Analysis By Market Taxonomy, 2021 to 2025
- Market Size Value (USD Million) Forecast By Market Taxonomy, 2026 to 2036
- By Country
- USA
- Canada
- By Solution Type
- By Cabin Class
- By Aircraft Type
- By Fit Type
- By Material Platform
- By Country
- Market Attractiveness Analysis
- By Country
- By Solution Type
- By Cabin Class
- By Aircraft Type
- By Fit Type
- By Material Platform
- Key Takeaways
- Latin America Market Analysis and Forecast, By Country
- Historical Market Size Value (USD Million) Trend Analysis By Market Taxonomy, 2021 to 2025
- Market Size Value (USD Million) Forecast By Market Taxonomy, 2026 to 2036
- By Country
- Brazil
- Mexico
- Chile
- Rest of Latin America
- By Solution Type
- By Cabin Class
- By Aircraft Type
- By Fit Type
- By Material Platform
- By Country
- Market Attractiveness Analysis
- By Country
- By Solution Type
- By Cabin Class
- By Aircraft Type
- By Fit Type
- By Material Platform
- Key Takeaways
- Western Europe Market Analysis and Forecast, By Country
- Historical Market Size Value (USD Million) Trend Analysis By Market Taxonomy, 2021 to 2025
- Market Size Value (USD Million) Forecast By Market Taxonomy, 2026 to 2036
- By Country
- Germany
- UK
- Italy
- Spain
- France
- Nordic
- BENELUX
- Rest of Western Europe
- By Solution Type
- By Cabin Class
- By Aircraft Type
- By Fit Type
- By Material Platform
- By Country
- Market Attractiveness Analysis
- By Country
- By Solution Type
- By Cabin Class
- By Aircraft Type
- By Fit Type
- By Material Platform
- Key Takeaways
- Eastern Europe Market Analysis and Forecast, By Country
- Historical Market Size Value (USD Million) Trend Analysis By Market Taxonomy, 2021 to 2025
- Market Size Value (USD Million) Forecast By Market Taxonomy, 2026 to 2036
- By Country
- Russia
- Poland
- Hungary
- Balkan & Baltic
- Rest of Eastern Europe
- By Solution Type
- By Cabin Class
- By Aircraft Type
- By Fit Type
- By Material Platform
- By Country
- Market Attractiveness Analysis
- By Country
- By Solution Type
- By Cabin Class
- By Aircraft Type
- By Fit Type
- By Material Platform
- Key Takeaways
- East Asia Market Analysis and Forecast, By Country
- Historical Market Size Value (USD Million) Trend Analysis By Market Taxonomy, 2021 to 2025
- Market Size Value (USD Million) Forecast By Market Taxonomy, 2026 to 2036
- By Country
- China
- Japan
- South Korea
- By Solution Type
- By Cabin Class
- By Aircraft Type
- By Fit Type
- By Material Platform
- By Country
- Market Attractiveness Analysis
- By Country
- By Solution Type
- By Cabin Class
- By Aircraft Type
- By Fit Type
- By Material Platform
- Key Takeaways
- South Asia and Pacific Market Analysis and Forecast, By Country
- Historical Market Size Value (USD Million) Trend Analysis By Market Taxonomy, 2021 to 2025
- Market Size Value (USD Million) Forecast By Market Taxonomy, 2026 to 2036
- By Country
- India
- ASEAN
- Australia & New Zealand
- Rest of South Asia and Pacific
- By Solution Type
- By Cabin Class
- By Aircraft Type
- By Fit Type
- By Material Platform
- By Country
- Market Attractiveness Analysis
- By Country
- By Solution Type
- By Cabin Class
- By Aircraft Type
- By Fit Type
- By Material Platform
- Key Takeaways
- Middle East & Africa Market Analysis and Forecast, By Country
- Historical Market Size Value (USD Million) Trend Analysis By Market Taxonomy, 2021 to 2025
- Market Size Value (USD Million) Forecast By Market Taxonomy, 2026 to 2036
- By Country
- Kingdom of Saudi Arabia
- Other GCC Countries
- Türkiye
- South Africa
- Other African Union
- Rest of Middle East & Africa
- By Solution Type
- By Cabin Class
- By Aircraft Type
- By Fit Type
- By Material Platform
- By Country
- Market Attractiveness Analysis
- By Country
- By Solution Type
- By Cabin Class
- By Aircraft Type
- By Fit Type
- By Material Platform
- Key Takeaways
- Key Countries Market Analysis
- USA
- Pricing Analysis
- Market Share Analysis, 2025
- By Solution Type
- By Cabin Class
- By Aircraft Type
- By Fit Type
- By Material Platform
- Canada
- Pricing Analysis
- Market Share Analysis, 2025
- By Solution Type
- By Cabin Class
- By Aircraft Type
- By Fit Type
- By Material Platform
- Mexico
- Pricing Analysis
- Market Share Analysis, 2025
- By Solution Type
- By Cabin Class
- By Aircraft Type
- By Fit Type
- By Material Platform
- Brazil
- Pricing Analysis
- Market Share Analysis, 2025
- By Solution Type
- By Cabin Class
- By Aircraft Type
- By Fit Type
- By Material Platform
- Chile
- Pricing Analysis
- Market Share Analysis, 2025
- By Solution Type
- By Cabin Class
- By Aircraft Type
- By Fit Type
- By Material Platform
- Germany
- Pricing Analysis
- Market Share Analysis, 2025
- By Solution Type
- By Cabin Class
- By Aircraft Type
- By Fit Type
- By Material Platform
- UK
- Pricing Analysis
- Market Share Analysis, 2025
- By Solution Type
- By Cabin Class
- By Aircraft Type
- By Fit Type
- By Material Platform
- Italy
- Pricing Analysis
- Market Share Analysis, 2025
- By Solution Type
- By Cabin Class
- By Aircraft Type
- By Fit Type
- By Material Platform
- Spain
- Pricing Analysis
- Market Share Analysis, 2025
- By Solution Type
- By Cabin Class
- By Aircraft Type
- By Fit Type
- By Material Platform
- France
- Pricing Analysis
- Market Share Analysis, 2025
- By Solution Type
- By Cabin Class
- By Aircraft Type
- By Fit Type
- By Material Platform
- India
- Pricing Analysis
- Market Share Analysis, 2025
- By Solution Type
- By Cabin Class
- By Aircraft Type
- By Fit Type
- By Material Platform
- ASEAN
- Pricing Analysis
- Market Share Analysis, 2025
- By Solution Type
- By Cabin Class
- By Aircraft Type
- By Fit Type
- By Material Platform
- Australia & New Zealand
- Pricing Analysis
- Market Share Analysis, 2025
- By Solution Type
- By Cabin Class
- By Aircraft Type
- By Fit Type
- By Material Platform
- China
- Pricing Analysis
- Market Share Analysis, 2025
- By Solution Type
- By Cabin Class
- By Aircraft Type
- By Fit Type
- By Material Platform
- Japan
- Pricing Analysis
- Market Share Analysis, 2025
- By Solution Type
- By Cabin Class
- By Aircraft Type
- By Fit Type
- By Material Platform
- South Korea
- Pricing Analysis
- Market Share Analysis, 2025
- By Solution Type
- By Cabin Class
- By Aircraft Type
- By Fit Type
- By Material Platform
- Russia
- Pricing Analysis
- Market Share Analysis, 2025
- By Solution Type
- By Cabin Class
- By Aircraft Type
- By Fit Type
- By Material Platform
- Poland
- Pricing Analysis
- Market Share Analysis, 2025
- By Solution Type
- By Cabin Class
- By Aircraft Type
- By Fit Type
- By Material Platform
- Hungary
- Pricing Analysis
- Market Share Analysis, 2025
- By Solution Type
- By Cabin Class
- By Aircraft Type
- By Fit Type
- By Material Platform
- Kingdom of Saudi Arabia
- Pricing Analysis
- Market Share Analysis, 2025
- By Solution Type
- By Cabin Class
- By Aircraft Type
- By Fit Type
- By Material Platform
- Türkiye
- Pricing Analysis
- Market Share Analysis, 2025
- By Solution Type
- By Cabin Class
- By Aircraft Type
- By Fit Type
- By Material Platform
- South Africa
- Pricing Analysis
- Market Share Analysis, 2025
- By Solution Type
- By Cabin Class
- By Aircraft Type
- By Fit Type
- By Material Platform
- USA
- Market Structure Analysis
- Competition Dashboard
- Competition Benchmarking
- Market Share Analysis of Top Players
- By Regional
- By Solution Type
- By Cabin Class
- By Aircraft Type
- By Fit Type
- By Material Platform
- Emerging Startups
- Innovation Benchmarking
- Competition Analysis
- Competition Deep Dive
- Safran Seats
- Overview
- Product Portfolio
- Profitability by Market Segments
- Sales Footprint
- Strategy Overview
- Marketing Strategy
- Product Strategy
- Channel Strategy
- Collins Aerospace
- RECARO Aircraft Seating
- Thompson Aero Seating
- Jamco Corporation
- Diehl Aviation
- Greenpoint Technologies
- Lufthansa Technik
- Panasonic Avionics
- AIM Altitude
- Safran Seats
- Case Studies
- Success Stories
- Recent Developments
- Competition Deep Dive
- Assumptions & Acronyms Used


