

- Market Size (2026)
- USD 0.89 Bn
- Forecast (2036)
- USD 2.09 Bn
- CAGR (2026 to 2036)
- 8.9%
Privacy Door-Equipped Premium Cabin Seat Systems Market Size, Market Forecast and Outlook By FMI
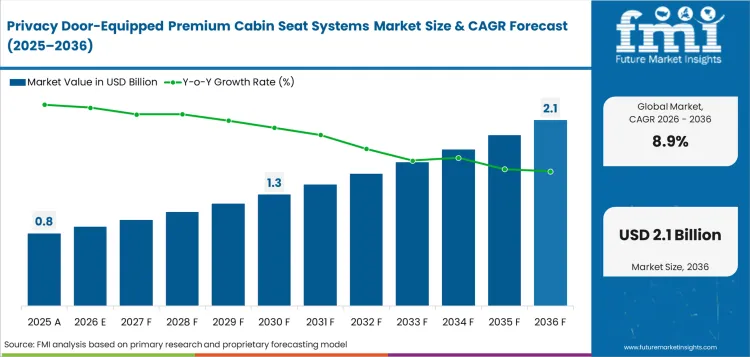
Privacy door-equipped premium cabin seat systems market was valued at USD 0.82 billion in 2025 and is projected to reach USD 0.89 billion in 2026. The market is forecast to reach USD 2.09 billion by 2036 at 8.9% CAGR. Business suites are projected to lead with 64.0% share in 2026. Wide-body aircraft are expected to hold 68.0% share of aircraft platform demand in 2026.
Summary of the Privacy Door-Equipped Premium Cabin Seat Systems Market
- Demand and Growth Drivers
- Long-haul airlines are using privacy doors to protect business class pricing on premium routes.
- Retrofit programs are expanding as carriers refurbish Boeing 777 and Boeing 787 cabins.
- The aircraft seating category supports supplier investment in certified premium platforms.
- Cabin programs are shifting from curtains and dividers toward hard-door suite shells.
- Product and Segment View
- Business suites are projected to account for 64.0% share in 2026 as airlines standardize private pods.
- Wide-body aircraft are expected to hold 68.0% share in 2026 as long-haul premium cabin density.
- Line-fit is forecast to account for 56.0% share in 2026 since doors are easier to certify before aircraft delivery.
- Reverse herringbone layouts are projected to account for 38.0% share in 2026 for aisle access and privacy balance.
- Geography and Competitive Outlook
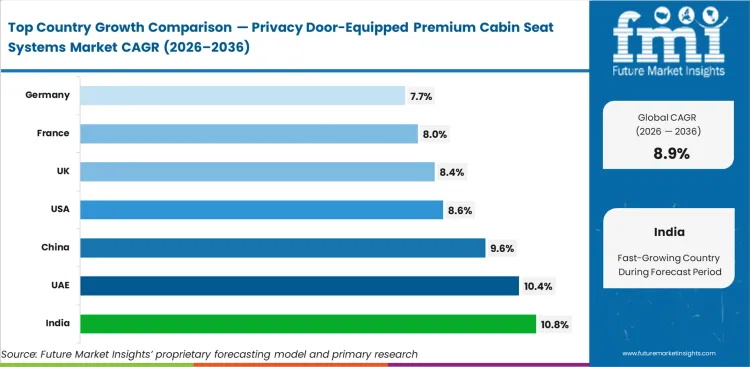
- India is projected to record 10.8% CAGR through 2036 as long-haul fleet growth widens premium cabin needs.
- The United Arab Emirates is expected to expand at 10.4% CAGR through 2036 as fleet refurbishment and hub carrier investment.
- Safran Seats and Collins Aerospace shape the higher-volume suite pipeline.
- RECARO Aircraft Seating and Thompson Aero Seating gain attention through lighter certified premium products.
- Analyst Opinion
- Nikhil Kaitwade, Principal Consultant at FMI says, “The next stage of premium cabin seating is being defined by privacy certification and revenue control. Airlines buy a cabin tool that changes fare fences and front-row pricing. Brand memory is part of the same cabin choice. Suppliers that prove weight control and certification timing will gain repeat programs.”
- Privacy Door-Equipped Premium Cabin Seat Systems Market Value Analysis
- Market growth is driven by the shift from flagship installations to repeat cabin programs, with expanding retrofit awards and premium cabin rebalancing supporting long-term expansion.
- Demand is increasing as airlines focus on upgrading existing long-haul fleets through retrofit programs to sustain premium cabin competitiveness and revenue potential.
- Adoption is accelerating as carriers move beyond limited flagship deployments and standardize privacy door suites across wider cabin programs and aircraft fleets.
Key Takeaways, Market Size, and Forecast
- The privacy door-equipped premium cabin seat systems market was valued at USD 0.82 billion in 2025.
- By 2036, the market is expected to be worth USD 2.09 billion.
- From 2026 to 2036, the market is projected to expand at 8.9% CAGR.
- The market is projected to create an incremental opportunity of USD 1.20 billion between 2026 and 2036.
- Business suites are projected to account for 64.0% share of seat class demand in 2026.
- Wide-body aircraft are expected to account for 68.0% share of aircraft platform demand in 2026.
- India at 10.8% CAGR and the United Arab Emirates at 10.4% CAGR are the faster expanding country markets.
Privacy door-equipped premium cabin seat systems are witnessing commercial demand because airlines now use the door as a paid-product boundary. For instance, Turkish Airlines’ July 2024 Crystal Business Class Suite added an adjustable suite door and privacy panel, making enclosed business class part of fleet renewal instead of only first class.
Seat suppliers now need to combine door mechanics with power and IFE integration because the suite is sold as a complete private space. RECARO’s April 2025 LATAM R7 retrofit covers 24 shipsets for Boeing 787-8 and 787-9 aircraft with increased shell height and a suite door. Air India’s January 2026 Boeing 787-9 cabin includes 30 Business Class suites with sliding privacy doors. The same source says passenger use of the door is pending regulatory approval. Certification readiness is becoming a real purchase filter because an installed door still needs approval before it can deliver passenger value.
Privacy Door-Equipped Premium Cabin Seat Systems Market Definition
The privacy door-equipped premium cabin seat systems market covers certified aircraft seat suites that include a closing privacy door. Scope includes business class suites and first class suites. Front-row studio products and enclosed premium cabin modules are included. Revenue covers the seat structure and door mechanism. Surround shells and integrated controls are included with cabin integration work.
Privacy Door-Equipped Premium Cabin Seat Systems Market Inclusions
Market scope includes commercial aircraft and business jets where the seat is sold as a premium cabin system. Line-fit and retrofit programs are included. The scope includes suite doors and shell panels. Monument interfaces and seat actuation are included when tied to the seat system. Adjacent commercial aircraft cabin interior spending is included only when it is tied to the seat suite.
Privacy Door-Equipped Premium Cabin Seat Systems Market Exclusions
Scope excludes economy seats without enclosure systems and premium economy seats without a door or meaningful partition. Curtains and class dividers are excluded unless supplied as part of an enclosed seat suite. Soft privacy screens are excluded on the same basis. Standalone in-flight entertainment and cabin lighting are excluded unless bundled into a seat system contract. Galleys and floor panels are excluded when bundled into the suite contract.
Privacy Door-Equipped Premium Cabin Seat Systems Market Research Methodology
- Primary Research: FMI analysts reviewed airline cabin plans and seat supplier portfolios. Certification paths and premium retrofit signals were checked across large aviation countries.
- Desk Research: The study used public data from aviation agencies and aircraft makers. Airline announcements and official supplier releases were used for program checks.
- Market sizing and forecasting: Market size was estimated through a hybrid bottom-up and top-down method. Shipsets and suite pricing were checked against aircraft delivery signals.
- Data validation: Forecast checks compared aircraft deliveries and cabin retrofit programs. Premium seating orders and country aviation traffic signals were checked separately.
Why is the Privacy Door-Equipped Premium Cabin Seat Systems Market Growing?
- Airlines are using enclosed suites to separate premium fares from standard business class fares.
- Retrofit work is creating demand as older long-haul aircraft receive new cabin products.
- Certification-ready seat platforms are gaining preference since door mechanisms affect aisle clearance and emergency rules.
Global passenger traffic is supporting cabin upgrades in long-haul fleets. International Air Transport Association reported in January 2026 that 2025 passenger demand increased 5.3% against 2024. Higher traffic gives airlines a reason to refresh premium cabins. Enclosed suites help carriers protect yields on routes where corporate and leisure premium travel overlap.
Fleet renewal opens another route for the same product group. Airbus expects global passenger traffic to grow 3.6% annually over the long term. Traffic growth supports wide-body and long-range narrow-body plans. Seat makers that can supply certified doors at volume can convert aircraft orders into cabin-system awards.
Market Segmentation Analysis
- Business suites are projected to reach 64.0% share in 2026 as doors become a standard business class feature on long-haul aircraft.
- Wide-body aircraft are expected to represent 68.0% share in 2026 as larger cabins support higher suite counts.
- Line-fit is forecast to account for 56.0% share in 2026 since aircraft-level integration is easier before delivery.
- Sliding doors are projected to capture 72.0% share in 2026 as suppliers use compact rails and proven closing systems.
- Reverse herringbone layouts are expected to hold 38.0% share in 2026 for privacy and aisle access balance.
The market is divided into five primary segment groups. Seat class and aircraft platform define the main buying frame. Seat class explains the fare product that the system supports. Aircraft platform shows where certified cabin space exists. Fitment describes whether the suite is installed during production or cabin renewal.
Insights into the Business Suites Seat Class Segment
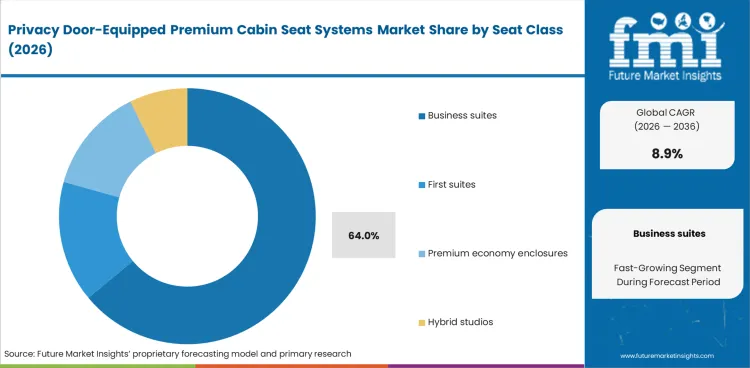
- Business suites are projected to account for 64.0% share of seat class demand in 2026. Business suites hold this position since airlines can sell privacy without removing too many seats. United announced in May 2025 that its Polaris Studio suites would be 25% larger than standard Polaris and include privacy doors. United's launch shows how premium space is being priced as a separate product.
- First suites remain important. Fewer aircraft carry large first class cabins. Hybrid studio products are gaining attention in the first row. Suppliers that offer modular first-row upgrades can raise revenue per shipset without redesigning the whole cabin.
Insights into the Wide-Body Aircraft Platform Segment
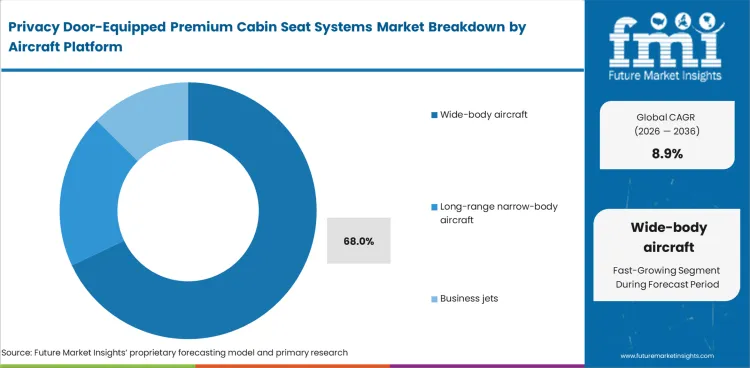
- Wide-body aircraft are expected to account for 68.0% share of aircraft platform demand in 2026. Long-haul layouts carry the seat count and fare premium needed to support full suite doors. Boeing expects 7,815 wide-body deliveries in its 2025 to 2044 commercial outlook. Boeing's long delivery cycle supports repeated premium cabin awards.
- Long-range narrow-body aircraft are a smaller but rising platform. STELIA Aerospace OPERA SA shows how fully enclosed single-aisle cabins are entering long-haul routes. The platform shift is important for airlines that want private business suites on thinner routes.
Insights into the Line-Fit Fitment Segment
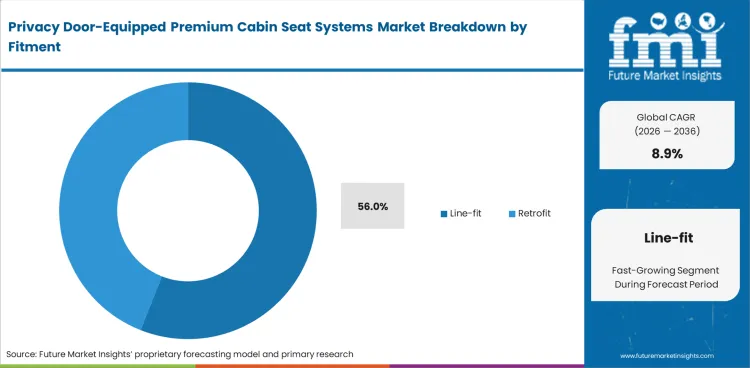
- Line-fit is forecast to account for 56.0% share of fitment demand in 2026. Door-equipped seats affect cabin monuments and emergency movement.
- Retrofit work remains commercially important for large airlines. Safran was selected in November 2025 for Emirates cabin refurbishments across 111 Boeing 777-300ER and Airbus A380 aircraft. These programs create large shipset demand and give suppliers longer production visibility.
Insights into the Sliding Doors Door Type Segment
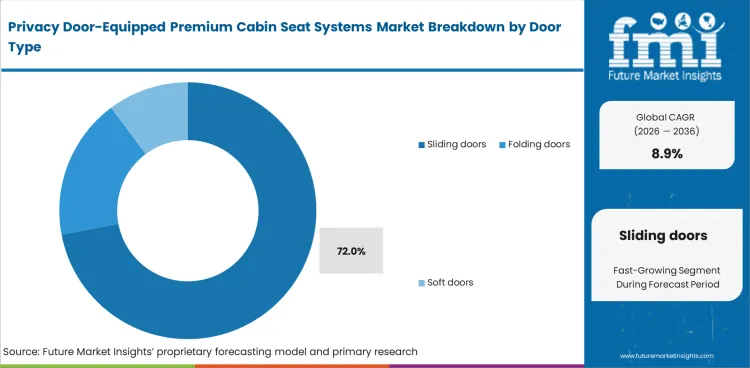
- Sliding doors are projected to account for 72.0% share of door type demand in 2026. They fit narrow aisles and can be packaged inside a hard shell.
- Soft doors and folding doors serve narrower cabins where hard partitions are difficult to certify. The role of aircraft curtains is shifting toward secondary privacy. Hard doors are preferred when airlines want a cabin product that can be priced as a suite.
Insights into the Reverse Herringbone Seat Layout Segment
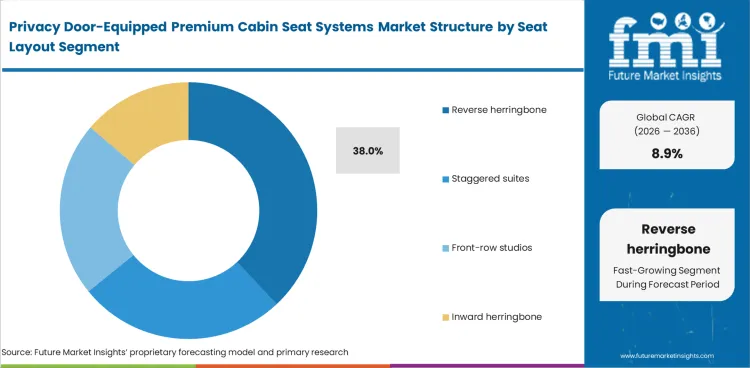
- Reverse herringbone layouts are projected to account for 38.0% share of seat layout demand in 2026. The layout gives direct aisle access and natural shoulder privacy.
- Staggered suites and front-row studios are being added to premium airline programs. These layouts allow larger personal space in selected rows. They support fare differentiation without changing every business class position.
Privacy Door-Equipped Premium Cabin Seat Systems Market Drivers, Restraints, and Opportunities
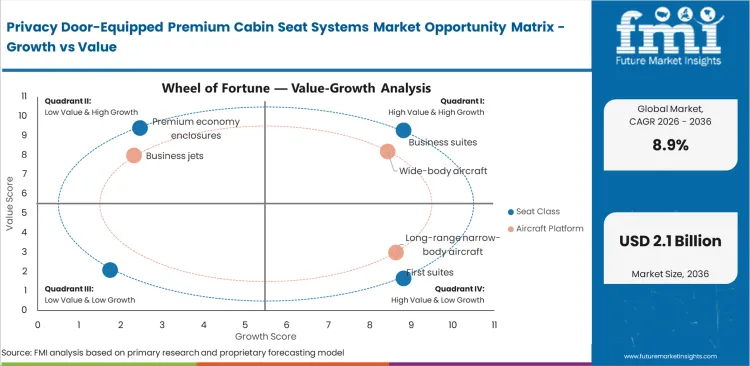
- Premium fare separation is raising the appeal of enclosed business suites.
- Certification timing can slow programs because doors change aisle clearance and monument interfaces.
- Front-row studio upgrades create opportunity where airlines want a higher fare product inside business class.
Market growth is anticipated to be drive by airline revenue management. Airlines can use privacy doors to sell a stronger premium product on high-yield routes. The International Air Transport Association December 2025 outlook forecast 4.9% passenger traffic growth for 2026. A 4.9% traffic outlook gives carriers room to test private suites and studio upgrades.
Certification Timing Is Slowing Some Programs
One of the growth restraint is the time needed to certify doors and latches in a complete aircraft cabin. Rails and clearance add further engineering checks. Door locks and emergency movement rules can delay use after delivery. Suppliers with proven engineering packages have a clear advantage in airline selection.
Studio Rows Are Creating New Value
A lucrative opportunity is projected to be in front-row suites and business-plus layouts. These products convert unused bulkhead space into a higher fare seat. The opportunity also supports aircraft refurbishing programs where airlines can reset cabin pricing. Seat makers that combine privacy and weight control can win repeat cabin programs.
Analysis of Privacy Door-Equipped Premium Cabin Seat Systems Market by Key Countries
.webp "Top Country Growth Comparison Privacy Door Equipped Premium Cabin Seat Systems Market Cagr (2026 2036)")
| Country | CAGR |
|---|---|
| United States | 8.6% |
| China | 9.6% |
| India | 10.8% |
| France | 8.0% |
| Germany | 7.7% |
| United Kingdom | 8.4% |
| United Arab Emirates | 10.4% |
Source: Future Market Insights, 2026.
Privacy Door-Equipped Premium Cabin Seat Systems Market CAGR Analysis by Country
- India is projected to record 10.8% CAGR through 2036 as long-haul fleet growth expands premium cabin planning.
- The United Arab Emirates is expected to expand at 10.4% CAGR through 2036 as hub carriers continue major cabin refurbishments.
- China is forecast to grow at 9.6% CAGR through 2036 as airport throughput and long-haul routes recover.
- The United States is expected to advance at 8.6% CAGR through 2036 as premium cabin renewal by major carriers.
- The United Kingdom is projected to rise at 8.4% CAGR through 2036 as long-haul hubs support high-value cabin upgrades.
- France is forecast at 8.0% CAGR through 2036 as Safran and STELIA support premium seat supply.
- Germany is expected to post 7.7% CAGR through 2036 as RECARO and aerospace suppliers serve cabin renewal demand.
Country-level analysis covers markets where airlines and aircraft makers shape the door-suite buying cycle. Seat suppliers define the execution route. India and the United Arab Emirates track above the global pace. France and Germany grow slightly below the global pace since supplier maturity is high and replacement cycles are steadier.
Demand Outlook for Privacy Door-Equipped Premium Cabin Seat Systems Market in the United States
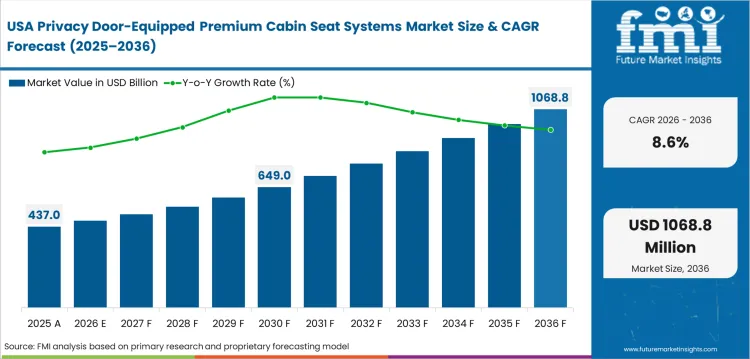
The United States is projected to record 8.6% CAGR through 2036 as major carriers add enclosed suites to long-haul aircraft. United States Bureau of Transportation Statistics data released in March 2026 showed U.S. airlines carried 81.2 million scheduled passengers in December 2025. Premium cabin investments are supported by large international networks and strong loyalty programs. Seat suppliers in the United States benefit from airline proximity and certification support.
- United Airlines is using privacy doors to lift Polaris and Polaris Studio positioning on Boeing 787 aircraft.
- Collins Aerospace remains important where cabin systems and seating integration are evaluated together.
- Elevate Aircraft Seating gives U.S. airlines a domestic source for Ascent type business suites.
Sales Analysis of Privacy Door-Equipped Premium Cabin Seat Systems Market in China
China is expected to expand at 9.6% CAGR through 2036 as long-haul capacity and domestic premium travel recover. The Civil Aviation Administration of China reported in April 2026 1.529 billion passenger trips at national commercial airports in 2025. International routes reached 117.796 million passenger trips in the same year. This route recovery supports premium cabin renewal for airlines serving Europe and North America.
- Chinese wide-body operators need privacy products that fit high-density long-haul layouts.
- Domestic aerospace policy supports local cabin suppliers and selected international partnerships.
- Airlines can use enclosed suites to compete on route quality beyond ticket price.
Demand Outlook for Privacy Door-Equipped Premium Cabin Seat Systems Market in India
Wide-body additions are forecast to propel industry in India at 10.8% CAGR through 2036 as airlines add longer routes. India’s Press Information Bureau reported in January 2026 that Indian airports handled 412 million passengers in FY25. The same source projected 665 million passengers by FY31. Premium suites are expected to enter through international fleet programs before wider domestic use.
- Air India and IndiGo long-haul plans create a stronger opening for enclosed premium cabins.
- Supplier support will be needed around certification and cabin maintenance training.
- India can become a higher-volume buyer once wide-body routes mature across major hubs.
Opportunity Analysis of Privacy Door-Equipped Premium Cabin Seat Systems Market in France
France is expected to advance at 8.0% CAGR through 2036 as aerospace supply strength supports premium cabin exports. The European Organisation for the Safety of Air Navigation (EUROCONTROL) recorded France as the busiest European aviation state in 2025 with 9,854 average daily flights. This traffic scale reinforces France’s role in aircraft and cabin supply.
- Safran Seats is placed to serve both line-fit and retrofit programs from a broad product range.
- STELIA Aerospace supports single-aisle and wide-body premium privacy concepts through OPERA products.
- French suppliers can win when airlines need certified cabins and design customization together.
Future Outlook for Privacy Door-Equipped Premium Cabin Seat Systems Market in Germany
The industry in Germany is forecast to expand at 7.7% CAGR through 2036 with aerospace production and airline groups supporting cabin upgrades. EUROCONTROL reported 8,616 average daily flights for Germany in 2025. German suppliers focus strongly on certified engineering and weight control. Weight control suits airlines that want privacy doors without adding avoidable seat mass.
- RECARO Aircraft Seating can defend share through lighter R7 suite positioning.
- German aviation customers place high value on certification evidence and service reliability.
- Retrofit programs create steady demand but line-fit programs decide supplier visibility.
Sales Analysis of Privacy Door-Equipped Premium Cabin Seat Systems Market in the United Kingdom
Long-haul hub traffic is projected to keep the United Kingdom at 8.4% CAGR through 2036. The United Kingdom Civil Aviation Authority reported in February 2026 that UK airports handled 302 million passenger journeys in 2025. London and Manchester routes support premium products where business and high-end leisure demand overlap.
- Thompson Aero Seating’s Vantage range gives airlines options across single-aisle and twin-aisle programs.
- UK-based design and trim partners support customization around premium cabin brand identity.
- Airlines will favor suppliers that balance suite privacy with cabin density.
Future Outlook for Privacy Door-Equipped Premium Cabin Seat Systems Market in the United Arab Emirates
The United Arab Emirates is expected to post 10.4% CAGR through 2036 as hub carriers renew long-haul cabins. Emirates and Safran said in November 2025 that their Dubai seat assembly unit would initially assemble up to 1,000 business class seats per year. The same plan covers a 20,000 to 25,000 square meter industrial footprint. The Dubai plan makes the country a direct premium cabin production and retrofit node.
- Emirates refurbishment work gives suppliers a high-volume reference point in door-suite programs.
- Dubai can reduce lead times when seat assembly is placed near aircraft modification work.
- Regional airlines will use privacy suites to protect premium hub traffic against Asian and European rivals.
Competitive Landscape and Strategic Positioning
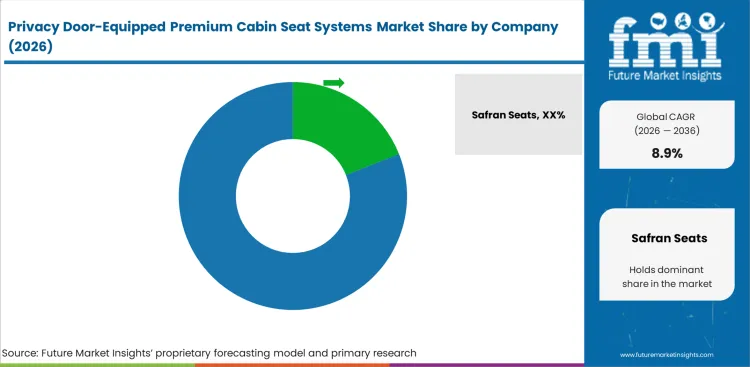
- Seat suppliers compete on certification readiness and suite weight.
- Aircraft interior groups gain share when they combine doors and actuation.
- Specialist seat makers can win where airlines need layout-specific privacy without a full cabin redesign.
- Retrofit awards favor suppliers with repair support and reliable production timing.
Competition is centered on certified platform depth instead of concept design alone. For example, companies such as Safran Seats have a solid position across first and business programs. Economy programs add production volume. The company said in March 2026 that business-class seat deliveries reached 2,632 units in 2025. That production signal supports confidence in higher-volume premium programs.
Market players such as Collins Aerospace and Elevate Aircraft Seating compete actively with U.S. airline links. RECARO Aircraft Seating competes with lightweight business class platforms. Thompson Aero Seating competes well in premium business-class layouts. STELIA Aerospace and JAMCO add depth in wide-body and single-aisle suite concepts.
Key Companies in the Privacy Door-Equipped Premium Cabin Seat Systems Market
Competition is best read by role because platform certification and airline fit differ sharply.
- Integrated Seat System Leaders: Safran Seats and Collins Aerospace hold solid positions through broad cabin programs and certification depth. These companies can support line-fit and retrofit work across major aircraft platforms.
- Specialist Premium Seat Makers: RECARO Aircraft Seating and Thompson Aero Seating compete with layout-specific premium products. Their advantage is clearer when airlines need cabin density and privacy together.
- Suite Concept and Regional Specialists: STELIA Aerospace and JAMCO Corporation support enclosed suite demand through OPERA and Venture products. Elevate Aircraft Seating supports the same pool through Ascent.
Competitive Benchmarking: Privacy Door-Equipped Premium Cabin Seat Systems Market
| Company | Door Suite Depth | Certification Support | Retrofit Reach | Geographic Footprint |
|---|---|---|---|---|
| Safran Seats | High | Strong | Strong | Global with France and UAE production links |
| Collins Aerospace | High | Strong | Medium | Global with strong United States airline access |
| RECARO Aircraft Seating | Medium | Strong | Strong | Germany centered with global airline programs |
| Thompson Aero Seating | High | Medium | Strong | United Kingdom centered with premium business-class depth |
| STELIA Aerospace | High | Strong | Medium | France centered with Airbus platform familiarity |
| JAMCO Corporation | Medium | Medium | Strong | Japan centered with Boeing 787 premium cabin links |
| Elevate Aircraft Seating | Medium | Medium | Medium | United States centered with Ascent suite focus |
Source: Future Market Insights competitive analysis, 2026. Ratings reflect relative positioning based on door-suite depth and certification support.
Key Developments in Privacy Door-Equipped Premium Cabin Seat Systems Market
- In November 2025, Emirates and Safran signed a memorandum of understanding for a Dubai seat assembly facility with up to 1,000 business class seats per year.
- In March 2026, United opened sales for its first Boeing 787-9 flights with the Elevated interior.
- In April 2025, Adient Aerospace became Elevate Aircraft Seating and continued to position Ascent as a door-equipped business suite.
Key Players in the Privacy Door-Equipped Premium Cabin Seat Systems Market
- Major Global Players:
- Safran Seats
- Collins Aerospace
- RECARO Aircraft Seating
- Thompson Aero Seating
- Specialist and Regional Players:
- STELIA Aerospace
- JAMCO Corporation
- Elevate Aircraft Seating
Report Scope and Coverage
| Parameter | Details |
|---|---|
| Quantitative Units | USD 0.89 billion to USD 2.09 billion at 8.9% CAGR |
| Market Definition | Certified premium aircraft seat suites with privacy doors for commercial and business aircraft |
| Seat Class | Business suites, First suites, Premium economy enclosures, Hybrid studios |
| Aircraft Platform | Wide-body aircraft, Long-range narrow-body aircraft, Business jets |
| Fitment | Line-fit, Retrofit |
| Door Type | Sliding doors, Folding doors, Soft doors |
| Seat Layout | Reverse herringbone, Staggered suites, Front-row studios, Inward herringbone |
| Regions Covered | North America, Latin America, Western Europe, Eastern Europe, East Asia, South Asia and Pacific, Middle East and Africa |
| Countries Covered | United States, China, India, France, Germany, United Kingdom, United Arab Emirates, and 30+ countries |
| Key Companies Profiled | Safran Seats, Collins Aerospace, RECARO Aircraft Seating, Thompson Aero Seating, STELIA Aerospace, JAMCO Corporation, Elevate Aircraft Seating |
| Forecast Period | 2026 to 2036 |
| Approach | Hybrid bottom-up and top-down methodology using shipsets, suite pricing, aircraft delivery signals, and retrofit evidence |
Source: Future Market Insights, 2026.
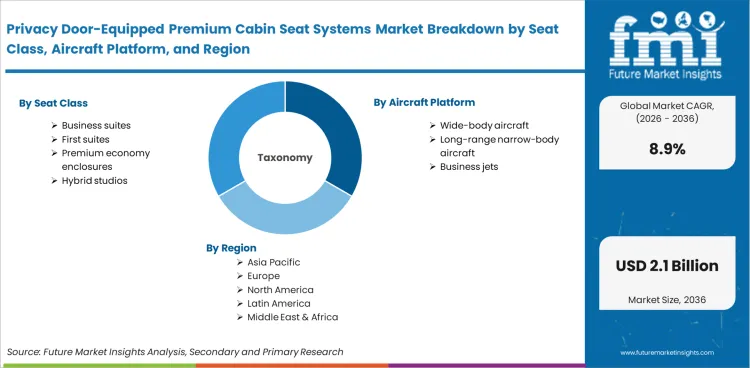
Privacy Door-Equipped Premium Cabin Seat Systems Market Breakdown by Seat Class, Aircraft Platform, Fitment, Door Type, Seat Layout, and Region
Privacy Door-Equipped Premium Cabin Seat Systems Market Segmented by Seat Class:
- Business suites
- First suites
- Premium economy enclosures
- Hybrid studios
Privacy Door-Equipped Premium Cabin Seat Systems Market Segmented by Aircraft Platform:
- Wide-body aircraft
- Long-range narrow-body aircraft
- Business jets
Privacy Door-Equipped Premium Cabin Seat Systems Market Segmented by Fitment:
- Line-fit
- Retrofit
Privacy Door-Equipped Premium Cabin Seat Systems Market Segmented by Door Type:
- Sliding doors
- Folding doors
- Soft doors
Privacy Door-Equipped Premium Cabin Seat Systems Market Segmented by Seat Layout:
- Reverse herringbone
- Staggered suites
- Front-row studios
- Inward herringbone
Privacy Door-Equipped Premium Cabin Seat Systems Market by Region:
- North America
- United States
- Canada
- Europe
- Germany
- United Kingdom
- France
- Italy
- Spain
- Asia Pacific
- China
- Japan
- South Korea
- Taiwan
- Singapore
- Latin America
- Brazil
- Mexico
- Argentina
- Middle East & Africa
- GCC Countries
- South Africa
- Israel
Research Sources and Bibliography
- Airbus. (2025, June). Airbus Global Market Forecast 2025: People and commerce driving air traffic growth. Airbus.
- Airbus. (2025, October). Airbus Global Services Forecast 2025 to 2044. Airbus.
- Boeing. (2025, June). Commercial Market Outlook 2025 to 2044. Boeing.
- Bureau of Transportation Statistics. (2026, March 13). December 2025 U.S. airline traffic data down 2.6% from same month last year. United States Department of Transportation.
- Civil Aviation Administration of China. (2026, April 3). 2025 National Civil Transport Airport Production Statistics Bulletin released. Civil Aviation Administration of China.
- European Organisation for the Safety of Air Navigation. (2026, January 23). European aviation overview 2025. EUROCONTROL.
- International Air Transport Association. (2026, January 29). Strong 2025 passenger demand masks ongoing capacity constraints. IATA.
- International Air Transport Association. (2025, December 9). Global outlook for air transport in 2026. IATA.
- Press Information Bureau. (2026, January 29). Government of India civil aviation update. Government of India.
- United Kingdom Civil Aviation Authority. (2026, February 24). UK aviation officially breaks records with over 300m passenger journeys in 2025. CAA.
- Emirates. (2025, November 18). Emirates and Safran sign MoU to bring manufacturing and seat assembly unit to Dubai. Emirates Media Centre.
- Safran. (2025, November 18). Safran selected to support upgrade of Emirates fleet with new Business and Economy class seats. Safran Group.
- RECARO Aircraft Seating. (2024, September 19). RECARO Aircraft Seating’s R7 selected for LATAM Boeing 787 retrofit. RECARO.
- Thompson Aero Seating. (2024, April 16). Thompson Aero Seating at AIX 2024. Thompson Aero Seating.
- STELIA Aerospace. (2025, March). STELIA Aerospace unveils a reinvented Rendez-Vous and showcases the entire OPERA family at Aircraft Interiors Expo 2025. STELIA Aerospace.
- United Airlines. (2025, May). United unveils the Elevated aircraft interior. United Airlines.
- Qatar Airways. (2024, July 22). Qatar Airways unveils Qsuite Next Gen. Qatar Airways.
The bibliography uses official sources relevant to premium cabin seating demand signals.
This Report Answers
- What is the current and future size of the privacy door-equipped premium cabin seat systems market?
- How fast is the privacy door-equipped premium cabin seat systems market expected to expand between 2026 and 2036?
- Which seat class is expected to lead privacy door-equipped premium cabin seat systems demand by 2026?
- Which aircraft platform is projected to account for the strongest privacy door-equipped premium cabin seat systems share in 2026?
- Why are wide-body aircraft and retrofit programs important for this market?
- How do certification timing and door mechanism reliability affect airline selection?
- Which countries are forecast to expand faster in privacy door-equipped premium cabin seat systems demand?
- Which companies compete in privacy door-equipped premium cabin seat systems supply?
- What is included and excluded in the market definition?
- How was the forecast built for this premium cabin seat systems category?
Frequently Asked Questions
What is the global market demand for privacy door-equipped premium cabin seat systems in 2026?
In 2026, the global privacy door-equipped premium cabin seat systems market is expected to be worth USD 0.89 billion as airlines upgrade premium cabins.
How big will the privacy door-equipped premium cabin seat systems market be in 2036?
By 2036, the market is expected to be worth USD 2.09 billion as wide-body programs and retrofit cycles add door-equipped suites.
How fast is the privacy door-equipped premium cabin seat systems market expected to grow?
The market is projected to expand at 8.9% CAGR from 2026 to 2036 as premium cabin products shift toward enclosed suites.
Which seat class leads the privacy door-equipped premium cabin seat systems market?
Business suites are projected to lead with 64.0% share in 2026 as airlines can add privacy without removing too many seats.
Which aircraft platform leads the privacy door-equipped premium cabin seat systems market?
Wide-body aircraft are expected to hold 68.0% share in 2026 as long-haul cabins carry larger premium seat counts.
Why is India important for privacy door-equipped premium cabin seat systems demand?
India is projected to record 10.8% CAGR as international fleets expand and carriers add premium cabins on longer routes.
What does this market include?
The market includes certified premium aircraft seat suites with privacy doors and shell structures. Trim and controls are included with cabin integration work.
How was the privacy door-equipped premium cabin seat systems forecast built?
FMI used a hybrid model based on shipsets and suite pricing. Aircraft delivery signals and supplier program evidence checked the forecast.
Why do airlines add doors to business class seats?
Airlines add doors to improve privacy and create a premium product that can support higher fares on long-haul routes.
Are privacy door-equipped aircraft seats used only in first class?
No. Most new demand is in business class as enclosed suites give airlines a premium product across more seats.
What makes privacy door-equipped seats hard to certify?
Doors must clear aisles and latch safely. They must avoid blocking emergency movement. That makes engineering evidence important before airline approval.
Preview the report firsthand - request a free sample
Get SampleGet the brochure for pricing and purchase details.
Get PDFTable of Content
- Executive Summary
- Global Market Outlook
- Demand-side Trends
- Supply-side Trends
- Technology Roadmap Analysis
- Analysis and Recommendations
- Market Overview
- Market Coverage / Taxonomy
- Market Definition / Scope / Limitations
- Research Methodology
- Chapter Orientation
- Analytical Lens and Working Hypotheses
- Market Structure, Signals, and Trend Drivers
- Benchmarking and Cross-market Comparability
- Market Sizing, Forecasting, and Opportunity Mapping
- Research Design and Evidence Framework
- Desk Research Programme (Secondary Evidence)
- Company Annual and Sustainability Reports
- Peer-reviewed Journals and Academic Literature
- Corporate Websites, Product Literature, and Technical Notes
- Earnings Decks and Investor Briefings
- Statutory Filings and Regulatory Disclosures
- Technical White Papers and Standards Notes
- Trade Journals, Industry Magazines, and Analyst Briefs
- Conference Proceedings, Webinars, and Seminar Materials
- Government Statistics Portals and Public Data Releases
- Press Releases and Reputable Media Coverage
- Specialist Newsletters and Curated Briefings
- Sector Databases and Reference Repositories
- FMI Internal Proprietary Databases and Historical Market Datasets
- Subscription Datasets and Paid Sources
- Social Channels, Communities, and Digital Listening Inputs
- Additional Desk Sources
- Expert Input and Fieldwork (Primary Evidence)
- Primary Modes
- Qualitative Interviews and Expert Elicitation
- Quantitative Surveys and Structured Data Capture
- Blended Approach
- Why Primary Evidence is Used
- Field Techniques
- Interviews
- Surveys
- Focus Groups
- Observational and In-context Research
- Social and Community Interactions
- Stakeholder Universe Engaged
- C-suite Leaders
- Board Members
- Presidents and Vice Presidents
- R&D and Innovation Heads
- Technical Specialists
- Domain Subject-matter Experts
- Scientists
- Physicians and Other Healthcare Professionals
- Governance, Ethics, and Data Stewardship
- Research Ethics
- Data Integrity and Handling
- Primary Modes
- Tooling, Models, and Reference Databases
- Desk Research Programme (Secondary Evidence)
- Data Engineering and Model Build
- Data Acquisition and Ingestion
- Cleaning, Normalisation, and Verification
- Synthesis, Triangulation, and Analysis
- Quality Assurance and Audit Trail
- Market Background
- Market Dynamics
- Drivers
- Restraints
- Opportunity
- Trends
- Scenario Forecast
- Demand in Optimistic Scenario
- Demand in Likely Scenario
- Demand in Conservative Scenario
- Opportunity Map Analysis
- Product Life Cycle Analysis
- Supply Chain Analysis
- Investment Feasibility Matrix
- Value Chain Analysis
- PESTLE and Porter’s Analysis
- Regulatory Landscape
- Regional Parent Market Outlook
- Production and Consumption Statistics
- Import and Export Statistics
- Market Dynamics
- Global Market Analysis 2021 to 2025 and Forecast, 2026 to 2036
- Historical Market Size Value (USD Million) Analysis, 2021 to 2025
- Current and Future Market Size Value (USD Million) Projections, 2026 to 2036
- Y-o-Y Growth Trend Analysis
- Absolute $ Opportunity Analysis
- Global Market Pricing Analysis 2021 to 2025 and Forecast 2026 to 2036
- Global Market Analysis 2021 to 2025 and Forecast 2026 to 2036, By Product Type
- Introduction / Key Findings
- Historical Market Size Value (USD Million) Analysis By Product Type , 2021 to 2025
- Current and Future Market Size Value (USD Million) Analysis and Forecast By Product Type , 2026 to 2036
- Bleached glassine
- Unbleached glassine
- Machine glazed glassine
- Bleached glassine
- Y-o-Y Growth Trend Analysis By Product Type , 2021 to 2025
- Absolute $ Opportunity Analysis By Product Type , 2026 to 2036
- Global Market Analysis 2021 to 2025 and Forecast 2026 to 2036, By Application
- Introduction / Key Findings
- Historical Market Size Value (USD Million) Analysis By Application, 2021 to 2025
- Current and Future Market Size Value (USD Million) Analysis and Forecast By Application, 2026 to 2036
- Food packaging
- Pharmaceutical packaging
- Industrial packaging
- Labels and tapes
- Food packaging
- Y-o-Y Growth Trend Analysis By Application, 2021 to 2025
- Absolute $ Opportunity Analysis By Application, 2026 to 2036
- Global Market Analysis 2021 to 2025 and Forecast 2026 to 2036, By Basis Weight
- Introduction / Key Findings
- Historical Market Size Value (USD Million) Analysis By Basis Weight, 2021 to 2025
- Current and Future Market Size Value (USD Million) Analysis and Forecast By Basis Weight, 2026 to 2036
- 40 to 60 gsm
- 61 to 90 gsm
- Above 90 gsm
- Below 40 gsm
- 40 to 60 gsm
- Y-o-Y Growth Trend Analysis By Basis Weight, 2021 to 2025
- Absolute $ Opportunity Analysis By Basis Weight, 2026 to 2036
- Global Market Analysis 2021 to 2025 and Forecast 2026 to 2036, By Finish
- Introduction / Key Findings
- Historical Market Size Value (USD Million) Analysis By Finish, 2021 to 2025
- Current and Future Market Size Value (USD Million) Analysis and Forecast By Finish, 2026 to 2036
- Supercalendered
- Machine glazed
- Coated
- Supercalendered
- Y-o-Y Growth Trend Analysis By Finish, 2021 to 2025
- Absolute $ Opportunity Analysis By Finish, 2026 to 2036
- Global Market Analysis 2021 to 2025 and Forecast 2026 to 2036, By Sales Channel
- Introduction / Key Findings
- Historical Market Size Value (USD Million) Analysis By Sales Channel, 2021 to 2025
- Current and Future Market Size Value (USD Million) Analysis and Forecast By Sales Channel, 2026 to 2036
- Direct mill supply
- Merchants and distributors
- Converters
- Direct mill supply
- Y-o-Y Growth Trend Analysis By Sales Channel, 2021 to 2025
- Absolute $ Opportunity Analysis By Sales Channel, 2026 to 2036
- Global Market Analysis 2021 to 2025 and Forecast 2026 to 2036, By Region
- Introduction
- Historical Market Size Value (USD Million) Analysis By Region, 2021 to 2025
- Current Market Size Value (USD Million) Analysis and Forecast By Region, 2026 to 2036
- North America
- Latin America
- Western Europe
- Eastern Europe
- East Asia
- South Asia and Pacific
- Middle East & Africa
- Market Attractiveness Analysis By Region
- North America Market Analysis 2021 to 2025 and Forecast 2026 to 2036, By Country
- Historical Market Size Value (USD Million) Trend Analysis By Market Taxonomy, 2021 to 2025
- Market Size Value (USD Million) Forecast By Market Taxonomy, 2026 to 2036
- By Country
- USA
- Canada
- Mexico
- By Product Type
- By Application
- By Basis Weight
- By Finish
- By Sales Channel
- By Country
- Market Attractiveness Analysis
- By Country
- By Product Type
- By Application
- By Basis Weight
- By Finish
- By Sales Channel
- Key Takeaways
- Latin America Market Analysis 2021 to 2025 and Forecast 2026 to 2036, By Country
- Historical Market Size Value (USD Million) Trend Analysis By Market Taxonomy, 2021 to 2025
- Market Size Value (USD Million) Forecast By Market Taxonomy, 2026 to 2036
- By Country
- Brazil
- Chile
- Rest of Latin America
- By Product Type
- By Application
- By Basis Weight
- By Finish
- By Sales Channel
- By Country
- Market Attractiveness Analysis
- By Country
- By Product Type
- By Application
- By Basis Weight
- By Finish
- By Sales Channel
- Key Takeaways
- Western Europe Market Analysis 2021 to 2025 and Forecast 2026 to 2036, By Country
- Historical Market Size Value (USD Million) Trend Analysis By Market Taxonomy, 2021 to 2025
- Market Size Value (USD Million) Forecast By Market Taxonomy, 2026 to 2036
- By Country
- Germany
- UK
- Italy
- Spain
- France
- Nordic
- BENELUX
- Rest of Western Europe
- By Product Type
- By Application
- By Basis Weight
- By Finish
- By Sales Channel
- By Country
- Market Attractiveness Analysis
- By Country
- By Product Type
- By Application
- By Basis Weight
- By Finish
- By Sales Channel
- Key Takeaways
- Eastern Europe Market Analysis 2021 to 2025 and Forecast 2026 to 2036, By Country
- Historical Market Size Value (USD Million) Trend Analysis By Market Taxonomy, 2021 to 2025
- Market Size Value (USD Million) Forecast By Market Taxonomy, 2026 to 2036
- By Country
- Russia
- Poland
- Hungary
- Balkan & Baltic
- Rest of Eastern Europe
- By Product Type
- By Application
- By Basis Weight
- By Finish
- By Sales Channel
- By Country
- Market Attractiveness Analysis
- By Country
- By Product Type
- By Application
- By Basis Weight
- By Finish
- By Sales Channel
- Key Takeaways
- East Asia Market Analysis 2021 to 2025 and Forecast 2026 to 2036, By Country
- Historical Market Size Value (USD Million) Trend Analysis By Market Taxonomy, 2021 to 2025
- Market Size Value (USD Million) Forecast By Market Taxonomy, 2026 to 2036
- By Country
- China
- Japan
- South Korea
- By Product Type
- By Application
- By Basis Weight
- By Finish
- By Sales Channel
- By Country
- Market Attractiveness Analysis
- By Country
- By Product Type
- By Application
- By Basis Weight
- By Finish
- By Sales Channel
- Key Takeaways
- South Asia and Pacific Market Analysis 2021 to 2025 and Forecast 2026 to 2036, By Country
- Historical Market Size Value (USD Million) Trend Analysis By Market Taxonomy, 2021 to 2025
- Market Size Value (USD Million) Forecast By Market Taxonomy, 2026 to 2036
- By Country
- India
- ASEAN
- Australia & New Zealand
- Rest of South Asia and Pacific
- By Product Type
- By Application
- By Basis Weight
- By Finish
- By Sales Channel
- By Country
- Market Attractiveness Analysis
- By Country
- By Product Type
- By Application
- By Basis Weight
- By Finish
- By Sales Channel
- Key Takeaways
- Middle East & Africa Market Analysis 2021 to 2025 and Forecast 2026 to 2036, By Country
- Historical Market Size Value (USD Million) Trend Analysis By Market Taxonomy, 2021 to 2025
- Market Size Value (USD Million) Forecast By Market Taxonomy, 2026 to 2036
- By Country
- Kingdom of Saudi Arabia
- Other GCC Countries
- Turkiye
- South Africa
- Other African Union
- Rest of Middle East & Africa
- By Product Type
- By Application
- By Basis Weight
- By Finish
- By Sales Channel
- By Country
- Market Attractiveness Analysis
- By Country
- By Product Type
- By Application
- By Basis Weight
- By Finish
- By Sales Channel
- Key Takeaways
- Key Countries Market Analysis
- USA
- Pricing Analysis
- Market Share Analysis, 2025
- By Product Type
- By Application
- By Basis Weight
- By Finish
- By Sales Channel
- Canada
- Pricing Analysis
- Market Share Analysis, 2025
- By Product Type
- By Application
- By Basis Weight
- By Finish
- By Sales Channel
- Mexico
- Pricing Analysis
- Market Share Analysis, 2025
- By Product Type
- By Application
- By Basis Weight
- By Finish
- By Sales Channel
- Brazil
- Pricing Analysis
- Market Share Analysis, 2025
- By Product Type
- By Application
- By Basis Weight
- By Finish
- By Sales Channel
- Chile
- Pricing Analysis
- Market Share Analysis, 2025
- By Product Type
- By Application
- By Basis Weight
- By Finish
- By Sales Channel
- Germany
- Pricing Analysis
- Market Share Analysis, 2025
- By Product Type
- By Application
- By Basis Weight
- By Finish
- By Sales Channel
- UK
- Pricing Analysis
- Market Share Analysis, 2025
- By Product Type
- By Application
- By Basis Weight
- By Finish
- By Sales Channel
- Italy
- Pricing Analysis
- Market Share Analysis, 2025
- By Product Type
- By Application
- By Basis Weight
- By Finish
- By Sales Channel
- Spain
- Pricing Analysis
- Market Share Analysis, 2025
- By Product Type
- By Application
- By Basis Weight
- By Finish
- By Sales Channel
- France
- Pricing Analysis
- Market Share Analysis, 2025
- By Product Type
- By Application
- By Basis Weight
- By Finish
- By Sales Channel
- India
- Pricing Analysis
- Market Share Analysis, 2025
- By Product Type
- By Application
- By Basis Weight
- By Finish
- By Sales Channel
- ASEAN
- Pricing Analysis
- Market Share Analysis, 2025
- By Product Type
- By Application
- By Basis Weight
- By Finish
- By Sales Channel
- Australia & New Zealand
- Pricing Analysis
- Market Share Analysis, 2025
- By Product Type
- By Application
- By Basis Weight
- By Finish
- By Sales Channel
- China
- Pricing Analysis
- Market Share Analysis, 2025
- By Product Type
- By Application
- By Basis Weight
- By Finish
- By Sales Channel
- Japan
- Pricing Analysis
- Market Share Analysis, 2025
- By Product Type
- By Application
- By Basis Weight
- By Finish
- By Sales Channel
- South Korea
- Pricing Analysis
- Market Share Analysis, 2025
- By Product Type
- By Application
- By Basis Weight
- By Finish
- By Sales Channel
- Russia
- Pricing Analysis
- Market Share Analysis, 2025
- By Product Type
- By Application
- By Basis Weight
- By Finish
- By Sales Channel
- Poland
- Pricing Analysis
- Market Share Analysis, 2025
- By Product Type
- By Application
- By Basis Weight
- By Finish
- By Sales Channel
- Hungary
- Pricing Analysis
- Market Share Analysis, 2025
- By Product Type
- By Application
- By Basis Weight
- By Finish
- By Sales Channel
- Kingdom of Saudi Arabia
- Pricing Analysis
- Market Share Analysis, 2025
- By Product Type
- By Application
- By Basis Weight
- By Finish
- By Sales Channel
- Turkiye
- Pricing Analysis
- Market Share Analysis, 2025
- By Product Type
- By Application
- By Basis Weight
- By Finish
- By Sales Channel
- South Africa
- Pricing Analysis
- Market Share Analysis, 2025
- By Product Type
- By Application
- By Basis Weight
- By Finish
- By Sales Channel
- USA
- Market Structure Analysis
- Competition Dashboard
- Competition Benchmarking
- Market Share Analysis of Top Players
- By Regional
- By Product Type
- By Application
- By Basis Weight
- By Finish
- By Sales Channel
- Competition Analysis
- Competition Deep Dive
- UPM-Kymmene Corporation
- Overview
- Product Portfolio
- Profitability by Market Segments (Product/Age /Sales Channel/Region)
- Sales Footprint
- Strategy Overview
- Marketing Strategy
- Product Strategy
- Channel Strategy
- Sappi Limited
- Mondi Group
- Ahlstrom
- Stora Enso
- Nippon Paper Industries
- Delfortgroup
- UPM-Kymmene Corporation
- Competition Deep Dive
- Assumptions & Acronyms Used


