Quinoa Seed Market Size and Share Forecast Outlook From 2024 to 2034

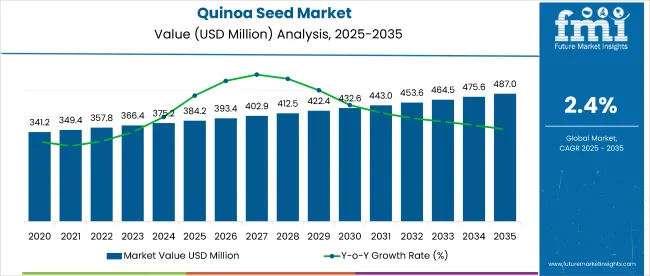
The quinoa seed market is estimated to be valued at USD 375.2 million in 2024. In 2023, the market was valued at USD 366.5 million. The market is expected to progress at a CAGR of 2.4% from 2024 to 2034. By 2034, quinoa seed sales are anticipated to reach a valuation of USD 475.6 million.

Attributes Details
Quinoa Seed Market Value for 2024 USD 375.2 million
Projected Market Value for 2034 USD 475.6 million
Value-based CAGR, 2024 to 2034 2.4%

Top Market Dynamics and Current Growth Trends in the Quinoa Seed Industry

  • As people get more conscious of the effect of food on health, there is a growing clamor for plant-based foods. Quinoa seeds are plant-based, and thus, their demand is growing across the world.
  • The rising awareness about the adverse effects of gluten is projected to stimulate market growth. There has been an increase in the number of people consuming gluten-free food, which is propelling product sales.
  • Quinoa seed cultivation originated in South America, but the market is ever-expanding. The number of countries both cultivating and consuming quinoa seeds is rising, widening the scope of the market.
  • Improvement in farming has helped the cultivation of quinoa seeds. Advancements in farming technology have helped quinoa seed cultivation to be accurate while also promoting the cultivation of the seed in non-traditional areas. Thus, the production of quinoa seeds is on the rise.
  • While the health benefits of quinoa seeds are helping the market expand, there is still a lack of knowledge about the benefits of these seeds in some regions. Apart from areas where quinoa seed is cultivated, market players struggle to expand their customer base, limiting market growth.

Sales Trend Analysis from Historical Performance Compared to 2024 to 2034 Forecast

The quinoa seed industry was valued at USD 337.3 million in 2019. Over the historical period from 2019 to 2023, the market recorded a sluggish CAGR of 2.1%.

Over the historical period, the popularity of quinoa seeds continued to rise. The pandemic highlighted the need to adopt healthy diets. Thus, there was a widescale adoption of healthy food, with quinoa seed recognized as a suitable ingredient. In 2023, the market size reached USD 366.5 million.

Quinoa Seed Market Valuation (2019) USD 337.3 million
Historical CAGR (2019 to 2023) 2.1%
Historical Market Valuation (2023) USD 366.5 million

Long-term Market Outlook and Analysis for Quinoa Seed Products

In 2024, the value of the quinoa seed industry is estimated to be USD 375.2 million. From 2024 to 2034, the market is expected to progress at a CAGR of 2.4%.

As vegan and plant-based trends continue to grow, the demand for quinoa seeds is expected to increase. With more people becoming aware of the product's health benefits, there is an increased adoption of quinoa seeds into diets. The rise in the cultivation and production of seeds is also set to fuel the market over the forecast period. Therefore, the pace of the market’s progress is expected to be higher over the forecast period than during the historical period.

However, there are stumbling blocks in the path of the market. There is still a lack of awareness surrounding the benefits of quinoa seeds. The problem is primarily encountered in regions where quinoa seed is not cultivated. By 2034, the market is projected to reach USD 475.6 million.

Top Industry Trends Shaping the Quinoa Seed Market

  • Quinoa is being adopted as a replacement in many dishes for ingredients like rice and barley. In contrast to other materials, quinoa is considered to be healthier. Thus, the use of quinoa as a healthier alternative is helping the quinoa seed market to grow.
  • Quinoa application is not limited to food making. Quinoa is also finding applications in beers and skincare products. Thus, there are avenues other than food to explore in the market.
  • Traditional alternatives to quinoa, such as rice and cous, continue to be popular. In addition, there are also alternatives to quinoa that are gluten-free, such as chickpeas and cauliflower. The presence of alternatives is constricting the growth of the market.
  • Quinoa seeds are becoming the subject of study in several scientific studies. As scientists discover more benefits of quinoa seeds and quinoa seed cultivation, the positive outlook toward the seed grows.
  • The cultivation of quinoa seeds comes under the purview of sustainable farming practices. As sustainable farming becomes more prominent, the cultivation of quinoa seed is expected to benefit, boosting the market.
  • Governments worldwide are supporting the growth of health-beneficial crops such as quinoa. With an eye on sustainable farming, the governments also look to tackle problems such as obesity among the population.
  • While quinoa seeds are struggling to penetrate non-traditional regions, the import of the seeds is rising. Where cultivation is low or non-existent, awareness is limited but growing, driving the demand for quinoa seeds.
  • Quinoa seeds are still too pricey for certain consumers. The price of the seeds also leads to the product's growth as a niche ingredient. Thus, the cost of quinoa seeds is hampering the market's growth.

Quinoa Seed Industry Analysis by Top Investment Segments

Attributes Details
Top Nature Conventional
Market Share in 2024 86.9%

Conventional Segment Still Reigns in the Quinoa Seed Market

Conventional quinoa seeds continue to dominate the market. In 2024, conventional quinoa seeds are expected to account for a share of 86.9% of the market by nature.

Both conventional and organic quinoa seeds are non-GMO products and offer all the health benefits associated with the seeds. While organic food farming is rising, demand for organic quinoa seeds in the market is rising. Conventional methods for seed production still dominate the market by nature. The quinoa seed cultivation and conventionality still rule the quinoa seed industry.

Attributes Details
Top Form Whole Grain
Market Share in 2024 45.2%

Quinoa Seeds Predominantly Consumed in the Form of Whole Grain

Quinoa seed is widely consumed in the form of whole grain. In 2024, whole grain is estimated to hold a share of 45.2% of the market by form.

Advertising materials for quinoa often portray quinoa as a whole grain. Many consumers are thus conditioned to think of quinoa as a whole grain, even though seeds have been used to make the product. Thus, the familiarity of whole grain products leads to more production and consumption of quinoa seeds in whole grain.

Analysis of Top Countries Cultivating, Exporting, and Consuming Quinoa Seed

While the traditional growing region for quinoa seeds is South America, the plantation of these seeds in other regions is becoming common. The production of quinoa seeds is increasing in North America. The popularity of quinoa seed as a cereal is thus growing in the region.

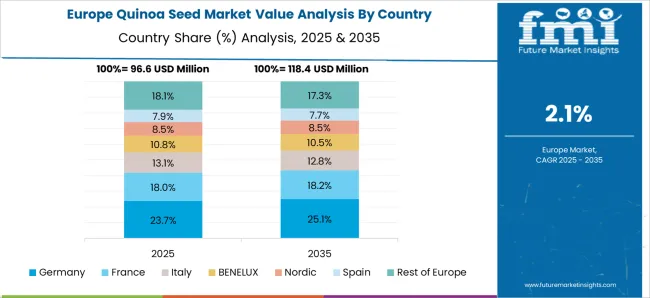
In Europe, quinoa seed plantation is taking place despite the seed being not native to the region. However, Europe mainly relies on quinoa seed imports for consumption.

Countries CAGR (2024 to 2034)
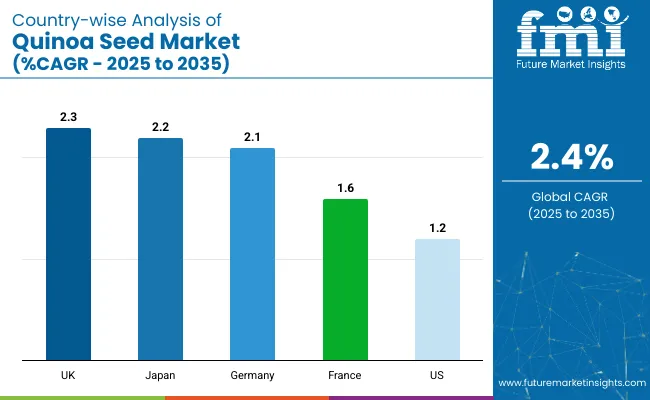
United States 1.2%
Canada 2.4%
Germany 2.1%
France 1.6%
Netherlands 2.1%

Rise in Initiatives to Produce Quinoa Driving Market in Canada

Canada is one of the leading countries in the North America market. Over the forecast period, the CAGR for the market in Canada is anticipated to be 2.4%.

Canadian farmers and industry players focus on locally growing quinoa and quinoa seeds. For example, Canadian brand Quinta Quinoa prides itself on having produced quinoa locally. Thus, Canada offers opportunities for growth in the market.

Quinoa Seeds Linked to Advancements in Farming and Scientific Research in the United States

The United States market is expected to register a sluggish CAGR of 1.2% over the forecast period. However, the country still offers growth prospects for quinoa seeds.

Various studies have been organized around quinoa seeds in the United States, for example, at Washington State University. Market players in the United States are also researching seed cultivation. Thus, the United States is expected to be at the forefront of developments related to quinoa seeds.

Large Amounts of Quinoa Seeds Imported in France

France is one of the leading importers of quinoa seeds around the world. It is also noted to be the leading country in Europe for quinoa seed import. Thus, it is demonstrated that there is a significant demand for quinoa seeds in the country. However, the market is expected to record a CAGR of 1.6% over the forecast period in France.

Rising Health-consciousness and Veganism in Germany Propelling Demand for Quinoa Seeds

In Germany, many people are turning toward veganism. As such, there is a strong demand for plant-based products, benefitting the market for quinoa seeds. Quinoa seeds are coming out of the shell of being a niche product in the country. Over the forecast period, the CAGR for the market in Germany is anticipated to be 2.1%.

Production of Quinoa Seeds in the Netherlands Linked to Suitable Weather Conditions

The market is anticipated to register a CAGR of 2.1% over the forecast period in the Netherlands, identical to Germany. Quinoa seed production in the Netherlands has stepped up, with both organic and conventional varieties produced in the country. The weather in the Netherlands is considered to be one of the foremost factors for the growing production of quinoa seeds in the country. Thus, the market is anticipated to show progress in the country.

Leading Suppliers in the Quinoa Seed Market

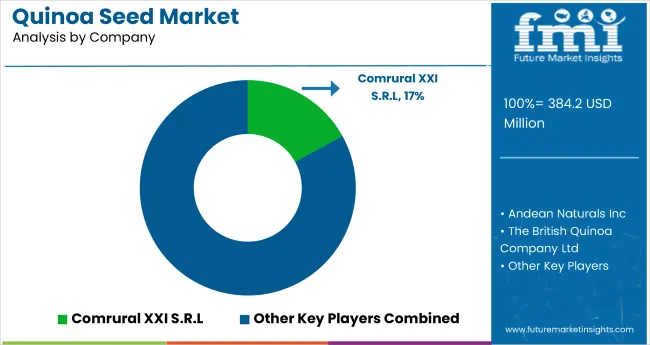
Market players are concentrating on the healthy aspects of quinoa seeds when it comes to marketing the product. Thus, many marketing campaigns focus on the superfood aspect of quinoa and quinoa seeds.

As key players are looking to increase their foothold in the market, acquisitions and mergers are becoming common strategies. Market players are focusing on combining supply chain capabilities in light of the increased import and export of quinoa seeds with advanced farming technologies. They are also focusing on mergers and acquisitions to increase their profits in the market.

Recent Developments in the Quinoa Seed Market

  • In June 2023, a combined effort from two American universities produced a new variety of quinoa plants. The plant was developed by scientists from Brigham Young University and Washington State University and is named the Cougar Quinoa.
  • In May 2022, Bhutan identified quinoa as a priority crop. Though the crop was only introduced in the country in 2015, the recognition by the government is expected to increase production significantly.
  • In January 2021, the Australian Department of Primary Industries and Regional Development (DPIRD) announced the development of a technique to correctly measure the amount of saponin in a quinoa seed. Saponin is considered harmful to the human body in high doses and is thus required to be measured properly.

Key Companies Profiled in the Quinoa Seed Industry

  • Above Food Inc.
  • Alter Eco
  • Irupana Andean Organic Food SA
  • Andean Naturals
  • Industrial and Technological Complex Yanapasiñani SRL
  • Arrowhead Mills Inc.
  • Quinoabol SRL
  • The British Quinoa Company
  • Ancient Harvest
  • Quinoa Foods Company

Top Segments Studied in the Quinoa Seed Market Report

By Nature:

  • Organic
  • Conventional

By Form:

  • Whole Grain
  • Flour
  • Crisps & Flakes

By Region:

  • North America
  • Latin America
  • Europe
  • South Asia
  • East Asia
  • Oceania
  • Middle East and Africa (MEA)

Table of Content

  • 1. Executive Summary
  • 2. Market Overview
  • 3. Market Background
  • 4. Global Market Analysis 2019 to 2023 and Forecast, 2024 to 2034
  • 5. Global Market Analysis 2019 to 2023 and Forecast 2024 to 2034, By Seed Type
    • 5.1. Organic
    • 5.2. Inorganic
  • 6. Global Market Analysis 2019 to 2023 and Forecast 2024 to 2034, By Colour
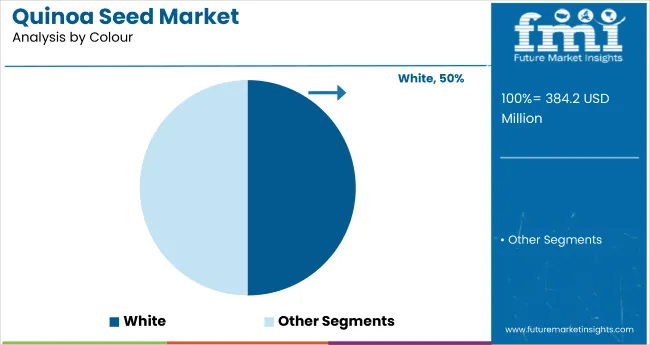
    • 6.1. White
    • 6.2. Red
    • 6.3. Black
    • 6.4. Others
  • 7. Global Market Analysis 2019 to 2023 and Forecast 2024 to 2034, By Application
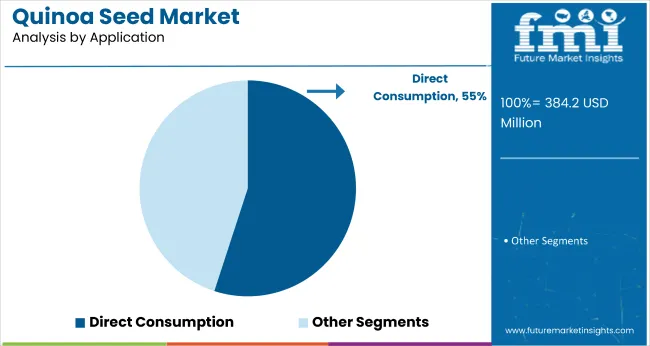
    • 7.1. Direct Consumption
    • 7.2. Processed Products
  • 8. Global Market Analysis 2019 to 2023 and Forecast 2024 to 2034, By Distribution Channel
    • 8.1. Online Stores
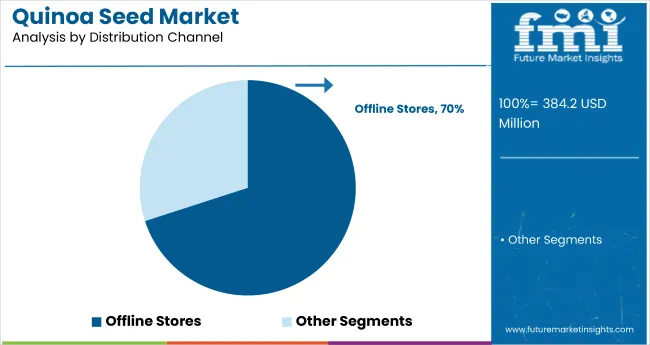
    • 8.2. Offline Stores
  • 9. Global Market Analysis 2019 to 2023 and Forecast 2024 to 2034, By Region
    • 9.1. North America
    • 9.2. Latin America
    • 9.3. Europe
    • 9.4. East Asia
    • 9.5. South Asia
    • 9.6. Oceania
    • 9.7. MEA
  • 10. North America Market Analysis 2019 to 2023 and Forecast 2024 to 2034, By Country
  • 11. Latin America Market Analysis 2019 to 2023 and Forecast 2024 to 2034, By Country
  • 12. Europe Market Analysis 2019 to 2023 and Forecast 2024 to 2034, By Country
  • 13. East Asia Market Analysis 2019 to 2023 and Forecast 2024 to 2034, By Country
  • 14. South Asia Market Analysis 2019 to 2023 and Forecast 2024 to 2034, By Country
  • 15. Oceania Market Analysis 2019 to 2023 and Forecast 2024 to 2034, By Country
  • 16. MEA Market Analysis 2019 to 2023 and Forecast 2024 to 2034, By Country
  • 17. Key Countries Market Analysis
  • 18. Market Structure Analysis
  • 19. Competition Analysis
    • 19.1. Comrural XXI S.R.L
    • 19.2. Andean Naturals Inc
    • 19.3. The British Quinoa Company Ltd
    • 19.4. Quinoa Foods
    • 19.5. Irupana Andean Organic Food S.A
    • 19.6. Highland Farm
    • 19.7. Quinoa Corporation
    • 19.8. Arrowhead Mills Inc
    • 19.9. Alter Eco
    • 19.10. Quinoabol SRL
  • 20. Assumptions & Acronyms Used
  • 21. Research Methodology

List of Tables

Table 1: Global Market Value (US$ Million) Forecast by Region, 2019 to 2034

Table 2: Global Market Volume (Tons) Forecast by Region, 2019 to 2034

Table 3: Global Market Value (US$ Million) Forecast by Seed Type, 2019 to 2034

Table 4: Global Market Volume (Tons) Forecast by Seed Type, 2019 to 2034

Table 5: Global Market Value (US$ Million) Forecast by Colour, 2019 to 2034

Table 6: Global Market Volume (Tons) Forecast by Colour, 2019 to 2034

Table 7: Global Market Value (US$ Million) Forecast by Application, 2019 to 2034

Table 8: Global Market Volume (Tons) Forecast by Application, 2019 to 2034

Table 9: Global Market Value (US$ Million) Forecast by Distribution Channel, 2019 to 2034

Table 10: Global Market Volume (Tons) Forecast by Distribution Channel, 2019 to 2034

Table 11: North America Market Value (US$ Million) Forecast by Country, 2019 to 2034

Table 12: North America Market Volume (Tons) Forecast by Country, 2019 to 2034

Table 13: North America Market Value (US$ Million) Forecast by Seed Type, 2019 to 2034

Table 14: North America Market Volume (Tons) Forecast by Seed Type, 2019 to 2034

Table 15: North America Market Value (US$ Million) Forecast by Colour, 2019 to 2034

Table 16: North America Market Volume (Tons) Forecast by Colour, 2019 to 2034

Table 17: North America Market Value (US$ Million) Forecast by Application, 2019 to 2034

Table 18: North America Market Volume (Tons) Forecast by Application, 2019 to 2034

Table 19: North America Market Value (US$ Million) Forecast by Distribution Channel, 2019 to 2034

Table 20: North America Market Volume (Tons) Forecast by Distribution Channel, 2019 to 2034

Table 21: Latin America Market Value (US$ Million) Forecast by Country, 2019 to 2034

Table 22: Latin America Market Volume (Tons) Forecast by Country, 2019 to 2034

Table 23: Latin America Market Value (US$ Million) Forecast by Seed Type, 2019 to 2034

Table 24: Latin America Market Volume (Tons) Forecast by Seed Type, 2019 to 2034

Table 25: Latin America Market Value (US$ Million) Forecast by Colour, 2019 to 2034

Table 26: Latin America Market Volume (Tons) Forecast by Colour, 2019 to 2034

Table 27: Latin America Market Value (US$ Million) Forecast by Application, 2019 to 2034

Table 28: Latin America Market Volume (Tons) Forecast by Application, 2019 to 2034

Table 29: Latin America Market Value (US$ Million) Forecast by Distribution Channel, 2019 to 2034

Table 30: Latin America Market Volume (Tons) Forecast by Distribution Channel, 2019 to 2034

Table 31: Europe Market Value (US$ Million) Forecast by Country, 2019 to 2034

Table 32: Europe Market Volume (Tons) Forecast by Country, 2019 to 2034

Table 33: Europe Market Value (US$ Million) Forecast by Seed Type, 2019 to 2034

Table 34: Europe Market Volume (Tons) Forecast by Seed Type, 2019 to 2034

Table 35: Europe Market Value (US$ Million) Forecast by Colour, 2019 to 2034

Table 36: Europe Market Volume (Tons) Forecast by Colour, 2019 to 2034

Table 37: Europe Market Value (US$ Million) Forecast by Application, 2019 to 2034

Table 38: Europe Market Volume (Tons) Forecast by Application, 2019 to 2034

Table 39: Europe Market Value (US$ Million) Forecast by Distribution Channel, 2019 to 2034

Table 40: Europe Market Volume (Tons) Forecast by Distribution Channel, 2019 to 2034

Table 41: East Asia Market Value (US$ Million) Forecast by Country, 2019 to 2034

Table 42: East Asia Market Volume (Tons) Forecast by Country, 2019 to 2034

Table 43: East Asia Market Value (US$ Million) Forecast by Seed Type, 2019 to 2034

Table 44: East Asia Market Volume (Tons) Forecast by Seed Type, 2019 to 2034

Table 45: East Asia Market Value (US$ Million) Forecast by Colour, 2019 to 2034

Table 46: East Asia Market Volume (Tons) Forecast by Colour, 2019 to 2034

Table 47: East Asia Market Value (US$ Million) Forecast by Application, 2019 to 2034

Table 48: East Asia Market Volume (Tons) Forecast by Application, 2019 to 2034

Table 49: East Asia Market Value (US$ Million) Forecast by Distribution Channel, 2019 to 2034

Table 50: East Asia Market Volume (Tons) Forecast by Distribution Channel, 2019 to 2034

Table 51: South Asia Market Value (US$ Million) Forecast by Country, 2019 to 2034

Table 52: South Asia Market Volume (Tons) Forecast by Country, 2019 to 2034

Table 53: South Asia Market Value (US$ Million) Forecast by Seed Type, 2019 to 2034

Table 54: South Asia Market Volume (Tons) Forecast by Seed Type, 2019 to 2034

Table 55: South Asia Market Value (US$ Million) Forecast by Colour, 2019 to 2034

Table 56: South Asia Market Volume (Tons) Forecast by Colour, 2019 to 2034

Table 57: South Asia Market Value (US$ Million) Forecast by Application, 2019 to 2034

Table 58: South Asia Market Volume (Tons) Forecast by Application, 2019 to 2034

Table 59: South Asia Market Value (US$ Million) Forecast by Distribution Channel, 2019 to 2034

Table 60: South Asia Market Volume (Tons) Forecast by Distribution Channel, 2019 to 2034

Table 61: Oceania Market Value (US$ Million) Forecast by Country, 2019 to 2034

Table 62: Oceania Market Volume (Tons) Forecast by Country, 2019 to 2034

Table 63: Oceania Market Value (US$ Million) Forecast by Seed Type, 2019 to 2034

Table 64: Oceania Market Volume (Tons) Forecast by Seed Type, 2019 to 2034

Table 65: Oceania Market Value (US$ Million) Forecast by Colour, 2019 to 2034

Table 66: Oceania Market Volume (Tons) Forecast by Colour, 2019 to 2034

Table 67: Oceania Market Value (US$ Million) Forecast by Application, 2019 to 2034

Table 68: Oceania Market Volume (Tons) Forecast by Application, 2019 to 2034

Table 69: Oceania Market Value (US$ Million) Forecast by Distribution Channel, 2019 to 2034

Table 70: Oceania Market Volume (Tons) Forecast by Distribution Channel, 2019 to 2034

Table 71: MEA Market Value (US$ Million) Forecast by Country, 2019 to 2034

Table 72: MEA Market Volume (Tons) Forecast by Country, 2019 to 2034

Table 73: MEA Market Value (US$ Million) Forecast by Seed Type, 2019 to 2034

Table 74: MEA Market Volume (Tons) Forecast by Seed Type, 2019 to 2034

Table 75: MEA Market Value (US$ Million) Forecast by Colour, 2019 to 2034

Table 76: MEA Market Volume (Tons) Forecast by Colour, 2019 to 2034

Table 77: MEA Market Value (US$ Million) Forecast by Application, 2019 to 2034

Table 78: MEA Market Volume (Tons) Forecast by Application, 2019 to 2034

Table 79: MEA Market Value (US$ Million) Forecast by Distribution Channel, 2019 to 2034

Table 80: MEA Market Volume (Tons) Forecast by Distribution Channel, 2019 to 2034

List of Figures

Figure 1: Global Market Value (US$ Million) by Seed Type, 2024 to 2034

Figure 2: Global Market Value (US$ Million) by Colour, 2024 to 2034

Figure 3: Global Market Value (US$ Million) by Application, 2024 to 2034

Figure 4: Global Market Value (US$ Million) by Distribution Channel, 2024 to 2034

Figure 5: Global Market Value (US$ Million) by Region, 2024 to 2034

Figure 6: Global Market Value (US$ Million) Analysis by Region, 2019 to 2034

Figure 7: Global Market Volume (Tons) Analysis by Region, 2019 to 2034

Figure 8: Global Market Value Share (%) and BPS Analysis by Region, 2024 to 2034

Figure 9: Global Market Y-o-Y Growth (%) Projections by Region, 2024 to 2034

Figure 10: Global Market Value (US$ Million) Analysis by Seed Type, 2019 to 2034

Figure 11: Global Market Volume (Tons) Analysis by Seed Type, 2019 to 2034

Figure 12: Global Market Value Share (%) and BPS Analysis by Seed Type, 2024 to 2034

Figure 13: Global Market Y-o-Y Growth (%) Projections by Seed Type, 2024 to 2034

Figure 14: Global Market Value (US$ Million) Analysis by Colour, 2019 to 2034

Figure 15: Global Market Volume (Tons) Analysis by Colour, 2019 to 2034

Figure 16: Global Market Value Share (%) and BPS Analysis by Colour, 2024 to 2034

Figure 17: Global Market Y-o-Y Growth (%) Projections by Colour, 2024 to 2034

Figure 18: Global Market Value (US$ Million) Analysis by Application, 2019 to 2034

Figure 19: Global Market Volume (Tons) Analysis by Application, 2019 to 2034

Figure 20: Global Market Value Share (%) and BPS Analysis by Application, 2024 to 2034

Figure 21: Global Market Y-o-Y Growth (%) Projections by Application, 2024 to 2034

Figure 22: Global Market Value (US$ Million) Analysis by Distribution Channel, 2019 to 2034

Figure 23: Global Market Volume (Tons) Analysis by Distribution Channel, 2019 to 2034

Figure 24: Global Market Value Share (%) and BPS Analysis by Distribution Channel, 2024 to 2034

Figure 25: Global Market Y-o-Y Growth (%) Projections by Distribution Channel, 2024 to 2034

Figure 26: Global Market Attractiveness by Seed Type, 2024 to 2034

Figure 27: Global Market Attractiveness by Colour, 2024 to 2034

Figure 28: Global Market Attractiveness by Application, 2024 to 2034

Figure 29: Global Market Attractiveness by Distribution Channel, 2024 to 2034

Figure 30: Global Market Attractiveness by Region, 2024 to 2034

Figure 31: North America Market Value (US$ Million) by Seed Type, 2024 to 2034

Figure 32: North America Market Value (US$ Million) by Colour, 2024 to 2034

Figure 33: North America Market Value (US$ Million) by Application, 2024 to 2034

Figure 34: North America Market Value (US$ Million) by Distribution Channel, 2024 to 2034

Figure 35: North America Market Value (US$ Million) by Country, 2024 to 2034

Figure 36: North America Market Value (US$ Million) Analysis by Country, 2019 to 2034

Figure 37: North America Market Volume (Tons) Analysis by Country, 2019 to 2034

Figure 38: North America Market Value Share (%) and BPS Analysis by Country, 2024 to 2034

Figure 39: North America Market Y-o-Y Growth (%) Projections by Country, 2024 to 2034

Figure 40: North America Market Value (US$ Million) Analysis by Seed Type, 2019 to 2034

Figure 41: North America Market Volume (Tons) Analysis by Seed Type, 2019 to 2034

Figure 42: North America Market Value Share (%) and BPS Analysis by Seed Type, 2024 to 2034

Figure 43: North America Market Y-o-Y Growth (%) Projections by Seed Type, 2024 to 2034

Figure 44: North America Market Value (US$ Million) Analysis by Colour, 2019 to 2034

Figure 45: North America Market Volume (Tons) Analysis by Colour, 2019 to 2034

Figure 46: North America Market Value Share (%) and BPS Analysis by Colour, 2024 to 2034

Figure 47: North America Market Y-o-Y Growth (%) Projections by Colour, 2024 to 2034

Figure 48: North America Market Value (US$ Million) Analysis by Application, 2019 to 2034

Figure 49: North America Market Volume (Tons) Analysis by Application, 2019 to 2034

Figure 50: North America Market Value Share (%) and BPS Analysis by Application, 2024 to 2034

Figure 51: North America Market Y-o-Y Growth (%) Projections by Application, 2024 to 2034

Figure 52: North America Market Value (US$ Million) Analysis by Distribution Channel, 2019 to 2034

Figure 53: North America Market Volume (Tons) Analysis by Distribution Channel, 2019 to 2034

Figure 54: North America Market Value Share (%) and BPS Analysis by Distribution Channel, 2024 to 2034

Figure 55: North America Market Y-o-Y Growth (%) Projections by Distribution Channel, 2024 to 2034

Figure 56: North America Market Attractiveness by Seed Type, 2024 to 2034

Figure 57: North America Market Attractiveness by Colour, 2024 to 2034

Figure 58: North America Market Attractiveness by Application, 2024 to 2034

Figure 59: North America Market Attractiveness by Distribution Channel, 2024 to 2034

Figure 60: North America Market Attractiveness by Country, 2024 to 2034

Figure 61: Latin America Market Value (US$ Million) by Seed Type, 2024 to 2034

Figure 62: Latin America Market Value (US$ Million) by Colour, 2024 to 2034

Figure 63: Latin America Market Value (US$ Million) by Application, 2024 to 2034

Figure 64: Latin America Market Value (US$ Million) by Distribution Channel, 2024 to 2034

Figure 65: Latin America Market Value (US$ Million) by Country, 2024 to 2034

Figure 66: Latin America Market Value (US$ Million) Analysis by Country, 2019 to 2034

Figure 67: Latin America Market Volume (Tons) Analysis by Country, 2019 to 2034

Figure 68: Latin America Market Value Share (%) and BPS Analysis by Country, 2024 to 2034

Figure 69: Latin America Market Y-o-Y Growth (%) Projections by Country, 2024 to 2034

Figure 70: Latin America Market Value (US$ Million) Analysis by Seed Type, 2019 to 2034

Figure 71: Latin America Market Volume (Tons) Analysis by Seed Type, 2019 to 2034

Figure 72: Latin America Market Value Share (%) and BPS Analysis by Seed Type, 2024 to 2034

Figure 73: Latin America Market Y-o-Y Growth (%) Projections by Seed Type, 2024 to 2034

Figure 74: Latin America Market Value (US$ Million) Analysis by Colour, 2019 to 2034

Figure 75: Latin America Market Volume (Tons) Analysis by Colour, 2019 to 2034

Figure 76: Latin America Market Value Share (%) and BPS Analysis by Colour, 2024 to 2034

Figure 77: Latin America Market Y-o-Y Growth (%) Projections by Colour, 2024 to 2034

Figure 78: Latin America Market Value (US$ Million) Analysis by Application, 2019 to 2034

Figure 79: Latin America Market Volume (Tons) Analysis by Application, 2019 to 2034

Figure 80: Latin America Market Value Share (%) and BPS Analysis by Application, 2024 to 2034

Figure 81: Latin America Market Y-o-Y Growth (%) Projections by Application, 2024 to 2034

Figure 82: Latin America Market Value (US$ Million) Analysis by Distribution Channel, 2019 to 2034

Figure 83: Latin America Market Volume (Tons) Analysis by Distribution Channel, 2019 to 2034

Figure 84: Latin America Market Value Share (%) and BPS Analysis by Distribution Channel, 2024 to 2034

Figure 85: Latin America Market Y-o-Y Growth (%) Projections by Distribution Channel, 2024 to 2034

Figure 86: Latin America Market Attractiveness by Seed Type, 2024 to 2034

Figure 87: Latin America Market Attractiveness by Colour, 2024 to 2034

Figure 88: Latin America Market Attractiveness by Application, 2024 to 2034

Figure 89: Latin America Market Attractiveness by Distribution Channel, 2024 to 2034

Figure 90: Latin America Market Attractiveness by Country, 2024 to 2034

Figure 91: Europe Market Value (US$ Million) by Seed Type, 2024 to 2034

Figure 92: Europe Market Value (US$ Million) by Colour, 2024 to 2034

Figure 93: Europe Market Value (US$ Million) by Application, 2024 to 2034

Figure 94: Europe Market Value (US$ Million) by Distribution Channel, 2024 to 2034

Figure 95: Europe Market Value (US$ Million) by Country, 2024 to 2034

Figure 96: Europe Market Value (US$ Million) Analysis by Country, 2019 to 2034

Figure 97: Europe Market Volume (Tons) Analysis by Country, 2019 to 2034

Figure 98: Europe Market Value Share (%) and BPS Analysis by Country, 2024 to 2034

Figure 99: Europe Market Y-o-Y Growth (%) Projections by Country, 2024 to 2034

Figure 100: Europe Market Value (US$ Million) Analysis by Seed Type, 2019 to 2034

Figure 101: Europe Market Volume (Tons) Analysis by Seed Type, 2019 to 2034

Figure 102: Europe Market Value Share (%) and BPS Analysis by Seed Type, 2024 to 2034

Figure 103: Europe Market Y-o-Y Growth (%) Projections by Seed Type, 2024 to 2034

Figure 104: Europe Market Value (US$ Million) Analysis by Colour, 2019 to 2034

Figure 105: Europe Market Volume (Tons) Analysis by Colour, 2019 to 2034

Figure 106: Europe Market Value Share (%) and BPS Analysis by Colour, 2024 to 2034

Figure 107: Europe Market Y-o-Y Growth (%) Projections by Colour, 2024 to 2034

Figure 108: Europe Market Value (US$ Million) Analysis by Application, 2019 to 2034

Figure 109: Europe Market Volume (Tons) Analysis by Application, 2019 to 2034

Figure 110: Europe Market Value Share (%) and BPS Analysis by Application, 2024 to 2034

Figure 111: Europe Market Y-o-Y Growth (%) Projections by Application, 2024 to 2034

Figure 112: Europe Market Value (US$ Million) Analysis by Distribution Channel, 2019 to 2034

Figure 113: Europe Market Volume (Tons) Analysis by Distribution Channel, 2019 to 2034

Figure 114: Europe Market Value Share (%) and BPS Analysis by Distribution Channel, 2024 to 2034

Figure 115: Europe Market Y-o-Y Growth (%) Projections by Distribution Channel, 2024 to 2034

Figure 116: Europe Market Attractiveness by Seed Type, 2024 to 2034

Figure 117: Europe Market Attractiveness by Colour, 2024 to 2034

Figure 118: Europe Market Attractiveness by Application, 2024 to 2034

Figure 119: Europe Market Attractiveness by Distribution Channel, 2024 to 2034

Figure 120: Europe Market Attractiveness by Country, 2024 to 2034

Figure 121: East Asia Market Value (US$ Million) by Seed Type, 2024 to 2034

Figure 122: East Asia Market Value (US$ Million) by Colour, 2024 to 2034

Figure 123: East Asia Market Value (US$ Million) by Application, 2024 to 2034

Figure 124: East Asia Market Value (US$ Million) by Distribution Channel, 2024 to 2034

Figure 125: East Asia Market Value (US$ Million) by Country, 2024 to 2034

Figure 126: East Asia Market Value (US$ Million) Analysis by Country, 2019 to 2034

Figure 127: East Asia Market Volume (Tons) Analysis by Country, 2019 to 2034

Figure 128: East Asia Market Value Share (%) and BPS Analysis by Country, 2024 to 2034

Figure 129: East Asia Market Y-o-Y Growth (%) Projections by Country, 2024 to 2034

Figure 130: East Asia Market Value (US$ Million) Analysis by Seed Type, 2019 to 2034

Figure 131: East Asia Market Volume (Tons) Analysis by Seed Type, 2019 to 2034

Figure 132: East Asia Market Value Share (%) and BPS Analysis by Seed Type, 2024 to 2034

Figure 133: East Asia Market Y-o-Y Growth (%) Projections by Seed Type, 2024 to 2034

Figure 134: East Asia Market Value (US$ Million) Analysis by Colour, 2019 to 2034

Figure 135: East Asia Market Volume (Tons) Analysis by Colour, 2019 to 2034

Figure 136: East Asia Market Value Share (%) and BPS Analysis by Colour, 2024 to 2034

Figure 137: East Asia Market Y-o-Y Growth (%) Projections by Colour, 2024 to 2034

Figure 138: East Asia Market Value (US$ Million) Analysis by Application, 2019 to 2034

Figure 139: East Asia Market Volume (Tons) Analysis by Application, 2019 to 2034

Figure 140: East Asia Market Value Share (%) and BPS Analysis by Application, 2024 to 2034

Figure 141: East Asia Market Y-o-Y Growth (%) Projections by Application, 2024 to 2034

Figure 142: East Asia Market Value (US$ Million) Analysis by Distribution Channel, 2019 to 2034

Figure 143: East Asia Market Volume (Tons) Analysis by Distribution Channel, 2019 to 2034

Figure 144: East Asia Market Value Share (%) and BPS Analysis by Distribution Channel, 2024 to 2034

Figure 145: East Asia Market Y-o-Y Growth (%) Projections by Distribution Channel, 2024 to 2034

Figure 146: East Asia Market Attractiveness by Seed Type, 2024 to 2034

Figure 147: East Asia Market Attractiveness by Colour, 2024 to 2034

Figure 148: East Asia Market Attractiveness by Application, 2024 to 2034

Figure 149: East Asia Market Attractiveness by Distribution Channel, 2024 to 2034

Figure 150: East Asia Market Attractiveness by Country, 2024 to 2034

Figure 151: South Asia Market Value (US$ Million) by Seed Type, 2024 to 2034

Figure 152: South Asia Market Value (US$ Million) by Colour, 2024 to 2034

Figure 153: South Asia Market Value (US$ Million) by Application, 2024 to 2034

Figure 154: South Asia Market Value (US$ Million) by Distribution Channel, 2024 to 2034

Figure 155: South Asia Market Value (US$ Million) by Country, 2024 to 2034

Figure 156: South Asia Market Value (US$ Million) Analysis by Country, 2019 to 2034

Figure 157: South Asia Market Volume (Tons) Analysis by Country, 2019 to 2034

Figure 158: South Asia Market Value Share (%) and BPS Analysis by Country, 2024 to 2034

Figure 159: South Asia Market Y-o-Y Growth (%) Projections by Country, 2024 to 2034

Figure 160: South Asia Market Value (US$ Million) Analysis by Seed Type, 2019 to 2034

Figure 161: South Asia Market Volume (Tons) Analysis by Seed Type, 2019 to 2034

Figure 162: South Asia Market Value Share (%) and BPS Analysis by Seed Type, 2024 to 2034

Figure 163: South Asia Market Y-o-Y Growth (%) Projections by Seed Type, 2024 to 2034

Figure 164: South Asia Market Value (US$ Million) Analysis by Colour, 2019 to 2034

Figure 165: South Asia Market Volume (Tons) Analysis by Colour, 2019 to 2034

Figure 166: South Asia Market Value Share (%) and BPS Analysis by Colour, 2024 to 2034

Figure 167: South Asia Market Y-o-Y Growth (%) Projections by Colour, 2024 to 2034

Figure 168: South Asia Market Value (US$ Million) Analysis by Application, 2019 to 2034

Figure 169: South Asia Market Volume (Tons) Analysis by Application, 2019 to 2034

Figure 170: South Asia Market Value Share (%) and BPS Analysis by Application, 2024 to 2034

Figure 171: South Asia Market Y-o-Y Growth (%) Projections by Application, 2024 to 2034

Figure 172: South Asia Market Value (US$ Million) Analysis by Distribution Channel, 2019 to 2034

Figure 173: South Asia Market Volume (Tons) Analysis by Distribution Channel, 2019 to 2034

Figure 174: South Asia Market Value Share (%) and BPS Analysis by Distribution Channel, 2024 to 2034

Figure 175: South Asia Market Y-o-Y Growth (%) Projections by Distribution Channel, 2024 to 2034

Figure 176: South Asia Market Attractiveness by Seed Type, 2024 to 2034

Figure 177: South Asia Market Attractiveness by Colour, 2024 to 2034

Figure 178: South Asia Market Attractiveness by Application, 2024 to 2034

Figure 179: South Asia Market Attractiveness by Distribution Channel, 2024 to 2034

Figure 180: South Asia Market Attractiveness by Country, 2024 to 2034

Figure 181: Oceania Market Value (US$ Million) by Seed Type, 2024 to 2034

Figure 182: Oceania Market Value (US$ Million) by Colour, 2024 to 2034

Figure 183: Oceania Market Value (US$ Million) by Application, 2024 to 2034

Figure 184: Oceania Market Value (US$ Million) by Distribution Channel, 2024 to 2034

Figure 185: Oceania Market Value (US$ Million) by Country, 2024 to 2034

Figure 186: Oceania Market Value (US$ Million) Analysis by Country, 2019 to 2034

Figure 187: Oceania Market Volume (Tons) Analysis by Country, 2019 to 2034

Figure 188: Oceania Market Value Share (%) and BPS Analysis by Country, 2024 to 2034

Figure 189: Oceania Market Y-o-Y Growth (%) Projections by Country, 2024 to 2034

Figure 190: Oceania Market Value (US$ Million) Analysis by Seed Type, 2019 to 2034

Figure 191: Oceania Market Volume (Tons) Analysis by Seed Type, 2019 to 2034

Figure 192: Oceania Market Value Share (%) and BPS Analysis by Seed Type, 2024 to 2034

Figure 193: Oceania Market Y-o-Y Growth (%) Projections by Seed Type, 2024 to 2034

Figure 194: Oceania Market Value (US$ Million) Analysis by Colour, 2019 to 2034

Figure 195: Oceania Market Volume (Tons) Analysis by Colour, 2019 to 2034

Figure 196: Oceania Market Value Share (%) and BPS Analysis by Colour, 2024 to 2034

Figure 197: Oceania Market Y-o-Y Growth (%) Projections by Colour, 2024 to 2034

Figure 198: Oceania Market Value (US$ Million) Analysis by Application, 2019 to 2034

Figure 199: Oceania Market Volume (Tons) Analysis by Application, 2019 to 2034

Figure 200: Oceania Market Value Share (%) and BPS Analysis by Application, 2024 to 2034

Figure 201: Oceania Market Y-o-Y Growth (%) Projections by Application, 2024 to 2034

Figure 202: Oceania Market Value (US$ Million) Analysis by Distribution Channel, 2019 to 2034

Figure 203: Oceania Market Volume (Tons) Analysis by Distribution Channel, 2019 to 2034

Figure 204: Oceania Market Value Share (%) and BPS Analysis by Distribution Channel, 2024 to 2034

Figure 205: Oceania Market Y-o-Y Growth (%) Projections by Distribution Channel, 2024 to 2034

Figure 206: Oceania Market Attractiveness by Seed Type, 2024 to 2034

Figure 207: Oceania Market Attractiveness by Colour, 2024 to 2034

Figure 208: Oceania Market Attractiveness by Application, 2024 to 2034

Figure 209: Oceania Market Attractiveness by Distribution Channel, 2024 to 2034

Figure 210: Oceania Market Attractiveness by Country, 2024 to 2034

Figure 211: MEA Market Value (US$ Million) by Seed Type, 2024 to 2034

Figure 212: MEA Market Value (US$ Million) by Colour, 2024 to 2034

Figure 213: MEA Market Value (US$ Million) by Application, 2024 to 2034

Figure 214: MEA Market Value (US$ Million) by Distribution Channel, 2024 to 2034

Figure 215: MEA Market Value (US$ Million) by Country, 2024 to 2034

Figure 216: MEA Market Value (US$ Million) Analysis by Country, 2019 to 2034

Figure 217: MEA Market Volume (Tons) Analysis by Country, 2019 to 2034

Figure 218: MEA Market Value Share (%) and BPS Analysis by Country, 2024 to 2034

Figure 219: MEA Market Y-o-Y Growth (%) Projections by Country, 2024 to 2034

Figure 220: MEA Market Value (US$ Million) Analysis by Seed Type, 2019 to 2034

Figure 221: MEA Market Volume (Tons) Analysis by Seed Type, 2019 to 2034

Figure 222: MEA Market Value Share (%) and BPS Analysis by Seed Type, 2024 to 2034

Figure 223: MEA Market Y-o-Y Growth (%) Projections by Seed Type, 2024 to 2034

Figure 224: MEA Market Value (US$ Million) Analysis by Colour, 2019 to 2034

Figure 225: MEA Market Volume (Tons) Analysis by Colour, 2019 to 2034

Figure 226: MEA Market Value Share (%) and BPS Analysis by Colour, 2024 to 2034

Figure 227: MEA Market Y-o-Y Growth (%) Projections by Colour, 2024 to 2034

Figure 228: MEA Market Value (US$ Million) Analysis by Application, 2019 to 2034

Figure 229: MEA Market Volume (Tons) Analysis by Application, 2019 to 2034

Figure 230: MEA Market Value Share (%) and BPS Analysis by Application, 2024 to 2034

Figure 231: MEA Market Y-o-Y Growth (%) Projections by Application, 2024 to 2034

Figure 232: MEA Market Value (US$ Million) Analysis by Distribution Channel, 2019 to 2034

Figure 233: MEA Market Volume (Tons) Analysis by Distribution Channel, 2019 to 2034

Figure 234: MEA Market Value Share (%) and BPS Analysis by Distribution Channel, 2024 to 2034

Figure 235: MEA Market Y-o-Y Growth (%) Projections by Distribution Channel, 2024 to 2034

Figure 236: MEA Market Attractiveness by Seed Type, 2024 to 2034

Figure 237: MEA Market Attractiveness by Colour, 2024 to 2034

Figure 238: MEA Market Attractiveness by Application, 2024 to 2034

Figure 239: MEA Market Attractiveness by Distribution Channel, 2024 to 2034

Figure 240: MEA Market Attractiveness by Country, 2024 to 2034

Frequently Asked Questions

How Big is the Quinoa Seed Market?

The size of the quinoa seed market is estimated to be valued at USD 375.2 million in 2024.

Which Form of Quinoa Seed is Widely Available in the Market?

Quinoa seeds are commonly consumed as whole grain, accounting for a market share of 45.2% in 2024.

Who are the Prominent Players in the Quinoa Seed Market?

Above Food Inc., Alter Eco, Irupana Andean Organic Food SA, and Andean Naturals are some of the prominent companies in the quinoa seed market.

What will be the Size of the Quinoa Seed Market by 2034?

The quinoa seed market size is predicted to be USD 475.6 million by 2034.

How will the Quinoa Seed Market Progress in the United States?

The United States quinoa seed market is predicted to progress at a CAGR of 1.2% from 2024 to 2034.

Explore Similar Insights

Future Market Insights

Quinoa Seed Market