

- Market Size (2026)
- USD 980.6 million
- Forecast (2036)
- USD 1911 million
- CAGR (2026 to 2036)
- 6.9%
How big is the Race Timing Chips Market in 2026?
USD 980.6 million in 2026 and USD 1,911 million by 2036 at a 6.9% CAGR.
Sales of race timing chips are estimated to rise at 6.9% CAGR through 2036. Valuation is projected to increase from USD 980.6 million in 2026 to USD 1,911 million by 2036. Mass road events need automated identity capture because wave starts make manual finish order insufficient for elapsed times. Running USA reported in February 2025 that finishers among major USA races grew 15% during the second half of 2024. Higher field density is expected to increase requirements for dependable bib encoding and verified split-point reads during crowded events.
China and India are projected to place more weight on local timer support because event expansion extends beyond established metropolitan races. The United States and Western Europe are expected to emphasize software interoperability and correction controls across recurring race calendars. Timing teams evaluate read density and backup paths before choosing reusable active chips or disposable passive tags. RunSignup reported in February 2026 that its RaceDay CheckIn app processed more than 7.3 million participant check-ins during 2025. That operating scale is expected to make data synchronization a procurement issue alongside tag accuracy and field read reliability. Integration with the event management software market is expected to influence supplier selection where registration and scoring share participant records.
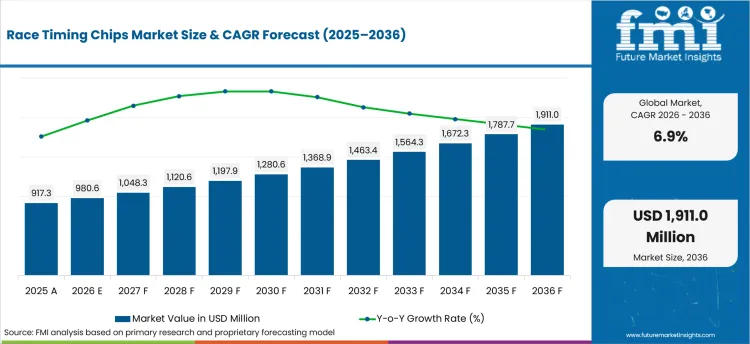
| Metric | Value |
|---|---|
| 2025 Market Size | USD 917.3 million |
| 2026 Market Size | USD 980.6 million |
| 2036 Market Size | USD 1,911 million |
| Forecast CAGR (2026-2036) | 6.9% |
| Leading Chip Type | Passive RFID Chips |
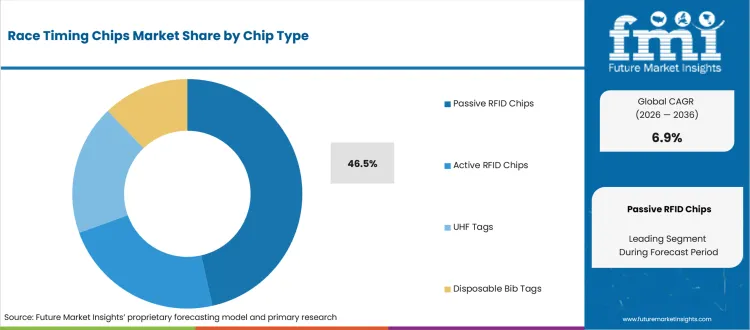
| Passive RFID Chips Share (2026) | 46.5% |
| Leading Event Type | Road Running |
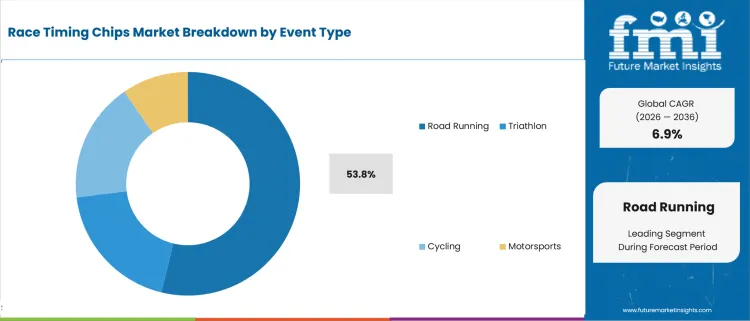
| Road Running Share (2026) | 53.8% |
| Leading Component | Timing Chips or Tags |
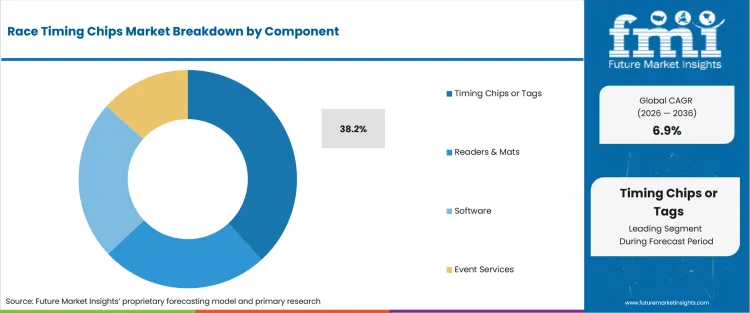
| Timing Chips or Tags Share (2026) | 38.2% |
Summary of the Race Timing Chips Market
| Market Signal | Commercial Impact |
|---|---|
| Demand and Growth Drivers | Mass participation and software-linked scoring are expected to expand chip timing beyond finish capture into broader event operations and participant communication.
|
| Product and Segment View | Passive tags suit high-volume road races while active chips fit repeated-pass formats that require reusable participant identification and precise lap detection.
|
| Geography and Growth Outlook | Country demand differs according to event scale and local timing support that determines installation quality and race-day response capability.
|
| Competitive Landscape | Competition centers on field reliability and workflow compatibility alongside technical support that protects event delivery during limited setup windows.
|
| Analyst Perspective | Race timing purchases are shaped by correction risk before they are shaped by tag price. A dependable event workflow must preserve participant identity from registration and chip assignment through verified scoring and published results.
|
Source: FMI's proprietary forecasting model and primary research
How is the Race Timing Chips Market segmented?
The Race Timing Chips Market is segmented by Chip Type, Event Type, Component, End Use, Sales Model, and region.
The market is segmented by chip type, event type, component, end use, and sales model. Chip Type covers Passive RFID Chips and Active RFID Chips alongside UHF Tags and Disposable Bib Tags, while events include Road Running and Triathlon alongside Cycling and Motorsports. Component covers Timing Chips or Tags and Readers & Mats alongside Software and Event Services, while End Use covers Event Organizers and Timing Service Providers alongside Sports Federations and Schools or Clubs. Sales Model covers Chip Sale and Rental alongside Subscription or Software, and RunSignup expanded RaceDay Mobile Version 6 across race-day workflows in June 2026. Regional coverage spans North America and Latin America alongside Europe, Asia Pacific, and Middle East & Africa. The RFID market supplies the identification layer linking participant tags to reader hardware during timed events.
What supports demand for Passive RFID Chips within the Chip Type category?
Mass road races need tags that arrive already linked to bib workflows because post-race chip collection adds labor at scale. In January 2025, MYLAPS announced BibTag use across Marine Corps Marathon events under a multi-year timing partnership. Disposable tag handling shifts procurement attention toward read verification and accurate chip-to-bib assignment before packet pickup. Organizers assess tag logistics together with mat coverage and scoring compatibility before approving a system for repeated race use.
- By chip type, passive RFID chips are estimated to hold 46.5% share in 2026 because mass road races need low-touch distribution at participant scale. MYLAPS extended its Houston Marathon Committee partnership in June 2025 to continue BibTag timing across recurring marathon operations. The arrangement supports recurring use where organizers require repeatable start and finish reads across high-volume fields.
- Timing service providers purchase passive tags in event-specific batches and test bib placement before packet distribution begins. MYLAPS reported in May 2025 that the Lincoln Marathon used 12 BibTag Smart Decoders for its timing setup. Providers compare encoding support and replacement availability before committing seasonal race calendars to the tags market.
How does Road Running shape purchasing within the Event Type category?
Road running concentrates chip volumes because every entrant crosses common control points even when start waves are separated. In October 2025, MYLAPS reported that BibTag technology was used at the Chicago Marathon for a high-volume road-running field. Marathon directors use dense start lanes and split points to preserve personal elapsed time across staggered starts. That operating pattern is expected to keep road events central to disposable tag demand and recurring timer-service contracts across race calendars.
- By event type, road running is projected to represent 53.8% share in 2026 because standardized start and finish points support high-volume passive timing. MYLAPS signed a multi-year BibTag agreement with France-based ProLiveSport in January 2026 for repeated mass-participation event timing. Timers serving recurring road calendars evaluate setup speed and local technical support alongside reader capacity before committing equipment across a season.
- Road-race organizers purchase timing as an operating workflow that connects registration records to split reads and published results. CheckPointSpot adopted BibTag Smart Decoders under an August 2025 MYLAPS partnership for events including Kuala Lumpur. Procurement teams review integration with the sports wearables because participant-facing data extends beyond finish time alone.
What drives use of Timing Chips or Tags within the Component category?
Timing chips and tags capture participant identity before readers and software turn each read into an event result. ChronoTrack introduced Kairos in May 2025 as a timing system designed for flexible course configurations. Component purchasing depends on verified compatibility between participant tags and control hardware across the intended course configuration. The active RFID reader remains relevant where repeat passes and higher-speed events justify reusable transponders. Service crews evaluate transponder battery needs and backup reading paths before field setup across repeated-pass or higher-speed event formats.
- By Component, Timing Chips or Tags are forecast to account for 38.2% share in 2026 because each timed entrant needs a verified identifier. ChronoTrack began shipping Gen4 Reusable Tri-Tags in August 2025 for timing operations that reuse participant hardware across events. Timing firms weigh reuse cycles and participant return procedures against the simpler logistics of disposable bib tags.
- Service providers use readers and mats as shared assets across events while tag demand changes with participant count. RACE RESULT documented a Ubidium installation at the British National Cycling Centre in March 2025. Engineering teams evaluate antenna placement and spare-unit access before standardizing equipment across recurring venue contracts and seasonal race schedules.
How do Timing Service Providers influence the End Use category?
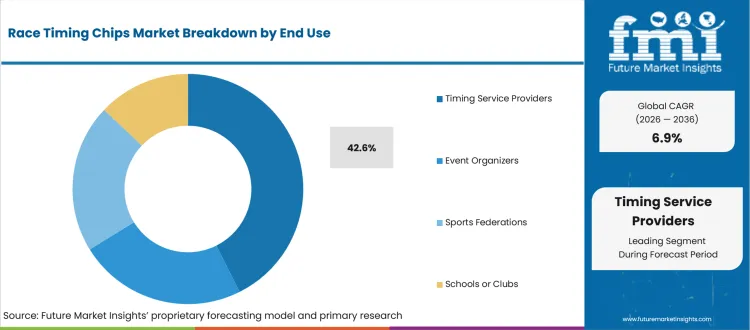
Timing service providers operate between organizers and hardware vendors because they configure equipment and manage race-day exceptions. In March 2025, RACE RESULT reported that 1st Place Sports used Ubidium technology for the Gate River Run. The project illustrates how specialist timing providers combine hardware setup with event-specific scoring before results reach organizers and participants. Service firms buy systems as repeat-use operating assets and need vendor support during event weekends.
- By End Use, Timing Service Providers are anticipated to hold 42.6% share in 2026 because many race directors outsource setup and scoring. RunSignup’s January 2025 Timer Education Summit included sessions on chip timing integration across race-day tools used by professional timers. Service firms assess training access and troubleshooting response before expanding a hardware fleet that must perform across several event formats.
- Sports federations and event organizers retain direct influence over accuracy requirements even when specialist timers run the equipment. ChronoTrack presented the new CT Live platform in April 2026 for timer workflows that connect event setup with result management. Organizers compare reporting controls and event apps market connectivity due to participant demand for results across several digital touchpoints.
Why is Rental relevant within the Sales Model category?
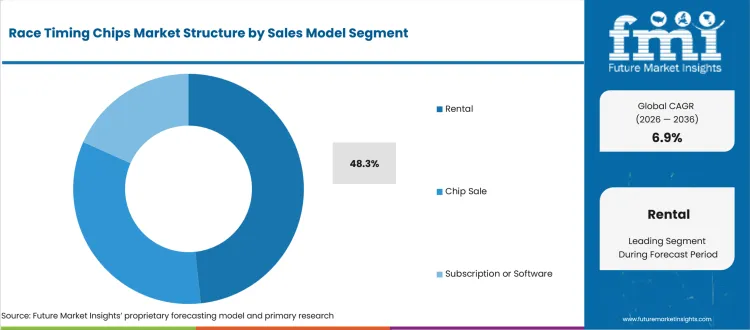
Rental and event-service contracts fit organizers that need full timing capability only around race dates. RunSignup released Mobile Timing App Version 5 with photo capture integration in February 2025 for field timing and result verification workflows. Service-based purchasing lets organizers access trained crews and backup processes without maintaining readers between events. Contracts depend on clear service scope and responsive support during setup and live race operations.
- By Sales Model, Rental is estimated to represent 48.3% share in 2026 because irregular event calendars discourage hardware ownership. Track Shack selected MYLAPS BibTag technology under a September 2025 collaboration for use across its event portfolio. Service providers compare setup labor and equipment availability before pricing recurring race packages that require predictable staffing and backup coverage.
- Smaller organizers often choose bundled service packages because one event needs tags and scoring support on the same day. RunSignup published a cross-country timing configuration guide in August 2025 that maps setup from scored events to result publishing.
What are the drivers, restraints, and opportunities in the Race Timing Chips Market?
Mass-start accuracy drives demand, correction workload restrains low-cost deployments, and open integrations create service expansion routes.
- Driver: Large start waves are expected to raise demand for timing systems that preserve participant identity across corrals and split points.
- Restraint: Missed reads and weak data synchronization are anticipated to extend correction work after crowded or multi-segment events.
- Opportunity: Open interfaces are projected to expand service options for timers that combine hardware from several vendors with one scoring workflow.
Read reliability is expected to shape upgrade decisions because crowded start lanes compress many tag passages into short intervals. ChronoTrack published Gen4 multi-sport tag performance testing in August 2025 after moving the tags into full production. Field evidence helps service teams judge antenna placement and tag orientation before event day under course conditions that match intended setups. Procurement reviews are expected to favor systems with repeatable reads under speed and density conditions that match the intended race format.
Correction work is anticipated to weaken returns when software transitions or configuration changes create mismatched participant records. RunSignup’s December 2025 transition guide advised timers moving from CT Live to rescore past races before live use. The guide described parallel operation as a transition path that lets timing teams validate scoring workflows before relying on replacement software. Event operators are expected to budget training and validation time before replacing a scoring stack that already supports recurring races.
Service providers are projected to expand account scope when one timing package supports race-day data and participant-facing updates. MYLAPS reported in September 2025 that Sydney Marathon weekend timing covered 50,000 participants across its events. Large fields create room for timers to package split reads with live results and tracking services. Rising adoption of RAIN RFID antenna is expected to attract technical interest where passive timing capacity depends on course layout and read-zone design.
Which country CAGRs are profiled in the Race Timing Chips Market?
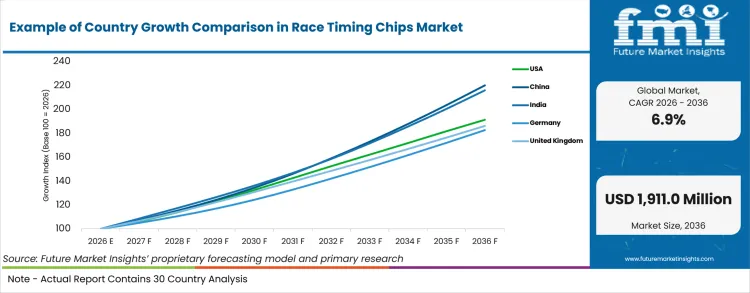
| Country | CAGR |
|---|---|
| United States | 6.7% |
| China | 8.2% |
| India | 8.0% |
| Germany | 6.2% |
| United Kingdom | 6.4% |
| Japan | 5.9% |
| South Korea | 7.1% |
| France | 6.8% |
Source: FMI's proprietary forecasting model and primary research
How do country-level CAGRs compare in the Race Timing Chips Market?
Country growth is expected to reflect event scale and local timer coverage more than one uniform adoption path. China and India are projected to require broader field support as organized races reach more cities. The United States and Western Europe are expected to emphasize integration between hardware and race-management software. Japan and South Korea are anticipated to prioritize dependable operations around large urban events where tightly managed starts increase execution pressure. RACE RESULT appointed an India distributor in August 2025 to provide local consulting and support. Country procurement varies by local service access and event format alongside the read accuracy required for each race setting.
- Large marathon fields and established timer networks give the United States a demanding reference environment for chip timing. United States demand is projected to expand at 6.7% CAGR through 2036 under recurring road-race calendars and established timer networks. New York Road Runners reported in November 2025 that its marathon recorded 59,226 finishers. That field size increases pressure on bib assignment and start-wave control because corrections become costly after publication. Software platforms connect race-day scoring with registration records and participant-facing result delivery for event operators.
- Urban running events in China draw participants across city boundaries and require consistent timing operations for traveling fields. Shanghai’s municipal government reported in March 2025 that more than 60% of Jing’an Half Marathon participants came from outside Shanghai. China demand is projected to expand at 8.2% CAGR through 2036 as organized event calendars extend beyond established metropolitan races. Local sports commissions and event organizers coordinate race operations within city permitting systems that influence course access and race-day controls.
- India combines large public races with expanding private event calendars across metropolitan and regional locations. TimeKeeper Solutions provides local RFID timing services for running and cycling events that require field setup and race-day support. The Press Information Bureau reported in November 2025 that the Sekhon IAF Marathon involved more than 45,000 participants nationwide. India demand is estimated to advance at 8.0% CAGR through 2036 as organized race calendars spread across metropolitan and regional locations. Organizers are expected to favor local setup support because travel distance raises equipment and staffing complexity.
- Germany combines dense road-running calendars with specialist timing companies and repeated use of established event infrastructure. German demand is forecast to expand at 6.2% CAGR through 2036 under recurring road and endurance event schedules. Berlin’s official city portal reported in April 2026 that more than 40,000 athletes compete in the Berlin Marathon each year. Large fields are expected to increase the need for tested start mats and documented post-race correction procedures. SPORTident GmbH provides a local timing technology base for outdoor sports and endurance events that use reusable participant identification hardware. Event organizers are expected to compare system reliability and service response before awarding recurring contracts across established race calendars. Suppliers supporting reusable equipment fleets are anticipated to fit events where timing assets serve several races each season.
- United Kingdom race organizers operate across large city marathons and venue-based cycling events with different timing requirements. London Marathon Events reported in April 2026 that its marathon recorded 59,830 finishers across the completed mass-participation field. Timing contractors must preserve participant records across registration and result publishing under crowded field conditions. United Kingdom demand is anticipated to expand at 6.4% CAGR through 2036 under recurring road-running and specialist cycling timing requirements. Event teams are expected to assess software integration and weather tolerance before selecting timing partners.
- Japan’s urban races place timing systems inside tightly managed event operations and participant communication workflows. The Tokyo Marathon Foundation planned a field of 39,000 participants for the 2026 event in its June 2025 announcement. Japan demand is projected to expand at 5.9% CAGR through 2036 under tightly managed urban race operations and established participant communication workflows. Local organizers are expected to prioritize stable read performance and controlled participant data exchange across registration and result publication systems. Major urban races set strict expectations for read reliability and participant-facing timing services across the local market. Procurement teams are anticipated to review tag distribution processes and technical support before event-scale use. Reliable integration with participant result services is expected to remain a central screening factor during system approval and event preparation.
- South Korea’s concentrated urban event network creates high-visibility operating conditions for race timing suppliers and race-day service teams. Seoul Metropolitan Government reported in March 2025 that Seoul Marathon participants represented 66 countries across the international event field. City race guidelines and transport coordination are expected to raise the value of dependable start procedures and controlled participant flows. South Korea is estimated to expand at 7.1% CAGR through 2036 under recurring urban road-race operations. Local organizers are expected to evaluate timing partners on setup control and result publishing speed across crowded event environments.
- France has a broad road-running base that supports recurring demand for timing services across city and regional events. Regional race organizers need timer coverage that moves between city events and smaller local calendars without changing result workflows. The French Athletics Federation reported in March 2026 that marathon events produced 167,000 recorded results during 2025. French timing providers are expected to balance field capacity with responsive local technical support before accepting recurring multi-race contracts. France demand is forecast to expand at 6.8% CAGR through 2036 under a broad road-running base and recurring event-service requirements. Organizers are anticipated to compare disposable tag handling and result-platform compatibility before awarding multi-race work.
Who are the notable companies in the Race Timing Chips Market?
MYLAPS Sports Technology, RACE RESULT AG, ChronoTrack Systems, RunSignup, SPORTident GmbH, ID Tech Solutions, TimeKeeper Solutions, and Identium Tech Solutions are the notable companies shaping this market.
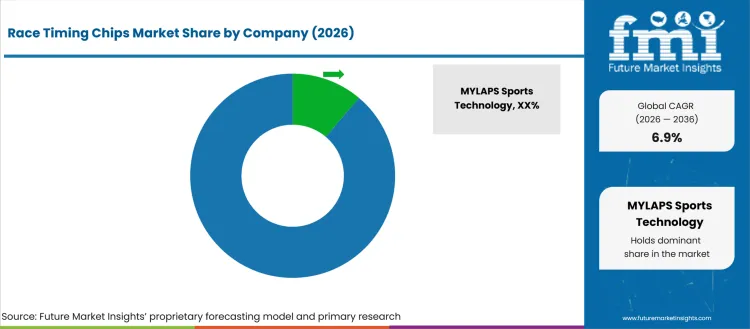
Competition is shaped by read reliability and setup speed alongside software compatibility and service response. Timing firms need systems that fit road races and multisport events without creating separate data workflows for every course. An October 2025 RunSignup scoring-platform update described open connectivity across multiple chip and timing systems used by professional timers. That direction increases pressure on hardware vendors to support clean interfaces and documented setup practices. The wearable fitness technology market is expected to add another participant data source around timed events and performance records. Timing providers are expected to compare interoperability and field support before selecting equipment based only on hardware price differences.
- MYLAPS Sports Technology and RACE RESULT AG compete across mass-event and multisport timing through passive and active transponder portfolios. Account decisions are expected to compare field reliability and timer support because both companies connect hardware choices with software workflows and recurring event operations.
- ChronoTrack Systems competes through controllers and participant tags connected to CT Live monitoring and result workflows across professional timing operations. RunSignup competes through scoring and race-management software used by timers that need clean movement from reader output to published results.
- SPORTident GmbH serves outdoor and endurance formats through station-and-card systems designed for repeated course controls and participant identification. ID Tech Solutions and Identium Tech Solutions serve Indian RFID timing projects where local setup support and equipment availability are expected to influence vendor selection before recurring event schedules.
- TimeKeeper Solutions competes through service-led timing for running and cycling events that need local field setup and operational support. Regional firms are expected to win work through setup knowledge and backup procedures while global equipment brands remain suited to accounts requiring standardized hardware across several event formats.
Competitive Benchmarking: Race Timing Chips Market
| Company | Relevance | Portfolio / Focus | Account Access | Footprint / Service Reach |
|---|---|---|---|---|
| MYLAPS Sports Technology | High | Passive and active timing | Timer and organizer channels | Global |
| RACE RESULT AG | High | Hardware, transponders, software | Timer and distributor channels | Global |
| ChronoTrack Systems | High | Controllers, tags, CT Live | Timer networks | Global |
| RunSignup | High | Scoring, results, registration integration | Race directors and timers | United States |
| SPORTident GmbH | Medium | Outdoor timing stations and cards | Clubs and event organizers | Global |
| ID Tech Solutions | Medium | RFID tags, readers, race timing systems | Direct project sales | Regional: India |
| TimeKeeper Solutions | Medium | Timing services and RFID systems | Event organizer contracts | Country-specific: India |
| Identium Tech Solutions | Medium | UHF race timing packages | Direct project sales | Regional: India |
Source: Future Market Insights competitive analysis, 2026. Ratings reflect relative portfolio relevance and workflow fit. Service capability and geographic reach shape the remaining comparison.
Key Developments in the Race Timing Chips Market
- In February 2026, MYLAPS Sports Technology announced that Peak Timing selected BibTag technology for events in Africa. The agreement extended passive timing use through a specialist regional timer that owns equipment and supports race operations locally. Regional timer ownership keeps equipment and technical support closer to active race calendars that need local equipment support.
- In November 2025, RACE RESULT AG expanded service across the Southern Cone through local operations in Argentina. The move brought equipment stock and technical support closer to regional timers managing events across the Southern Cone. Local availability is expected to simplify equipment purchases for events that need replacement hardware and responsive race-day technical support.
- In July 2026, ChronoTrack Systems released its Controller Status Dashboard for general availability across supported timer operations. The dashboard provides live controller monitoring that helps timing crews review field hardware status during race operations. The release expands software oversight around field controllers and supports quicker equipment-status checks before and during races.
- In March 2026, RunSignup extended its RACE RESULT integration to publish live results directly into the RunSignup platform. The connection automates result movement between scoring workflows and participant-facing pages during live races. Timer accounts are expected to value fewer manual exports and simpler result publication during event-day operations.
Key Players in the Race Timing Chips Market
Timing System Platforms
- MYLAPS Sports Technology
- RACE RESULT AG
- ChronoTrack Systems
- SPORTident GmbH
Race-Day Software and Scoring
- RunSignup
RFID and Regional Timing Providers
- ID Tech Solutions
- TimeKeeper Solutions
- Identium Tech Solutions
Race Timing Chips Market - Report Scope
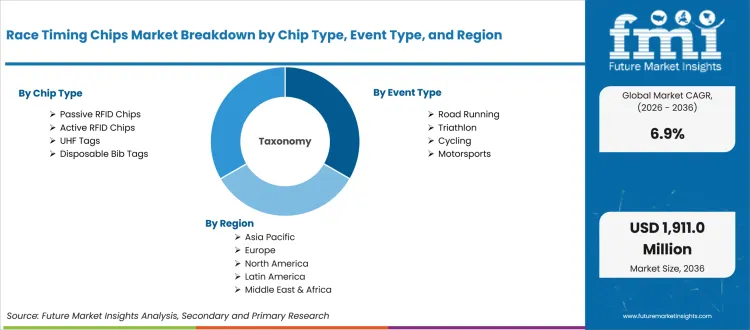
| Coverage field | Report scope |
|---|---|
| Market breakdown | By Chip Type, Event Type, Component, End Use, Sales Model, and Region. |
| Market Definition | RFID and chip-based race timing hardware plus related readers and scoring workflow components used to identify participants and record race times. |
| Regions Covered | North America, Latin America, Europe, Asia Pacific, and Middle East & Africa. |
| Countries Covered | United States, China, India, Germany, United Kingdom, Japan, South Korea, and France. |
| Key Companies Profiled | MYLAPS Sports Technology, RACE RESULT AG, ChronoTrack Systems, RunSignup, SPORTident GmbH, ID Tech Solutions, TimeKeeper Solutions, and Identium Tech Solutions. |
| Forecast Period | 2026 to 2036. |
| Approach | Bottom-up event and supplier assessment reconciled with primary interviews and FMI proprietary forecasting models. |
Source: Future Market Insights - analysis driven by proprietary forecasting models and primary research
Race Timing Chips Market - Research Methodology
| Method | Approach |
|---|---|
| Primary Research | Interviews across timing services and event operations test purchasing behavior and workflow requirements before market estimates are finalized. Hardware vendors and software providers contribute technical perspectives that help assess integration requirements and channel access patterns. |
| Desk Research | Official event records and company disclosures are reviewed to map product relevance and deployment activity across the target market. |
| Market Sizing and Forecasting | Event activity and supplier revenue signals are reconciled with installed equipment patterns and service-model adoption before forecast modeling. |
| Data Validation | Findings are cross-checked across independent primary inputs and official source records before final estimates are approved. |
Source: Future Market Insights (FMI) analysis, based on proprietary forecasting model and primary research
Race Timing Chips Market by Segments
Race Timing Chips Market segmented by Chip Type:
- Passive RFID Chips
- Active RFID Chips
- UHF Tags
- Disposable Bib Tags
Race Timing Chips Market segmented by Event Type:
- Road Running
- Triathlon
- Cycling
- Motorsports
Race Timing Chips Market segmented by Component:
- Timing Chips or Tags
- Readers & Mats
- Software
- Event Services
Race Timing Chips Market segmented by End Use:
- Event Organizers
- Timing Service Providers
- Sports Federations
- Schools or Clubs
Race Timing Chips Market segmented by Sales Model:
- Chip Sale
- Rental
- Subscription or Software
Race Timing Chips Market by Region:
- North America
- United States
- Canada
- Latin America
- Brazil
- Mexico
- Argentina
- Europe
- Germany
- United Kingdom
- France
- Italy
- Spain
- Rest of Europe
- Asia Pacific
- China
- India
- Japan
- South Korea
- Australia & New Zealand
- Rest of Asia Pacific
- Middle East & Africa
- GCC Countries
- South Africa
- Rest of Middle East & Africa
Research Sources and Bibliography
- Running USA. (2025, February). Running USA Releases 2024 Top Races Report Highlighting Significant Growth Across All Categories. Running USA.
- RunSignup. (2026, February). Advanced RaceDay Technology Powers Millions of Interactions. RunSignup.
- RunSignup. (2026, June). RaceDay Mobile Version 6 is Now Available. RunSignup.
- MYLAPS Sports Technology. (2025, January). MCM partners with industry leaders to use BibTag. MYLAPS Sports Technology.
- MYLAPS Sports Technology. (2025, June). MYLAPS and the Houston Marathon Committee Extend Partnership. MYLAPS Sports Technology.
- MYLAPS Sports Technology. (2025, May). BibTag at the 2025 Lincoln Marathon. MYLAPS Sports Technology.
- MYLAPS Sports Technology. (2025, October). BibTag technology at the Chicago Marathon. MYLAPS Sports Technology.
- MYLAPS Sports Technology. (2026, January). MYLAPS Announces Long-Term BibTag Agreement with ProLiveSport. MYLAPS Sports Technology.
- MYLAPS Sports Technology. (2025, August). CheckPointSpot signs long-term partnership with MYLAPS. MYLAPS Sports Technology.
- ChronoTrack. (2025, May). Kairos: ChronoTrack’s Most Flexible Timing Solution Yet. ChronoTrack.
- ChronoTrack. (2025, August). Gen4 Reusable Tri-Tags Now Shipping. ChronoTrack.
- RACE RESULT. (2025, March). Ubidium Installation at the British National Cycling Centre. RACE RESULT.
- RACE RESULT. (2025, March). 1st Place Sports Uses Ubidium technology. RACE RESULT.
- RunSignup. (2025, January). Inside the Timer Education Summit. RunSignup.
- ChronoTrack. (2026, April). Meet The New CT Live. ChronoTrack.
- RunSignup. (2025, February). NEW Mobile Timing App Photo Capture Integration. RunSignup.
- MYLAPS Sports Technology. (2025, September). Track Shack chooses MYLAPS for accurate timing technology. MYLAPS Sports Technology.
- RunSignup. (2025, August). Cross Country Timing with RaceDay Scoring. RunSignup.
- ChronoTrack. (2025, August). Gen4 Multi-Sport Tag Performance: What the Numbers Really Mean. ChronoTrack.
- RunSignup. (2025, December). RaceDay Scoring for CT Live Timers: A Transition Guide. RunSignup.
- MYLAPS Sports Technology. (2025, September). Course Records at Sydney’s debut as a World Marathon Major. MYLAPS Sports Technology.
- RACE RESULT. (2025, August). Expanding Presence in India with Local Distributor. RACE RESULT.
- New York Road Runners. (2025, November). New York Road Runners Breaks Record AGAIN as 2025 TCS New York City Marathon Becomes World’s Largest Marathon Ever with 59,000+ Finishers. New York Road Runners.
- Shanghai Municipal People’s Government. (2025, March). Guide to 2025 Shanghai Jing’an Half Marathon. Shanghai Municipal People’s Government.
- Press Information Bureau. (2025, November). First-Ever Sekhon Indian Air Force Marathon 2025 Witnesses Spectacular Culmination. Government of India.
- Berlin.de. (2026, April). Berlin Marathon. State of Berlin.
- London Marathon Events. (2026, April). 2026 TCS London Marathon breaks the Guinness World Records title for the largest number of finishers in a marathon. London Marathon Events.
- Tokyo Marathon Foundation. (2025, June). Announcement Regarding the Tokyo Marathon 2026. Tokyo Marathon Foundation.
- Seoul Metropolitan Government. (2025, March). Seoul to Host 2025 Seoul Marathon, Korea’s Only World Athletics Platinum Label Race. Seoul Metropolitan Government.
- French Athletics Federation. (2026, March). Running : les pelotons rajeunissent et se féminisent. French Athletics Federation.
- RunSignup. (2025, October). Top Ten Features of RaceDay Scoring. RunSignup.
- MYLAPS Sports Technology. (2026, February). MYLAPS selected to provide BibTag to Peak Timing for events in Africa. MYLAPS Sports Technology.
- RACE RESULT. (2025, November). Enhanced Service for the Entire Southern Cone. RACE RESULT.
- ChronoTrack. (2026, July). Introducing: The Controller Status Dashboard. ChronoTrack.
- RunSignup. (2026, March). Easy RACE RESULT to RunSignup Results Integration. RunSignup.
This bibliography is provided for reader reference and uses primary government sources, standards-body references, official trade bodies, and company sources.
This Report Answers
- What is the Race Timing Chips Market value in 2026 and what valuation is projected for 2036?
- What CAGR is the Race Timing Chips Market projected to record through the forecast period?
- How is the market segmented by chip type and event type together with component and end use and sales model?
- Which operating conditions are expected to drive adoption of automated race timing systems?
- Why are country CAGRs projected to differ across the profiled race timing markets?
- Which technical and service dimensions are expected to shape competition among timing system providers?
- How does FMI validate market sizing and forecast assumptions for the Race Timing Chips Market?
- What should organizers and timing service providers evaluate before choosing tags and readers and scoring software?
- How do result workflows and data synchronization affect race timing procurement decisions?
Frequently Asked Questions
What is driving growth in the Race Timing Chips Market?
Mass-start events need automated identity capture that preserves personal elapsed time across corrals and split points. Organizers are expected to adopt chip timing where manual scoring creates correction work and slow result publication.
Who are the key players in the Race Timing Chips Market?
MYLAPS Sports Technology, RACE RESULT AG, ChronoTrack Systems, RunSignup, and SPORTident GmbH compete alongside regional RFID providers. Competition centers on read reliability and workflow compatibility together with responsive field support during event preparation and active race delivery.
What is a significant restraint in the Race Timing Chips Market?
Correction workload limits adoption when missed reads or mismatched participant records require manual repair after an event. Weak transition planning between hardware and scoring systems is expected to extend training needs and operating risk.
Why should executives track the Race Timing Chips Market?
Race timing systems connect participant identity with live event operations and public result delivery across crowded starts and recurring split points. Executives should track the market because integration quality affects event capacity and service scope and repeat account value.
What business problem does the Race Timing Chips Market address?
The market addresses the difficulty of recording accurate individual times when large participant fields cross shared start and finish points. Chip-based systems reduce dependence on manual finish order and support split-time recording across staggered starts and repeated course control points.
What should procurement leaders evaluate before selecting suppliers?
Procurement leaders should assess read reliability and tag logistics before reviewing reader coverage and scoring compatibility. Field support and replacement equipment access should be reviewed before recurring race calendars are committed to one timing ecosystem.
What limits return on investment for purchasers?
Returns weaken when equipment sits unused between events or correction labor rises after missed reads. Poor software integration is expected to add reconciliation work and delay results after the race.
How do suppliers build long-term account confidence?
Suppliers build long-term account confidence through repeatable field performance and clear setup documentation for each event. Responsive event-weekend support keeps chip reads moving into scoring and published results across recurring race calendars.
Preview the report firsthand - request a free sample
Get SampleGet the brochure for pricing and purchase details.
Get PDFTable of Content
- Key Takeaways
- Market Size and CAGR
- Top Growth Driver
- Fastest Growing Segment
- Leading Region
- Key Companies
- Emerging Opportunities
- Executive Summary
- Global Market Outlook
- Demand-side Trends
- Supply-side Trends
- Technology Roadmap Analysis
- Analysis and Recommendations
- Analyst Perspective (What is happening? Why now? What should investors know?)
- Key Questions Answered
- How large is the market?
- What is the CAGR?
- What are key trends?
- Which region dominates?
- Who are the leaders?
- Market Overview
- Market Coverage / Taxonomy
- Market Definition / Scope / Limitations
- Research Methodology
- Chapter Orientation
- Analytical Lens and Working Hypotheses
- Market Structure, Signals, and Trend Drivers
- Benchmarking and Cross-market Comparability
- Market Sizing, Forecasting, and Opportunity Mapping
- Research Design and Evidence Framework
- Desk Research Programme (Secondary Evidence)
- Expert Input and Fieldwork (Primary Evidence)
- Tooling, Models, and Reference Databases
- Data Engineering and Model Build
- Quality Assurance and Audit Trail
- Market Background
- Market Dynamics (Drivers, Restraints, Opportunity, Trends)
- Scenario Forecast (Optimistic, Likely, Conservative)
- Impact Analysis
- AI Impact
- Sustainability Impact
- Regulatory Impact
- Technology Impact
- Consumer / Buyer Analysis
- Purchase Drivers
- Adoption Barriers
- Buyer Journey
- Opportunity Map Analysis
- Product Life Cycle Analysis
- Supply Chain Analysis
- Investment Feasibility Matrix
- Value Chain Analysis
- PESTLE and Porter's Analysis
- Regulatory Landscape
- Regional Parent Market Outlook
- Production and Consumption Statistics
- Import and Export Statistics
- Global Market Analysis and Forecast, 2021 to 2036
- Historical Market Size Value (USD Million) Analysis, 2021 to 2025
- Current and Future Market Size Value (USD Million) Projections, 2026 to 2036
- Y-o-Y Growth Trend Analysis
- Absolute $ Opportunity Analysis
- Global Market Pricing Analysis, 2021 to 2036
- Global Market Analysis and Forecast, By Chip Type, 2021 to 2036
- Introduction / Key Findings
- Historical Market Size Value (USD Million) Analysis By Chip Type, 2021 to 2025
- Current and Future Market Size Value (USD Million) Analysis and Forecast By Chip Type, 2026 to 2036
- Passive RFID Chips
- Active RFID Chips
- UHF Tags
- Disposable Bib Tags
- Passive RFID Chips
- Y-o-Y Growth Trend Analysis By Chip Type, 2021 to 2025
- Absolute $ Opportunity Analysis By Chip Type, 2026 to 2036
- Global Market Analysis and Forecast, By Event Type, 2021 to 2036
- Introduction / Key Findings
- Historical Market Size Value (USD Million) Analysis By Event Type, 2021 to 2025
- Current and Future Market Size Value (USD Million) Analysis and Forecast By Event Type, 2026 to 2036
- Road Running
- Triathlon
- Cycling
- Motorsports
- Road Running
- Y-o-Y Growth Trend Analysis By Event Type, 2021 to 2025
- Absolute $ Opportunity Analysis By Event Type, 2026 to 2036
- Global Market Analysis and Forecast, By Component, 2021 to 2036
- Introduction / Key Findings
- Historical Market Size Value (USD Million) Analysis By Component, 2021 to 2025
- Current and Future Market Size Value (USD Million) Analysis and Forecast By Component, 2026 to 2036
- Timing Chips or Tags
- Readers & Mats
- Software
- Event Services
- Timing Chips or Tags
- Y-o-Y Growth Trend Analysis By Component, 2021 to 2025
- Absolute $ Opportunity Analysis By Component, 2026 to 2036
- Global Market Analysis and Forecast, By End Use, 2021 to 2036
- Introduction / Key Findings
- Historical Market Size Value (USD Million) Analysis By End Use, 2021 to 2025
- Current and Future Market Size Value (USD Million) Analysis and Forecast By End Use, 2026 to 2036
- Timing Service Providers
- Event Organizers
- Sports Federations
- Schools or Clubs
- Timing Service Providers
- Y-o-Y Growth Trend Analysis By End Use, 2021 to 2025
- Absolute $ Opportunity Analysis By End Use, 2026 to 2036
- Global Market Analysis and Forecast, By Sales Model, 2021 to 2036
- Introduction / Key Findings
- Historical Market Size Value (USD Million) Analysis By Sales Model, 2021 to 2025
- Current and Future Market Size Value (USD Million) Analysis and Forecast By Sales Model, 2026 to 2036
- Rental
- Chip Sale
- Subscription or Software
- Rental
- Y-o-Y Growth Trend Analysis By Sales Model, 2021 to 2025
- Absolute $ Opportunity Analysis By Sales Model, 2026 to 2036
- Global Market Analysis and Forecast, By Region, 2021 to 2036
- Introduction
- Historical Market Size Value (USD Million) Analysis By Region, 2021 to 2025
- Current Market Size Value (USD Million) Analysis and Forecast By Region, 2026 to 2036
- North America
- Latin America
- Western Europe
- Eastern Europe
- East Asia
- South Asia and Pacific
- Middle East & Africa
- Market Attractiveness Analysis By Region
- North America Market Analysis and Forecast, By Country, 2021 to 2036
- Historical Market Size Value (USD Million) Trend Analysis By Market Taxonomy, 2021 to 2025
- Market Size Value (USD Million) Forecast By Market Taxonomy, 2026 to 2036
- By Country
- USA
- Canada
- By Chip Type
- By Event Type
- By Component
- By End Use
- By Sales Model
- By Country
- Market Attractiveness Analysis
- By Country
- By Chip Type
- By Event Type
- By Component
- By End Use
- By Sales Model
- Key Takeaways
- Latin America Market Analysis and Forecast, By Country
- Historical Market Size Value (USD Million) Trend Analysis By Market Taxonomy, 2021 to 2025
- Market Size Value (USD Million) Forecast By Market Taxonomy, 2026 to 2036
- By Country
- Brazil
- Mexico
- Chile
- Rest of Latin America
- By Chip Type
- By Event Type
- By Component
- By End Use
- By Sales Model
- By Country
- Market Attractiveness Analysis
- By Country
- By Chip Type
- By Event Type
- By Component
- By End Use
- By Sales Model
- Key Takeaways
- Western Europe Market Analysis and Forecast, By Country
- Historical Market Size Value (USD Million) Trend Analysis By Market Taxonomy, 2021 to 2025
- Market Size Value (USD Million) Forecast By Market Taxonomy, 2026 to 2036
- By Country
- Germany
- UK
- Italy
- Spain
- France
- Nordic
- BENELUX
- Rest of Western Europe
- By Chip Type
- By Event Type
- By Component
- By End Use
- By Sales Model
- By Country
- Market Attractiveness Analysis
- By Country
- By Chip Type
- By Event Type
- By Component
- By End Use
- By Sales Model
- Key Takeaways
- Eastern Europe Market Analysis and Forecast, By Country
- Historical Market Size Value (USD Million) Trend Analysis By Market Taxonomy, 2021 to 2025
- Market Size Value (USD Million) Forecast By Market Taxonomy, 2026 to 2036
- By Country
- Russia
- Poland
- Hungary
- Balkan & Baltic
- Rest of Eastern Europe
- By Chip Type
- By Event Type
- By Component
- By End Use
- By Sales Model
- By Country
- Market Attractiveness Analysis
- By Country
- By Chip Type
- By Event Type
- By Component
- By End Use
- By Sales Model
- Key Takeaways
- East Asia Market Analysis and Forecast, By Country
- Historical Market Size Value (USD Million) Trend Analysis By Market Taxonomy, 2021 to 2025
- Market Size Value (USD Million) Forecast By Market Taxonomy, 2026 to 2036
- By Country
- China
- Japan
- South Korea
- By Chip Type
- By Event Type
- By Component
- By End Use
- By Sales Model
- By Country
- Market Attractiveness Analysis
- By Country
- By Chip Type
- By Event Type
- By Component
- By End Use
- By Sales Model
- Key Takeaways
- South Asia and Pacific Market Analysis and Forecast, By Country
- Historical Market Size Value (USD Million) Trend Analysis By Market Taxonomy, 2021 to 2025
- Market Size Value (USD Million) Forecast By Market Taxonomy, 2026 to 2036
- By Country
- India
- ASEAN
- Australia & New Zealand
- Rest of South Asia and Pacific
- By Chip Type
- By Event Type
- By Component
- By End Use
- By Sales Model
- By Country
- Market Attractiveness Analysis
- By Country
- By Chip Type
- By Event Type
- By Component
- By End Use
- By Sales Model
- Key Takeaways
- Middle East & Africa Market Analysis and Forecast, By Country
- Historical Market Size Value (USD Million) Trend Analysis By Market Taxonomy, 2021 to 2025
- Market Size Value (USD Million) Forecast By Market Taxonomy, 2026 to 2036
- By Country
- Kingdom of Saudi Arabia
- Other GCC Countries
- Türkiye
- South Africa
- Other African Union
- Rest of Middle East & Africa
- By Chip Type
- By Event Type
- By Component
- By End Use
- By Sales Model
- By Country
- Market Attractiveness Analysis
- By Country
- By Chip Type
- By Event Type
- By Component
- By End Use
- By Sales Model
- Key Takeaways
- Key Countries Market Analysis
- USA
- Pricing Analysis
- Market Share Analysis, 2025
- By Chip Type
- By Event Type
- By Component
- By End Use
- By Sales Model
- Canada
- Pricing Analysis
- Market Share Analysis, 2025
- By Chip Type
- By Event Type
- By Component
- By End Use
- By Sales Model
- Mexico
- Pricing Analysis
- Market Share Analysis, 2025
- By Chip Type
- By Event Type
- By Component
- By End Use
- By Sales Model
- Brazil
- Pricing Analysis
- Market Share Analysis, 2025
- By Chip Type
- By Event Type
- By Component
- By End Use
- By Sales Model
- Chile
- Pricing Analysis
- Market Share Analysis, 2025
- By Chip Type
- By Event Type
- By Component
- By End Use
- By Sales Model
- Germany
- Pricing Analysis
- Market Share Analysis, 2025
- By Chip Type
- By Event Type
- By Component
- By End Use
- By Sales Model
- UK
- Pricing Analysis
- Market Share Analysis, 2025
- By Chip Type
- By Event Type
- By Component
- By End Use
- By Sales Model
- Italy
- Pricing Analysis
- Market Share Analysis, 2025
- By Chip Type
- By Event Type
- By Component
- By End Use
- By Sales Model
- Spain
- Pricing Analysis
- Market Share Analysis, 2025
- By Chip Type
- By Event Type
- By Component
- By End Use
- By Sales Model
- France
- Pricing Analysis
- Market Share Analysis, 2025
- By Chip Type
- By Event Type
- By Component
- By End Use
- By Sales Model
- India
- Pricing Analysis
- Market Share Analysis, 2025
- By Chip Type
- By Event Type
- By Component
- By End Use
- By Sales Model
- ASEAN
- Pricing Analysis
- Market Share Analysis, 2025
- By Chip Type
- By Event Type
- By Component
- By End Use
- By Sales Model
- Australia & New Zealand
- Pricing Analysis
- Market Share Analysis, 2025
- By Chip Type
- By Event Type
- By Component
- By End Use
- By Sales Model
- China
- Pricing Analysis
- Market Share Analysis, 2025
- By Chip Type
- By Event Type
- By Component
- By End Use
- By Sales Model
- Japan
- Pricing Analysis
- Market Share Analysis, 2025
- By Chip Type
- By Event Type
- By Component
- By End Use
- By Sales Model
- South Korea
- Pricing Analysis
- Market Share Analysis, 2025
- By Chip Type
- By Event Type
- By Component
- By End Use
- By Sales Model
- Russia
- Pricing Analysis
- Market Share Analysis, 2025
- By Chip Type
- By Event Type
- By Component
- By End Use
- By Sales Model
- Poland
- Pricing Analysis
- Market Share Analysis, 2025
- By Chip Type
- By Event Type
- By Component
- By End Use
- By Sales Model
- Hungary
- Pricing Analysis
- Market Share Analysis, 2025
- By Chip Type
- By Event Type
- By Component
- By End Use
- By Sales Model
- Kingdom of Saudi Arabia
- Pricing Analysis
- Market Share Analysis, 2025
- By Chip Type
- By Event Type
- By Component
- By End Use
- By Sales Model
- Türkiye
- Pricing Analysis
- Market Share Analysis, 2025
- By Chip Type
- By Event Type
- By Component
- By End Use
- By Sales Model
- South Africa
- Pricing Analysis
- Market Share Analysis, 2025
- By Chip Type
- By Event Type
- By Component
- By End Use
- By Sales Model
- USA
- Market Structure Analysis
- Competition Dashboard
- Competition Benchmarking
- Market Share Analysis of Top Players
- By Regional
- By Chip Type
- By Event Type
- By Component
- By End Use
- By Sales Model
- Emerging Startups
- Innovation Benchmarking
- Competition Analysis
- Competition Deep Dive
- MYLAPS Sports Technology
- Overview
- Product Portfolio
- Profitability by Market Segments
- Sales Footprint
- Strategy Overview
- Marketing Strategy
- Product Strategy
- Channel Strategy
- RACE RESULT AG
- ChronoTrack Systems
- RunSignup
- SPORTident GmbH
- ID Tech Solutions
- TimeKeeper Solutions
- Identium Tech Solutions
- MYLAPS Sports Technology
- Case Studies
- Success Stories
- Recent Developments
- Competition Deep Dive
- Assumptions & Acronyms Used


