The rotation speed indicators market is set to expand from USD 1,376.5 million in 2025 to USD 2,419.0 million by 2035, reflecting a CAGR of 5.8%. The growth trajectory shows several breakpoints that reflect shifts in adoption, technology integration, and industry requirements. The first breakpoint occurs in the early phase, 2025–2027, when the demand rises sharply due to modernization of industrial machinery, increased automation in manufacturing, and growing focus on predictive maintenance. Industries such as automotive, aerospace, and heavy machinery drive initial adoption, emphasizing precision, reliability, and real-time monitoring.
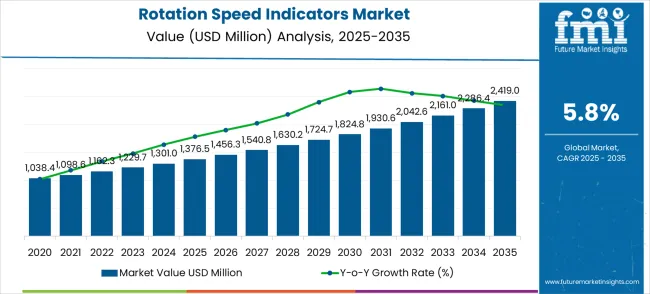
The second breakpoint emerges around 2029–2031, where growth stabilizes as the market experiences broader penetration and technology standardization. During this phase, incremental improvements in digital displays, wireless connectivity, and sensor accuracy sustain interest without dramatic surges. The final breakpoint is observed from 2032 to 2035, when integration of advanced IoT-enabled rotation speed indicators and cloud-based monitoring platforms accelerates market growth again. Manufacturers focus on modular designs, durability, and energy efficiency, enhancing adoption across industrial and commercial sectors.
| Metric | Value |
|---|---|
| Estimated Value in (2025E) | USD 1,376.5 million |
| Forecast Value in (2035F) | USD 2,419.0 million |
| Forecast CAGR (2025 to 2035) | 5.8% |
The rotation speed indicators market is divided into automotive and transportation at 36%, industrial machinery at 28%, aerospace and aviation at 16%, power generation at 12%, and marine/specialty equipment at 8%. Automotive leads adoption as rotation speed indicators are critical for monitoring engine RPM, transmission systems, and vehicle performance. Industrial machinery utilizes them to optimize operational efficiency, maintain safety, and prevent mechanical failures. Aerospace and aviation rely on precise indicators for turbines, rotors, and instrumentation systems. Power generation plants use them for turbines, generators, and pumps to ensure energy efficiency. Marine and specialty equipment adopt them for navigation, propulsion, and performance monitoring in harsh environments.
Trends in the rotation speed indicators market include digital and wireless indicators for real-time monitoring and enhanced accuracy. Manufacturers are innovating with sensor integration, IoT-enabled diagnostics, and high-precision measurement systems to support predictive maintenance. Expansion into electric vehicles, industrial automation, and renewable energy turbines is driving adoption. Development of compact, rugged, and vibration-resistant designs ensures performance in challenging operating conditions. Collaborations between indicator manufacturers and OEMs are enabling customized solutions for specific machinery and vehicle types.
Market expansion is being supported by the increasing global demand for precision monitoring equipment and the corresponding need for reliable speed measurement systems that can ensure operational safety while optimizing equipment performance across various industrial applications. Modern manufacturing facilities and equipment operators are increasingly focused on implementing monitoring solutions that can provide real-time operational data, enable predictive maintenance, and ensure consistent equipment performance under demanding operating conditions. Rotation speed indicators' proven ability to deliver accurate speed measurement, operational safety enhancement, and maintenance optimization makes them essential components for contemporary industrial operations and equipment management.
The growing focus on operational efficiency and predictive maintenance is driving demand for rotation speed indicators that can support advanced monitoring systems, enable data-driven decision making, and provide early warning capabilities for potential equipment issues without compromising operational continuity. Industrial operators' preference for monitoring equipment that combines measurement accuracy with operational reliability and data integration capabilities is creating opportunities for innovative indicator implementations. The rising influence of Industry 4.0 and smart manufacturing initiatives is also contributing to increased adoption of rotation speed indicators that can provide connected monitoring capabilities and advanced analytics support.
The market is segmented by indicator type, application, and region. By indicator type, the market is divided into analog rotation speed indicators, digital rotation speed indicators, and hybrid indicators. Based on application, the market is categorized into automobile, energy, and medical. Regionally, the market is divided into North America, Europe, East Asia, South Asia & Pacific, Latin America, and the Middle East & Africa.
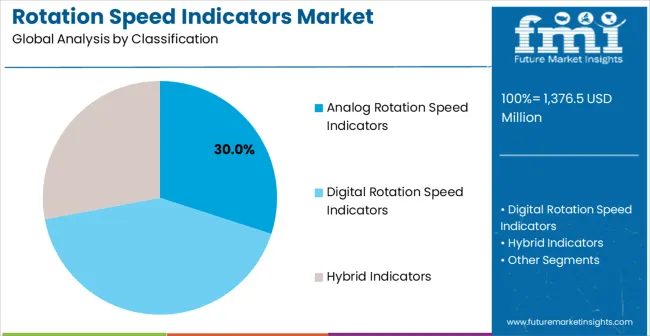
Analog rotation speed indicators hold roughly 30% of the indicator type segment. Industrial facilities and equipment operators increasingly utilize analog rotation speed indicators for their proven reliability, intuitive visual display, and cost-effective implementation in various monitoring applications. Analog indicator technology's established performance characteristics and consistent operational reliability directly address the industrial requirements for dependable speed monitoring and operational safety in diverse equipment applications.
This indicator type segment forms the foundation of traditional speed monitoring systems, as it represents the most established and widely adopted approach with proven reliability across multiple industrial applications and operating environments. Industrial investments in analog indicator systems and proven monitoring technologies continue to strengthen adoption among facility operators. With companies prioritizing reliability and cost-effectiveness, analog rotation speed indicators align with both operational requirements and budget considerations, making them the central component of comprehensive speed monitoring strategies.
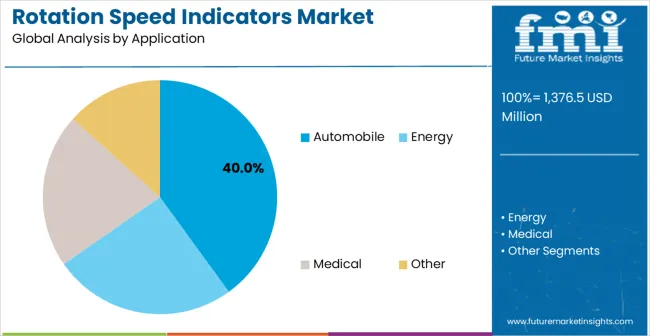
The automobile segment accounts for approximately 40% of the application market, making it the largest user of rotation speed indicators, underscoring their critical role as the primary industrial consumers of speed monitoring equipment for automotive engine systems, transmission applications, and vehicle performance monitoring. Automotive manufacturers prefer rotation speed indicators for their precision measurement capabilities, operational reliability, and ability to support vehicle safety and performance optimization systems. Positioned as essential components for modern automotive systems, rotation speed indicators offer both safety enhancement advantages and operational monitoring benefits.
The segment is supported by continuous advancement in automotive technology and the growing availability of specialized monitoring solutions that enable enhanced vehicle performance with improved safety systems and operational efficiency. Additionally, automotive manufacturers are investing in advanced monitoring technologies to support increasing performance requirements and safety regulations. As automotive systems become more complex and monitoring requirements increase, automobile applications will continue to dominate the end-user market while supporting advanced automotive technologies and vehicle performance optimization.
The rotation speed indicators market is advancing steadily due to increasing demand for precision monitoring equipment and growing adoption of predictive maintenance systems that provide enhanced operational safety and equipment reliability across diverse industrial applications. The market faces challenges, including competition from integrated monitoring systems, the complexity of digital technology integration, and the need for specialized installation and maintenance expertise. Innovation in digital technologies and wireless communication continues to influence product development and market expansion patterns.
The growing adoption of industrial automation and Industry 4.0 technologies is driving demand for rotation speed indicators that can support connected monitoring systems, provide real-time data transmission, and enable integration with comprehensive facility management platforms. Advanced automation systems require sophisticated monitoring capabilities while allowing more efficient operational management and predictive maintenance strategies across various industrial applications and equipment types. Manufacturers are increasingly recognizing the competitive advantages of automation-compatible monitoring equipment for industrial market expansion and technology leadership.
Modern rotation speed indicator producers are incorporating Internet of Things (IoT) technologies and wireless communication capabilities to enable remote monitoring, real-time data analytics, and enhanced operational intelligence for industrial and automotive applications. These technologies improve monitoring efficiency while enabling new applications, including remote facility management and automated alert systems. Advanced IoT integration also allows operators to support sophisticated monitoring strategies and operational optimization beyond traditional local indicator capabilities.
| Country | CAGR (2025-2035) |
|---|---|
| China | 7.8% |
| India | 7.3% |
| Germany | 6.7% |
| Brazil | 6.1% |
| USA | 5.5% |
| UK | 4.9% |
| Japan | 4.4% |
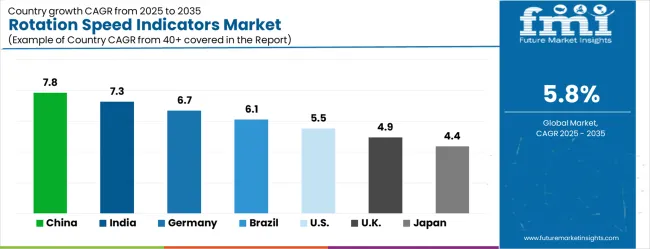
The rotation speed indicators market is experiencing strong growth globally, with China leading at a 7.8% CAGR through 2035, driven by the expanding manufacturing sector, growing industrial automation adoption, and significant investment in advanced monitoring technologies. India follows at 7.3%, supported by rapid industrialization, increasing manufacturing capabilities, and growing focus on operational efficiency and safety enhancement. Germany shows growth at 6.7%, prioritizing technological innovation and advanced industrial monitoring solutions. Brazil records 6.1%, focusing on industrial modernization and manufacturing sector expansion. The USA demonstrates 5.5% growth, driven by advanced manufacturing technology adoption and industrial automation initiatives. The UK exhibits 4.9% growth, supported by industrial modernization and advancements in monitoring systems. Japan shows 4.4% growth, prioritizing precision manufacturing and advanced monitoring technologies.
The report covers an in-depth analysis of 40+ countries; seven top-performing countries are highlighted below.
The rotation speed indicators market in China is projected to exhibit exceptional growth with a CAGR of 7.8% through 2035, driven by expanding manufacturing infrastructure and rapidly growing industrial automation adoption supported by government industrial modernization initiatives. The country's massive manufacturing sector and increasing investment in advanced monitoring technology are creating substantial demand for precision speed monitoring solutions. Major manufacturing companies and equipment producers are establishing comprehensive monitoring capabilities to serve both domestic and international markets.
The demand of rotation speed indicators in India is expanding at a CAGR of 7.3%, supported by the country's rapid industrialization, growing manufacturing capabilities, and increasing focus on operational efficiency and safety enhancement in industrial operations. The country's expanding industrial infrastructure and growing automation adoption are driving demand for advanced monitoring technologies. International monitoring equipment manufacturers and domestic distributors are establishing extensive distribution networks to address the growing demand for precision industrial components.
The rotation speed indicators Market in Germany is expanding at a CAGR of 6.7%, supported by the country's advanced manufacturing industry, strong focus on technological innovation, and robust demand for high-precision monitoring solutions among leading industrial and automotive manufacturers. The nation's established industrial sector and focus on engineering excellence are driving sophisticated monitoring capabilities throughout the manufacturing supply chain. Leading manufacturers are investing extensively in advanced monitoring equipment development and precision engineering methods to serve both domestic and export markets.
The rotation speed indicators market in Brazil is growing at a CAGR of 6.1%, driven by expanding industrial modernization programs, increasing manufacturing sector development, and growing investment in operational efficiency and safety enhancement. The country's growing industrial sector and modernization of manufacturing facilities are supporting demand for advanced monitoring solutions across major production regions. Industrial companies and manufacturing operators are establishing comprehensive monitoring capabilities to serve both domestic and export market requirements.
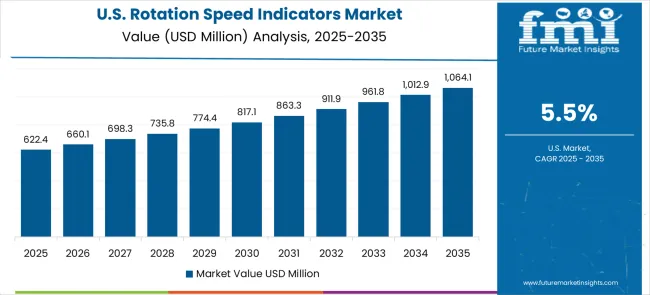
The rotation speed indicators market in the USA is expanding at a CAGR of 5.5%, supported by the country's advanced manufacturing technology adoption, established industrial infrastructure, and strong focus on operational efficiency enhancement and automation integration. The nation's mature industrial base and focus on manufacturing competitiveness are driving demand for advanced monitoring technologies that concentrate on precision and reliability performance. Manufacturers are investing in comprehensive monitoring solutions to serve both automotive and industrial markets with proven precision equipment.
The rotation speed indicators market in the UK is growing at a CAGR of 4.9%, driven by the country's industrial modernization initiatives, monitoring system advancement programs, and focus on operational efficiency and safety enhancement across industrial sectors. The UK's established manufacturing sector and focus on operational excellence are supporting investment in advanced monitoring technologies throughout major industrial centers. Leading manufacturers are establishing comprehensive monitoring capabilities to serve both automotive and industrial markets with reliable precision equipment.
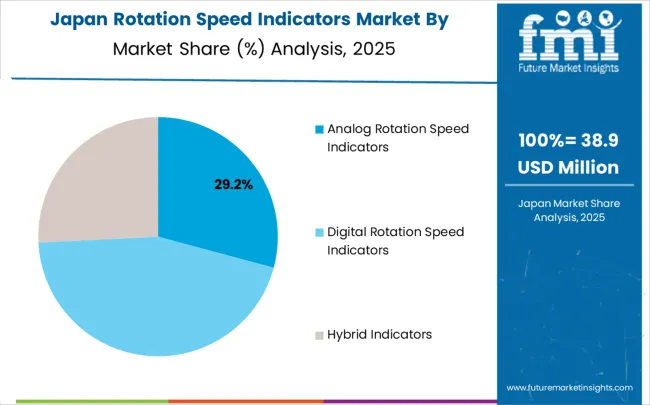
The rotation speed indicators market in Japan is expanding at a CAGR of 4.4%, supported by the country's focus on precision manufacturing, focus on advanced monitoring technology development, and strong preference for high-quality industrial equipment with superior performance characteristics. Japan's sophisticated manufacturing industry and focus on technological excellence are driving demand for advanced monitoring technologies, including precision-engineered indicators and automated systems. Leading manufacturers are investing in specialized capabilities to serve automotive, industrial, and machinery segments with premium monitoring solutions.
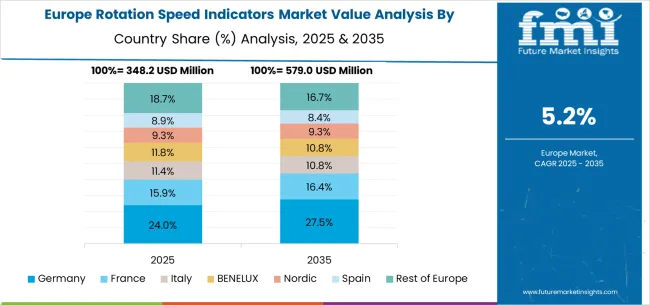
The rotation speed indicators market in Europe is projected to grow from USD 319.6 million in 2025 to USD 562.2 million by 2035, registering a CAGR of 5.8% over the forecast period. Germany is expected to maintain its leadership position with a 30.9% market share in 2025, moderating slightly to 30.6% by 2035, supported by its strong manufacturing industry, advanced monitoring technology capabilities, and comprehensive industrial automation networks serving major European markets.
The United Kingdom follows with a 22.4% share in 2025, projected to reach 22.6% by 2035, driven by robust industrial modernization initiatives, an established manufacturing sector, and strong demand for advanced monitoring solutions across automotive and industrial applications. France holds an 18.1% share in 2025, rising to 18.3% by 2035, supported by manufacturing sector development and increasing adoption of precision monitoring technologies in industrial operations. Italy records 12.7% in 2025, inching to 12.8% by 2035, with growth underpinned by manufacturing sector modernization and increasing focus on operational efficiency in industrial facilities. Spain contributes 9.3% in 2025, moving to 9.4% by 2035, supported by expanding industrial activities and manufacturing development programs. The Netherlands maintains a 2.9% share in 2025, growing to 3.0% by 2035. The Rest of Europe region, including Nordic countries, Eastern Europe, Belgium, Switzerland, and Austria, is anticipated to gain momentum, expanding its collective share from 3.7% to 3.3% by 2035, attributed to increasing adoption of advanced manufacturing technologies in Nordic countries and growing industrial activities across Eastern European markets implementing modernization programs.
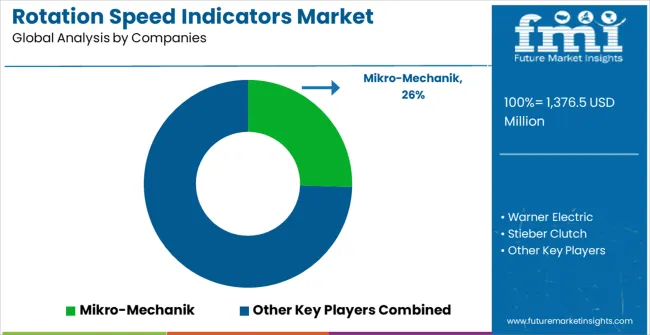
The rotation speed indicators market is characterized by competition among established industrial equipment manufacturers, specialized monitoring system providers, and integrated automation solution companies. Companies are investing in advanced sensor technology research, digital display enhancement, wireless communication capabilities, and comprehensive product portfolios to deliver consistent, high-performance, and reliable monitoring solutions. Innovation in sensor technologies, digital integration, and connectivity features is central to strengthening market position and competitive advantage.
Mikro-Mechanik leads the market with a strong market share, offering comprehensive monitoring solutions with a focus on precision engineering and industrial application expertise. Warner Electric provides specialized monitoring equipment with an focus on power transmission and industrial automation applications. Stieber Clutch delivers innovative monitoring technologies with a focus on mechanical power transmission and industrial systems. Eaton Corporation specializes in comprehensive industrial solutions with a focus on monitoring and control systems. Nexen Group, Inc. focuses on precision mechanical components and monitoring solutions for demanding applications. Ogura Clutch offers specialized monitoring equipment with focus on electromagnetic and mechanical systems.
Rotation speed indicators serve as critical monitoring components across industrial automation, automotive systems, and energy applications, enabling precise rotational measurement for operational safety and predictive maintenance. With the global market projected to grow from USD 1,376.5 million in 2025 to USD 2,419.0 million by 2035 at a 5.8% CAGR, these monitoring devices are essential for Industry 4.0 implementation and smart manufacturing initiatives. Accelerating market growth requires coordinated action across industrial standards bodies, equipment manufacturers, technology integrators, sensor developers, and capital providers to drive innovation and adoption.
Industrial Modernization Incentives: Establish tax credits and grants for manufacturers upgrading to predictive maintenance systems that include advanced rotation speed monitoring. Create equipment depreciation schedules that favor investments in connected monitoring technologies and Industry 4.0-compatible instrumentation systems.
Manufacturing Competitiveness Programs: Fund technology adoption initiatives that help small and medium manufacturers implement monitoring systems for operational efficiency gains. Provide matching grants for equipment upgrades that demonstrate measurable improvements in safety compliance, energy efficiency, and predictive maintenance capabilities.
Safety and Compliance Standards: Develop mandatory monitoring requirements for critical rotating equipment in automotive manufacturing, energy production, and industrial facilities. Establish inspection protocols that verify proper speed monitoring implementation and maintenance documentation for safety-critical applications.
Research and Development Support: Finance university-industry partnerships focused on next-generation sensor technologies, wireless communication protocols, and IoT integration for industrial monitoring systems. Support the development of open-source monitoring platforms that enable smaller manufacturers to access advanced capabilities.
Digital Infrastructure Investment: Expand industrial broadband networks and 5G coverage to enable real-time monitoring and data transmission from manufacturing facilities. Create shared data platforms that allow manufacturers to benchmark equipment performance and access predictive analytics services.
Technical Standards Development: Establish universal protocols for rotation speed measurement accuracy, calibration procedures, and data communication interfaces across different equipment types. Create interoperability standards that ensure monitoring systems can integrate with diverse automation platforms and maintenance management systems.
Safety and Certification Programs: Develop comprehensive certification frameworks for rotation speed indicators used in safety-critical applications, including automotive systems, energy generation, and hazardous environments. Create testing protocols that validate long-term reliability and performance under extreme operating conditions.
Best Practices Documentation: Publish implementation guides covering optimal sensor placement, calibration intervals, and maintenance procedures for different industrial applications. Create case study databases demonstrating successful predictive maintenance programs enabled by rotation speed monitoring.
Training and Workforce Development: Design certification programs for maintenance technicians and automation engineers covering advanced monitoring system installation, calibration, and troubleshooting. Develop online training modules that keep professionals current with evolving sensor technologies and data analytics capabilities.
Market Intelligence and Benchmarking: Coordinate industry surveys that track adoption rates, performance metrics, and return-on-investment data for different monitoring implementations. Provide comparative analysis tools that help manufacturers select appropriate monitoring solutions based on application requirements.
IoT Integration and Connectivity: Develop sensors with built-in wireless communication capabilities, edge computing processors, and cloud connectivity for real-time data transmission and remote monitoring. Create modular sensor architectures that can be easily integrated into existing equipment without extensive retrofitting.
Artificial Intelligence and Analytics: Incorporate machine learning algorithms that can predict equipment failures, optimize maintenance schedules, and provide actionable insights from rotation speed data patterns. Develop automated alert systems that can distinguish between normal variations and potential failure indicators.
Digital Twin Integration: Provide software platforms that create virtual models of rotating equipment, enabling simulation-based maintenance planning and performance optimization. Develop APIs that will allow the integration of monitoring data with enterprise asset management and manufacturing execution systems.
Ruggedization and Reliability: Engineer sensors that can operate reliably in harsh industrial environments, including extreme temperatures, vibration, chemical exposure, and electromagnetic interference. Create self-diagnosing sensors that can detect their own calibration drift and communication issues.
User Interface and Visualization: Develop intuitive dashboard systems that present complex monitoring data in actionable formats for different user types, from maintenance technicians to plant managers. Create mobile applications that enable remote monitoring and alert management for critical equipment.
Embedded Monitoring Solutions: Integrate rotation speed indicators directly into new equipment designs, providing plug-and-play monitoring capabilities that reduce installation complexity and improve reliability. Develop retrofit kits for existing equipment that minimize downtime during installation.
Predictive Maintenance Services: Offer comprehensive monitoring services that combine hardware installation with ongoing data analysis, maintenance recommendations, and performance optimization consulting. Create service contracts that guarantee equipment uptime and maintenance cost reductions.
Application-Specific Solutions: Develop specialized monitoring systems optimized for specific industries, including automotive manufacturing lines, wind energy systems, and medical device production. Create modular configurations that can be customized based on unique operational requirements.
Training and Support Infrastructure: Establish technical support centers that provide rapid response for monitoring system issues, calibration services, and performance troubleshooting. Develop comprehensive documentation and video training resources that enable effective system utilization.
Data Integration and Analytics: Provide software platforms that can aggregate monitoring data from multiple equipment types and locations, enabling facility-wide performance optimization and maintenance planning. Create reporting tools that demonstrate return on investment and operational improvements.
Implementation and Validation: Deploy comprehensive monitoring systems across critical equipment and document performance improvements, maintenance cost reductions, and safety enhancements. Share success stories and lessons learned with industry associations and peer organizations.
Performance Requirements Definition: Work with suppliers to define specific monitoring requirements based on actual operational conditions and maintenance objectives. Provide feedback on sensor performance, installation challenges, and desired feature enhancements.
Maintenance Strategy Evolution: Transition from reactive to predictive maintenance approaches using rotation speed data as a foundation for condition-based maintenance programs. Develop maintenance protocols that optimize equipment life while minimizing unplanned downtime.
Workforce Development and Training: Train maintenance personnel and operators on effective monitoring system utilization, data interpretation, and troubleshooting procedures. Create internal expertise that can support ongoing system optimization and expansion.
Cross-Industry Collaboration: Participate in industry benchmarking studies and share anonymized performance data to advance collective understanding of monitoring system effectiveness and best practices.
Technology Innovation Investment: Fund startups developing breakthrough sensor technologies, including wireless power systems, advanced materials, and AI-powered analytics platforms. Support companies creating novel monitoring solutions for emerging applications like electric vehicle systems and renewable energy equipment.
Manufacturing Scale-up Capital: Provide growth funding for sensor manufacturers expanding production capacity to meet increasing global demand. Finance automation initiatives that improve manufacturing quality and reduce sensor costs while maintaining performance specifications.
Digital Platform Development: Invest in software companies creating comprehensive monitoring and analytics platforms that can serve multiple industrial sectors. Support the development of cloud-based services that make advanced analytics accessible to smaller manufacturers.
Market Expansion Financing: Fund distribution network development and technical support infrastructure expansion, particularly in high-growth emerging markets with developing industrial sectors. Support localization initiatives that adapt monitoring solutions for regional requirements and standards.
Acquisition and Consolidation: Finance strategic acquisitions that combine sensor hardware capabilities with software analytics expertise, creating comprehensive monitoring solution providers. Support market consolidation that can achieve economies of scale while maintaining innovation capabilities.
Impact and Sustainability Investment: Deploy capital toward monitoring solutions that demonstrably reduce energy consumption, extend equipment life, and minimize industrial waste through improved operational efficiency. Support initiatives that advance manufacturing sustainability while generating attractive financial returns.
| Items | Values |
|---|---|
| Quantitative Units (2025) | USD 1,376.5 Million |
| Indicator Type | Analog Rotation Speed Indicators, Digital Rotation Speed Indicators, Hybrid Indicators |
| Application | Automobile, Energy, Medical |
| Regions Covered | North America, Europe, East Asia, South Asia & Pacific, Latin America, Middle East & Africa |
| Countries Covered | United States, Canada, United Kingdom, Germany, France, China, Japan, South Korea, India, Brazil, Australia and 40+ countries |
| Key Companies Profiled | Mikro-Mechanik, Warner Electric, Stieber Clutch, Eaton Corporation, Nexen Group, Inc., and Ogura Clutch |
| Additional Attributes | Dollar sales by indicator type and application category, regional demand trends, competitive landscape, technological advancements in monitoring systems, sensor innovation, digital integration development, and connectivity enhancement |
The global rotation speed indicators market is estimated to be valued at USD 1,376.5 million in 2025.
The market size for the rotation speed indicators market is projected to reach USD 2,419.0 million by 2035.
The rotation speed indicators market is expected to grow at a 5.8% CAGR between 2025 and 2035.
The key product types in rotation speed indicators market are analog rotation speed indicators, digital rotation speed indicators and hybrid indicators.
In terms of application, automobile segment to command 40.0% share in the rotation speed indicators market in 2025.


Our Research Products

The "Full Research Suite" delivers actionable market intel, deep dives on markets or technologies, so clients act faster, cut risk, and unlock growth.

The Leaderboard benchmarks and ranks top vendors, classifying them as Established Leaders, Leading Challengers, or Disruptors & Challengers.

Locates where complements amplify value and substitutes erode it, forecasting net impact by horizon

We deliver granular, decision-grade intel: market sizing, 5-year forecasts, pricing, adoption, usage, revenue, and operational KPIs—plus competitor tracking, regulation, and value chains—across 60 countries broadly.

Spot the shifts before they hit your P&L. We track inflection points, adoption curves, pricing moves, and ecosystem plays to show where demand is heading, why it is changing, and what to do next across high-growth markets and disruptive tech

Real-time reads of user behavior. We track shifting priorities, perceptions of today’s and next-gen services, and provider experience, then pace how fast tech moves from trial to adoption, blending buyer, consumer, and channel inputs with social signals (#WhySwitch, #UX).

Partner with our analyst team to build a custom report designed around your business priorities. From analysing market trends to assessing competitors or crafting bespoke datasets, we tailor insights to your needs.
Supplier Intelligence
Discovery & Profiling
Capacity & Footprint
Performance & Risk
Compliance & Governance
Commercial Readiness
Who Supplies Whom
Scorecards & Shortlists
Playbooks & Docs
Category Intelligence
Definition & Scope
Demand & Use Cases
Cost Drivers
Market Structure
Supply Chain Map
Trade & Policy
Operating Norms
Deliverables
Buyer Intelligence
Account Basics
Spend & Scope
Procurement Model
Vendor Requirements
Terms & Policies
Entry Strategy
Pain Points & Triggers
Outputs
Pricing Analysis
Benchmarks
Trends
Should-Cost
Indexation
Landed Cost
Commercial Terms
Deliverables
Brand Analysis
Positioning & Value Prop
Share & Presence
Customer Evidence
Go-to-Market
Digital & Reputation
Compliance & Trust
KPIs & Gaps
Outputs
Full Research Suite comprises of:
Market outlook & trends analysis
Interviews & case studies
Strategic recommendations
Vendor profiles & capabilities analysis
5-year forecasts
8 regions and 60+ country-level data splits
Market segment data splits
12 months of continuous data updates
DELIVERED AS:
PDF EXCEL ONLINE
Rotational Molding Machine Market Size and Share Forecast Outlook 2025 to 2035
Competitive Overview of Rotational Molding Machine Market Share
Speed Gate Market Growth – Trends & Forecast 2025 to 2035
Low Speed Vehicle (LSV) Market Trends – Growth & Forecast 2024-2034
High Speed Rolling Bearings Market Size and Share Forecast Outlook 2025 to 2035
High-Speed Steel Metal Cutting Tools Market Size and Share Forecast Outlook 2025 to 2035
Slow Speed Shredding Machines Market Size and Share Forecast Outlook 2025 to 2035
High Speed Blowers Market Size and Share Forecast Outlook 2025 to 2035
Road Speed Limiter Market Analysis - Size, Share, and Forecast Outlook 2025 to 2035
High-Speed Interconnects Market by Type by Application & Region Forecast till 2035
High Speed Steel (HSS) Tools Market Growth - Trends & Forecast 2025 to 2035
High-speed Engine Market Growth – Trends & Forecast 2024-2034
Wind Speed Alarm Market
High Speed Data Converters Market
Radar Speed Displays Market Forecast Outlook 2025 to 2035
Music Speed Changer Market Size and Share Forecast Outlook 2025 to 2035
Vehicle Speed Monitoring System Market Growth - Trends & Forecast 2025 to 2035
Digital Speedometer Market Growth – Trends & Forecast 2024-2034
Variable Speed Generators Market Analysis & Forecast by Technology, End Use and Region through 2035
Electronic Speed Controller (ESC) for Drones and UAVs Market Size and Share Forecast Outlook 2025 to 2035

Thank you!
You will receive an email from our Business Development Manager. Please be sure to check your SPAM/JUNK folder too.
Chat With
MaRIA