

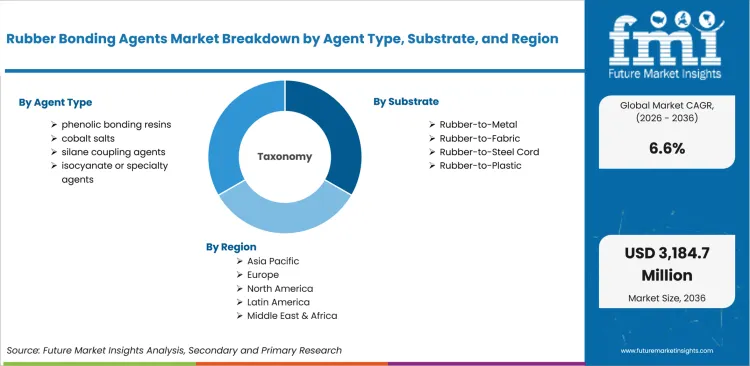
- Market Size (2026)
- USD 1680.7 Mn
- Forecast (2036)
- USD 3184.7 Mn
- CAGR (2026 to 2036)
- 6.6%
How big is the Rubber Bonding Agents Market in 2026?
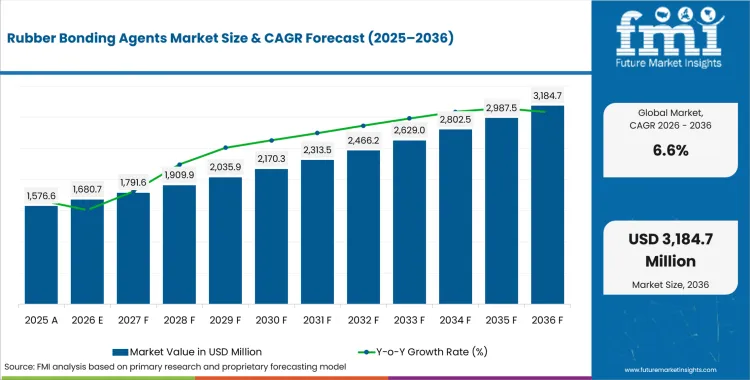
USD 1,680.7 million in 2026 and USD 3,184.7 million by 2036 at a 6.6% CAGR.
Demand for rubber bonding agents is projected to expand at 6.6% CAGR between 2026 and 2036, increasing valuation from USD 1,680.7 million in 2026 to USD 3,184.7 million by 2036. Rubber bonding agents are moving from routine adhesive inputs into qualification tools used to protect molded part performance and production repeatability. Compounders evaluate cure behavior and substrate compatibility before products enter repeat production. OICA reported global vehicle production at 96.4 million units in 2025, influencing adhesive use across tires and vibration-control parts.
Germany accounts are anticipated to place bonding trials under tighter review for rubber-to-metal durability. India accounts are forecasted to progress considerably, driven by tire output gains and molded rubber part expansion. Tire and molded rubber operations need bonding systems connecting adhesion strength with factory acceptance and service-life requirements. USTMA projected total USA tire shipments of 338.9 million units in 2026, highlighting why tire-linked rubber bonding programs need stable supply and technical support. Demand also connects with industrial adhesives as buyers compare process speed and substrate performance.
Buyers compare rubber bonding agents based on plant trials and support ownership across approved suppliers. BLS data placed the adhesives and sealants producer price index at 382.379 in May 2026, showing cost pressure across bonding inputs used by industrial buyers. Commercial approval rests on bonding proof being able to hold across rubber formulation changes and line-level production checks.
| Metric | Value |
|---|---|
| 2025 Market Size | USD 1,576.6 million |
| 2026 Market Size | USD 1,680.7 million |
| 2036 Market Size | USD 3,184.7 million |
| Forecast CAGR (2026-2036) | 6.6% |
| Sales Channel Focus | Direct Chemical Supply |
| Direct Chemical Supply Share (2026) | 58.5% |
| End Use Focus | Automotive |
| Automotive Share (2026) | 44.0% |
| Agent Type Focus | Phenolic Bonding Resins |
| Phenolic Bonding Resins Share (2026) | 38.0% |
Summary of the Rubber Bonding Agents Market
| Market Signal | Commercial Impact |
|---|---|
| Demand and Growth Drivers | Demand for rubber bonding agents is increasing as compounders and converters connect bonding performance with part quality and production control.
|
| Product and Segment View | Segment demand is led by direct supply support and automotive use requiring validated application behavior.
|
| Geography and Growth Outlook | Country demand is stronger across automotive systems with tire production depth and rubber component export activity.
|
| Competitive Landscape | Competition focuses on adhesive chemistry depth and application-ready technical support.
|
| Analyst Perspective | Rubber bonding agents are developing into a qualification-led segment linked to part reliability and production repeatability.
|
How is the rubber bonding agents market segmented?
The rubber bonding agents industry is segmented by agent type, substrate, application, end use, sales channel and region.
The rubber bonding agents are segmented by agent type, substrate, application, end use, sales channel and region. By agent type, coverage includes phenolic bonding resins, cobalt salts, silane coupling agents and isocyanate or specialty agents. By substrate, coverage includes rubber-to-metal, rubber-to-fabric, rubber-to-steel cord and rubber-to-plastic. By application, coverage includes tires, hoses, belts and vibration-control parts. By end use, coverage includes automotive, industrial rubber, construction or mining and consumer goods. By sales channel, coverage includes direct chemical supply, distributors and compounder bundled supply, with regional coverage across North America, Latin America, Europe, East Asia, South Asia and Pacific and the Middle East and Africa.
How does direct chemical supply influence buying within the sales channel segment?
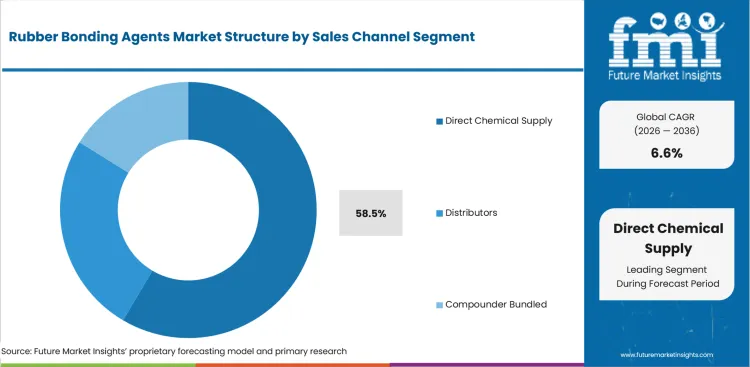
Direct chemical supply leads rubber bonding agent buying due to trial support and qualification control. Large accounts use direct supplier contact to review cure conditions and part-failure responses before wider plant use. USTMA projected USA tire shipments of 337.4 million units in 2025, giving tire and rubber suppliers a large demand base for approved bonding programs.
- Direct chemical supply is expected to account for 58.5% share in 2026, backed by demand for supplier support during product trials and line approval. Buyers prefer direct routes connecting technical questions with account-level responsibility.
- Distributors and compounder bundled supply remain useful for reach and replenishment across smaller accounts. Direct supply gains selection attention once buyers require faster troubleshooting and documented performance support during production.
Where does automotive create value within the end use segment?
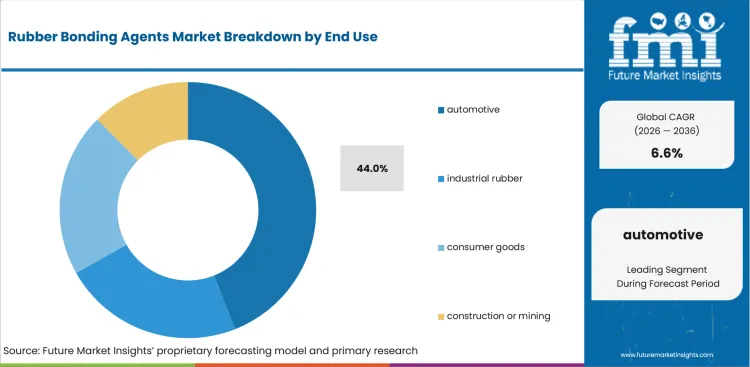
Automotive influences demand for rubber bonding agents based on mounts and vibration-control components. Component suppliers use bonding agents in parts exposed to motion and repeated stress across vehicle platforms. OICA reported global vehicle sales climbed to 99.8 million units in 2025, showing a large mobility base for rubber components requiring controlled bonding. Demand also intersects with automotive adhesives & sealants as mobility buyers review material bonding across assemblies.
- Automotive is expected to represent 44.0% share in 2026, driven by recurring use in hoses and vibration-control parts. Additive and adhesive suppliers gain commercial access once trials connect product use with part durability and production reliability.
- Industrial rubber and construction or mining programs use more targeted bonding strategies. Automotive operations often need tighter approval support as warranty exposure and platform validation affect supplier selection.
What keeps phenolic bonding resins important within the agent type segment?
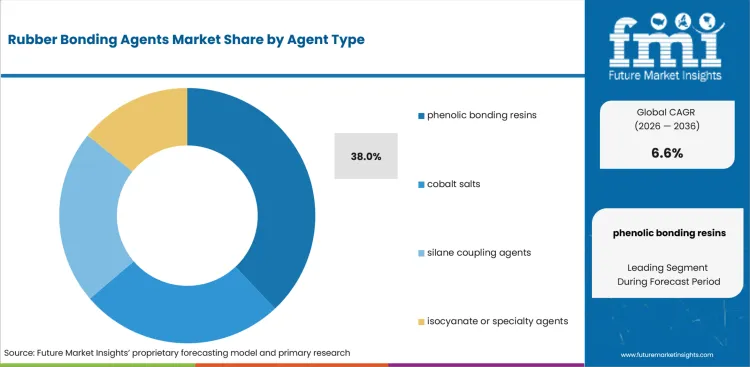
Phenolic bonding resins guide agent type decisions due to established use in rubber-to-metal and reinforced rubber applications. Buyers use resin-based systems in programs requiring bond strength under heat, stress and chemical exposure. BLS placed the plastics material and resin manufacturing primary products index at 342.543 in May 2026, increasing buyer attention on resin selection and formulation efficiency.
- Phenolic bonding resins are projected to capture 38.0% share in 2026, guided by rubber part makers needing consistent adhesion during repeated production cycles. Buyers assess these systems depending on surface preparation and supplier follow-up.
- Silane coupling agents and specialty agents remain close evaluation areas. Phenolic systems gain attention once technical teams link bonding reliability with fewer process corrections and better specification control.
How should buyers read rubber-to-metal demand within the substrate segment?
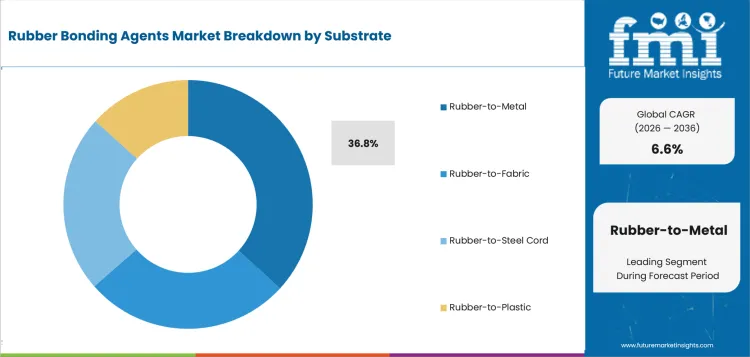
Rubber-to-metal demand is central to bushings and vibration-control parts. Supplier files are required to explain metal preparation and rubber compound behavior before buyers approve repeat use. H. B. Fuller noted in 2024, typical adhesives are applied at 2-to-3-millimeter thickness during bonding, while CILBOND is applied in microns to help create a stronger substrate connection.
- Rubber-to-Metal is expected to capture 36.8% share in 2026, influenced by demand for stable adhesion in mounts and molded rubber parts. Buyers prefer bonding systems being able to withstand repeated stress without avoidable field failure.
- Rubber-to-fabric and rubber-to-steel cord applications remain important in belts and tires. Rubber-to-metal gains stronger technical review as substrate preparation and curing discipline directly affect final part performance.
Why do tires guide application decisions?
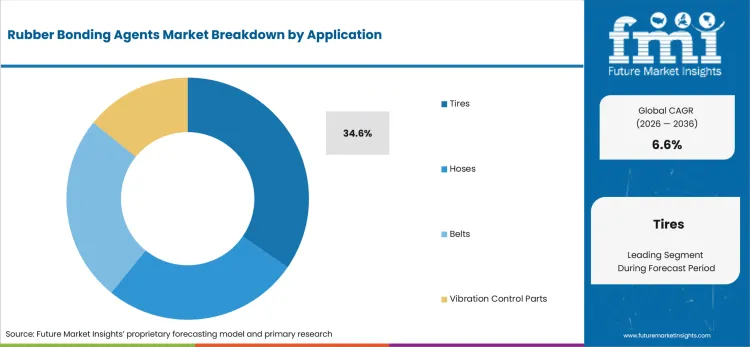
Tires guide application demand as bonding agents support reinforcement and compound integration. Tire producers assess adhesive behavior across cord adhesion and repeated stress during service. Tyres Europe reported consumer replacement tire sales increased 8% in the second half of 2024, followed by recovery in the first quarter of 2025.
- Tires are projected to account for 34.6% share in 2026, aided by bonding needs across reinforcement and tire construction. Suppliers gain approval once product evidence supports consistent adhesion across production batches.
- Hoses and vibration-control parts remain important applications for rubber bonding agents. Tire use attracts added review as production volume and performance liability make adhesive selection more controlled.
What are the drivers, restraints, and opportunities in the rubber bonding agents market?
Near-term purchases are shaped by bonding validation and application-specific support outlined below.
- Driver: Vehicle production and tire replacement activity increase demand for bonding agents promoting repeatable rubber part performance. Automotive and tire buyers need products reducing process uncertainty during curing and approved part production.
- Restraint: Raw-material volatility and qualification cycles can slow adoption if suppliers cannot support application evidence. Buyers may delay supplier changes if service ownership or line-trial results are incomplete.
- Opportunity: EV tires and compound reformulation create room for bonding agents suited to higher torque and vibration-control requirements. Suppliers with water-based and one-coat systems are expected to support users seeking fewer process steps and clearer handling controls.
Rubber bonding agent demand rises as buyers treat adhesives as production-control tools. Automotive systems must protect part performance and support supplier documentation. OICA reported China produced 34.53 million vehicles in 2025, providing a large base for rubber-to-metal and molded component bonding programs.
Buyer pressure is higher in rubber operations are required to manage chemical cost movement and maintain predictable production records. BLS data placed the synthetic rubber producer price index at 304.518 in May 2026, highlighting why rubber producers need adhesive systems reducing scrap and avoid repeat-batch correction.
Implementation risk remains a practical constraint for bonding programs. Technical and plant operations teams need shared success measures before wider adoption. IEA reported electric car sales exceeded 20 million units in 2025, equal to 25% of new car sales, reflecting why EV-linked tires and vibration-control parts create opportunity for bonding systems suited to changing vehicle requirements.
Which country CAGRs are profiled in the Rubber Bonding Agents Market?
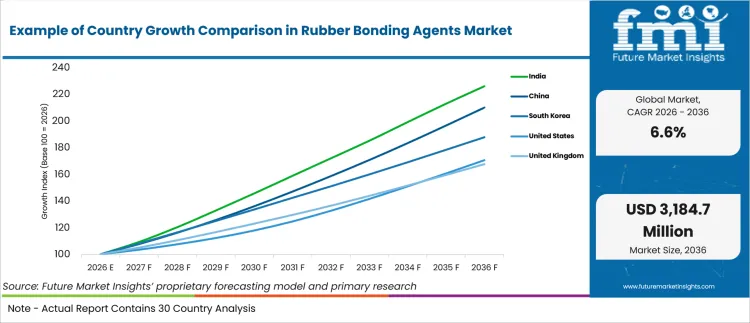
| Country | CAGR |
|---|---|
| India | 8.5% |
| China | 7.7% |
| South Korea | 6.5% |
| United States | 5.5% |
| United Kingdom | 5.3% |
| Japan | 5.1% |
| Germany | 5.0% |
Source: Future Market Insights analysis, 2026.
How do country-level CAGRs compare in the Rubber Bonding Agents Market?
Country demand in rubber bonding agents is expected to be led by tire replacement and technical rubber component activity. India and China connect additive demand with vehicle output and expanding rubber part production. South Korea, United States, United Kingdom, Japan and Germany connect adoption with documentation and tighter qualification control. Senior buyers assess which countries can connect supplier evidence with repeatable bonding outcomes.
- India is projected to post 8.46% CAGR from 2026 to 2036, driven by vehicle production and component localization. OICA reported India produced 6.49 million vehicles in 2025, providing bonding agent suppliers a large base for tires and molded rubber parts.
- China is forecast to grow at 7.66% CAGR from 2026 to 2036, influenced by automotive scale and electric vehicle output. OICA reported new-energy vehicle production reached 16.626 million units in 2025, supporting demand for tire and vibration-control bonding systems.
- South Korea is projected to record 6.47% CAGR through 2036, reflected by export-oriented automotive components and compact supplier networks. MOTIR reported automobile exports of USD 5.83 billion in May 2026 and production of 330,000 units, keeping rubber component suppliers focused on reliable bonding materials.
- United States is forecast to register 5.47% CAGR by 2036, shaped by tire replacement volume and industrial rubber demand. USTMA projected USA tire shipments at 338.9 million units in 2026, supporting continued use of bonding agents in tire and rubber goods channels.
- United Kingdom is anticipated to grow at 5.27% CAGR by 2036, aided by specialist rubber goods and imported material management. SMMT reported more than 717,371 cars, 47,344 commercial vehicles and 1.60 million engines were built in the UK in 2025, maintaining a practical base for bonding agent suppliers.
- Japan is expected to post 5.11% CAGR through 2036, guided by quality expectations and longer approval cycles. OICA reported Japan produced 8.41 million vehicles in 2025, giving adhesive suppliers a stable automotive base for seals and vibration-control parts.
- Germany is projected to grow at 5.07% CAGR by 2036, underpinned by engineering standards and automotive part approval discipline. VDA reported Germany produced 1.67 million electric passenger cars in 2025 and reached a 40% electric share in domestic passenger car production, supporting rubber bonding demand in EV parts and tire systems.
Who are the notable companies in the Rubber Bonding Agents Market?
Parker LORD, Henkel, H. B. Fuller, 3M, Dow, Eastman, Arkema, Bostik, Sika and Wacker Chemie are notable companies influencing rubber bonding agents and adjacent industrial bonding pathways.
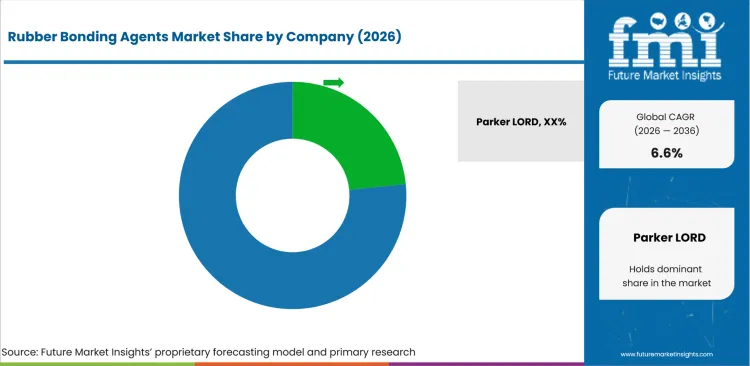
Competition in rubber bonding agents is grouped by how buyers want adhesive proof to work. Parker LORD and H. B. Fuller are stronger in direct rubber bonding products and application support. Henkel, 3M and Dow are important for industrial adhesive breadth and manufacturing relationships. Eastman, Arkema and Bostik strengthen competition led by specialty chemistry and adhesive portfolio activity. Sika and Wacker Chemie support users requiring elastomer service continuity.
- Parker LORD has an advantage driven by Chemlok rubber bonding systems and customer training support. Buyers can connect supplier support with substrate preparation and failure review.
- H. B. Fuller supports buyer review based on CILBOND rubber bonding technologies and application guidance. Its 2024 rubber-to-substrate guidance gives technical teams a clearer route for process review.
- Henkel, 3M and Dow strengthen competition due to industrial adhesive portfolios and manufacturing customer access. Buyers use such capabilities as part performance and chemical compatibility affect commercial outcomes.
- Eastman, Arkema, Bostik, Sika and Wacker Chemie compete based on specialty chemistry reach and regional service continuity. Buyers compare these companies depending on technical evidence and supply support.
Competitive Benchmarking: Rubber Bonding Agents Market
| Company | Material Portfolio Fit | Technical Documentation | Application Support | Geographic Reach |
|---|---|---|---|---|
| Parker LORD | High | High | High | Global |
| Henkel | High | Medium | High | Global |
| H. B. Fuller | Strong | High | Medium | Global or regional |
| 3M | Medium | High | Medium | Regional |
| Dow | Strong | Medium | Medium | Regional or global |
| Eastman | High | High | High | Global |
| Arkema | High | Medium | High | Global |
| Bostik | Strong | High | Medium | Global or regional |
| Sika | Medium | High | Medium | Regional |
| Wacker Chemie | Strong | Medium | Medium | Regional or global |
Source: Future Market Insights competitive analysis, 2026.
Key Developments in the Rubber Bonding Agents Market
- In March 2025, Parker LORD listed Chemlok Academy under rubber bonding solutions to support customer training around bonding systems. Training support helps users reduce errors during substrate preparation and bonding review.
- In September 2024, H. B. Fuller detailed rubber-to-substrate bonding guidance covering performance and resilience in industrial parts. Guidance supports buyers reviewing rubber-to-metal and mixed-substrate bonding programs.
- In December 2024, Arkema finalized the acquisition of Dow’s flexible packaging laminating adhesives business. Acquisition added adhesive portfolio depth through annual sales of around USD 250 million and five production sites.
Key Players in the Rubber Bonding Agents Market
Rubber bonding adhesive suppliers
- Parker LORD
- Henkel
- H. B. Fuller
- 3M
Specialty chemistry suppliers
- Dow
- Eastman
- Arkema
- Bostik
Elastomer service suppliers
- Sika
- Wacker Chemie
Rubber Bonding Agents Market - Report Scope
| Coverage field | Report scope |
|---|---|
| Market breakdown | Rubber bonding agents market breakdown by agent type, substrate, application, end use, sales channel and region |
| Market Definition | Adhesive and bonding agent systems used to bond rubber with metal, fabric, steel cord and plastic substrates across tires, hoses, belts and vibration-control parts |
| Regions Covered | North America, Latin America, Europe, East Asia, South Asia and Pacific, Middle East and Africa |
| Countries Covered | United States, China, India, Germany, United Kingdom, Japan, South Korea and 30+ countries |
| Key Companies Profiled | Parker LORD, Henkel, H. B. Fuller, 3M, Dow, Eastman, Arkema, Bostik, Sika, Wacker Chemie |
| Forecast Period | 2026 to 2036 |
| Approach | Hybrid bottom-up and top-down methodology using bonding agent use, substrate demand, automotive output, supplier portfolios, sales-channel structure and country-level indicators |
Source: Future Market Insights analysis, 2026.
Rubber Bonding Agents Market - Research Methodology
| Method | Approach |
|---|---|
| Primary Research | FMI analysts reviewed inputs from compounders, converters, OEM buyers, formulators, rubber goods producers, adhesive suppliers and technical sourcing teams. Discussions focused on product use, adoption barriers, qualification support and measurable operating value. |
| Desk Research | Desk research covered official automotive sources, tire industry bodies, company releases, product information, chemical price datasets and public safety guidance. Product coverage was checked against agent type, substrate, application, end use, sales-channel route and commercial use. |
| Market Sizing and Forecasting | Model inputs combined 2026 baseline value, bonding agent use intensity, substrate adoption, application demand, supplier reach, channel structure and country CAGR assumptions. Forecast logic was adjusted for automotive output, tire replacement demand and technical service needs. |
| Data Validation | Forecasts were checked against vehicle production signals, tire shipment indicators, company portfolio activity and supplier qualification patterns. Company portfolios were reviewed to avoid counting adjacent products without direct rubber bonding agent use. |
Rubber Bonding Agents Market by Segments
Rubber Bonding Agents Market segmented by Agent Type:
- Phenolic Bonding Resins
- Cobalt Salts
- Silane Coupling Agents
- Isocyanate / Specialty Agents
Rubber Bonding Agents Market segmented by Substrate:
- Rubber-to-Metal
- Rubber-to-Fabric
- Rubber-to-Steel Cord
- Rubber-to-Plastic
Rubber Bonding Agents Market segmented by Application:
- Tires
- Hoses
- Belts
- Vibration Control Parts
Rubber Bonding Agents Market segmented by End Use:
- Automotive
- Industrial Rubber
- Construction / Mining
- Consumer Goods
Rubber Bonding Agents Market segmented by Sales Channel:
- Direct Chemical Supply
- Distributors
- Compounder Bundled
Rubber Bonding Agents Market by Region:
- North America
- United States
- Canada
- Mexico
- Latin America
- Brazil
- Chile
- Rest of Latin America
- Western Europe
- Germany
- United Kingdom
- Italy
- Spain
- France
- Nordic
- BENELUX
- Rest of Western Europe
- Eastern Europe
- Poland
- Hungary
- Balkan and Baltic
- Rest of Eastern Europe
- East Asia
- China
- Japan
- South Korea
- South Asia and Pacific
- India
- ASEAN
- Australia and New Zealand
- Rest of South Asia and Pacific
- Middle East and Africa
- Kingdom of Saudi Arabia
- Other GCC Countries
- Turkiye
- South Africa
- Other African Union
- Rest of Middle East and Africa
Research Sources and Bibliography
- Arkema. (2024, December 2). Arkema finalizes the acquisition of Dow’s flexible packaging laminating adhesives business. Arkema.
- European Tyre and Rubber Manufacturers’ Association. (2025, May 8). First quarter replacement sales: Consumer tyre growth continues. Tyres Europe.
- H. B. Fuller. (2024, September 25). Overcoming challenges in rubber-to-substrate bonding. H. B. Fuller.
- H. B. Fuller. (2024, October 3). Simplifying complex bonds: How rubber-to-metal adhesives make it possible. H. B. Fuller.
- International Energy Agency. (2026, May 20). Global EV Outlook 2026: Trends in electric cars. International Energy Agency.
- International Organization of Motor Vehicle Manufacturers. (2026, April 23). Auto industry growth shifted east in 2025 amid global repositioning. International Organization of Motor Vehicle Manufacturers.
- Ministry of Trade, Industry and Resources. (2026, June 17). May 2026 automobile exports total USD 5.83 billion. Ministry of Trade, Industry and Resources.
- Parker Hannifin. (2025, March 5). Rubber bonding solutions. Parker Hannifin.
- Society of Motor Manufacturers and Traders. (2026, February 20). SMMT motor industry facts 2026. Society of Motor Manufacturers and Traders.
- USA Bureau of Labor Statistics. (2026, June 11). Producer Price Index by commodity: Chemicals and allied products: Adhesives and sealants. USA Bureau of Labor Statistics.
- USA Bureau of Labor Statistics. (2026, June 11). Producer Price Index by industry: Plastics material and resin manufacturing: Primary products. USA Bureau of Labor Statistics.
- USA Bureau of Labor Statistics. (2026, June 11). Producer Price Index by commodity: Chemicals and allied products: Synthetic rubber. USA Bureau of Labor Statistics.
- USA Tire Manufacturers Association. (2025, December 2). USTMA November 2025 forecast predicts slightly higher 2025 tire shipments for USA tire market. USA Tire Manufacturers Association.
- USA Tire Manufacturers Association. (2026, March 4). USTMA February 2026 forecast predicts slightly higher 2026 tire shipments for USA tire market. USA Tire Manufacturers Association.
- Verband der Automobilindustrie. (2026, February 4). Production and market in January 2026. Verband der Automobilindustrie.
This bibliography is provided for reader reference and is not exhaustive. The full report contains the complete reference list and detailed citations.
This Report Answers
- What is the expected global value of the rubber bonding agents market in 2026 and 2036?
- What CAGR is forecast for the rubber bonding agents market during the 2026 to 2036 period?
- Which sales channel segment is used to assess direct chemical supply demand in 2026?
- Why do compounders and OEM buyers use controlled rubber bonding agent systems?
- How do phenolic bonding resins and rubber-to-metal substrates shape bonding decisions?
- Which countries are compared in the rubber bonding agents forecast?
- Which companies compete across rubber bonding and industrial adhesive support pathways?
- What agent systems and applications are included within the rubber bonding agents definition?
- How does FMI size and forecast rubber bonding agent demand across segments and countries?
- What implementation and supplier-selection factors should executives assess?
Frequently Asked Questions
What is driving growth in the rubber bonding agents market?
Demand is driven by vehicle production and the need to maintain bonding strength across commercial rubber goods. Buyers are giving more attention to bonding agents reducing uncertainty during qualification and repeat production.
Why should executives track the rubber bonding agents market?
Executives are expected to track this segment since bonding agent approval affects part reliability and supplier accountability. Supplier selection is likely to influence production consistency and commercial performance across rubber component operations.
What business problem does the rubber bonding agents market address?
Rubber bonding agents help compounders and OEM buyers reduce uncertainty around rubber-to-substrate adhesion and repeatable use in commercial operations. The segment supports buyers needing clearer links between bonding chemistry and operating control.
What should sourcing leaders evaluate before selecting suppliers?
Sourcing leaders are anticipated to compare documentation quality and supply reliability before supplier approval. Technical service and application-specific evidence should also guide supplier review.
What can limit return on investment for buyers?
Return on investment is expected to be delayed if trial evidence is weak or adhesive handling requires plant changes. Buyers can reduce such risk by phasing trials before wider use.
How can suppliers build executive confidence?
Suppliers build confidence led by verified product data and accountable support during commercial roll-out. Clear trial protocols and consistent batch documentation can strengthen buyer approval.
Which companies lead rubber bonding agents market?
Supplier strength is driven by Parker LORD and H. B. Fuller, based on rubber bonding product depth and customer training support. Henkel, 3M and Dow strengthen competition due to industrial adhesive portfolios.
What challenge affects rubber bonding agents market?
Supplier approval faces pressure from rubber formulation changes and substrate variation. Compounders require bonding proof across plant trials before repeat production.
Preview the report firsthand - request a free sample
Get SampleGet the brochure for pricing and purchase details.
Get PDFTable of Content
- Key Takeaways
- Market Size and CAGR
- Top Growth Driver
- Fastest Growing Segment
- Leading Region
- Key Companies
- Emerging Opportunities
- Executive Summary
- Global Market Outlook
- Demand-side Trends
- Supply-side Trends
- Technology Roadmap Analysis
- Analysis and Recommendations
- Analyst Perspective (What is happening? Why now? What should investors know?)
- Key Questions Answered
- How large is the market?
- What is the CAGR?
- What are key trends?
- Which region dominates?
- Who are the leaders?
- Market Overview
- Market Coverage / Taxonomy
- Market Definition / Scope / Limitations
- Research Methodology
- Chapter Orientation
- Analytical Lens and Working Hypotheses
- Market Structure, Signals, and Trend Drivers
- Benchmarking and Cross-market Comparability
- Market Sizing, Forecasting, and Opportunity Mapping
- Research Design and Evidence Framework
- Desk Research Programme (Secondary Evidence)
- Expert Input and Fieldwork (Primary Evidence)
- Tooling, Models, and Reference Databases
- Data Engineering and Model Build
- Quality Assurance and Audit Trail
- Market Background
- Market Dynamics (Drivers, Restraints, Opportunity, Trends)
- Scenario Forecast (Optimistic, Likely, Conservative)
- Impact Analysis
- AI Impact
- Sustainability Impact
- Regulatory Impact
- Technology Impact
- Consumer / Buyer Analysis
- Purchase Drivers
- Adoption Barriers
- Buyer Journey
- Opportunity Map Analysis
- Product Life Cycle Analysis
- Supply Chain Analysis
- Investment Feasibility Matrix
- Value Chain Analysis
- PESTLE and Porter's Analysis
- Regulatory Landscape
- Regional Parent Market Outlook
- Production and Consumption Statistics
- Import and Export Statistics
- Global Market Analysis and Forecast, 2021 to 2036
- Historical Market Size Value (USD Mn) Analysis, 2021 to 2025
- Current and Future Market Size Value (USD Mn) Projections, 2026 to 2036
- Y-o-Y Growth Trend Analysis
- Absolute $ Opportunity Analysis
- Global Market Pricing Analysis, 2021 to 2036
- Global Market Analysis and Forecast, By Agent Type, 2021 to 2036
- Introduction / Key Findings
- Historical Market Size Value (USD Mn) Analysis By Agent Type, 2021 to 2025
- Current and Future Market Size Value (USD Mn) Analysis and Forecast By Agent Type, 2026 to 2036
- phenolic bonding resins
- cobalt salts
- silane coupling agents
- isocyanate or specialty agents
- phenolic bonding resins
- Y-o-Y Growth Trend Analysis By Agent Type, 2021 to 2025
- Absolute $ Opportunity Analysis By Agent Type, 2026 to 2036
- Global Market Analysis and Forecast, By Substrate, 2021 to 2036
- Introduction / Key Findings
- Historical Market Size Value (USD Mn) Analysis By Substrate, 2021 to 2025
- Current and Future Market Size Value (USD Mn) Analysis and Forecast By Substrate, 2026 to 2036
- Rubber-to-Metal
- Rubber-to-Fabric
- Rubber-to-Steel Cord
- Rubber-to-Plastic
- Rubber-to-Metal
- Y-o-Y Growth Trend Analysis By Substrate, 2021 to 2025
- Absolute $ Opportunity Analysis By Substrate, 2026 to 2036
- Global Market Analysis and Forecast, By Application, 2021 to 2036
- Introduction / Key Findings
- Historical Market Size Value (USD Mn) Analysis By Application, 2021 to 2025
- Current and Future Market Size Value (USD Mn) Analysis and Forecast By Application, 2026 to 2036
- Tires
- Hoses
- Belts
- Vibration Control Parts
- Tires
- Y-o-Y Growth Trend Analysis By Application, 2021 to 2025
- Absolute $ Opportunity Analysis By Application, 2026 to 2036
- Global Market Analysis and Forecast, By End Use, 2021 to 2036
- Introduction / Key Findings
- Historical Market Size Value (USD Mn) Analysis By End Use, 2021 to 2025
- Current and Future Market Size Value (USD Mn) Analysis and Forecast By End Use, 2026 to 2036
- automotive
- industrial rubber
- consumer goods
- construction or mining
- automotive
- Y-o-Y Growth Trend Analysis By End Use, 2021 to 2025
- Absolute $ Opportunity Analysis By End Use, 2026 to 2036
- Global Market Analysis and Forecast, By Sales Channel, 2021 to 2036
- Introduction / Key Findings
- Historical Market Size Value (USD Mn) Analysis By Sales Channel, 2021 to 2025
- Current and Future Market Size Value (USD Mn) Analysis and Forecast By Sales Channel, 2026 to 2036
- Direct Chemical Supply
- Distributors
- Compounder Bundled
- Direct Chemical Supply
- Y-o-Y Growth Trend Analysis By Sales Channel, 2021 to 2025
- Absolute $ Opportunity Analysis By Sales Channel, 2026 to 2036
- Global Market Analysis and Forecast, By Region, 2021 to 2036
- Introduction
- Historical Market Size Value (USD Mn) Analysis By Region, 2021 to 2025
- Current Market Size Value (USD Mn) Analysis and Forecast By Region, 2026 to 2036
- North America
- Latin America
- Western Europe
- Eastern Europe
- East Asia
- South Asia and Pacific
- Middle East & Africa
- Market Attractiveness Analysis By Region
- North America Market Analysis and Forecast, By Country, 2021 to 2036
- Historical Market Size Value (USD Mn) Trend Analysis By Market Taxonomy, 2021 to 2025
- Market Size Value (USD Mn) Forecast By Market Taxonomy, 2026 to 2036
- By Country
- USA
- Canada
- By Agent Type
- By Substrate
- By Application
- By End Use
- By Sales Channel
- By Country
- Market Attractiveness Analysis
- By Country
- By Agent Type
- By Substrate
- By Application
- By End Use
- By Sales Channel
- Key Takeaways
- Latin America Market Analysis and Forecast, By Country
- Historical Market Size Value (USD Mn) Trend Analysis By Market Taxonomy, 2021 to 2025
- Market Size Value (USD Mn) Forecast By Market Taxonomy, 2026 to 2036
- By Country
- Brazil
- Mexico
- Chile
- Rest of Latin America
- By Agent Type
- By Substrate
- By Application
- By End Use
- By Sales Channel
- By Country
- Market Attractiveness Analysis
- By Country
- By Agent Type
- By Substrate
- By Application
- By End Use
- By Sales Channel
- Key Takeaways
- Western Europe Market Analysis and Forecast, By Country
- Historical Market Size Value (USD Mn) Trend Analysis By Market Taxonomy, 2021 to 2025
- Market Size Value (USD Mn) Forecast By Market Taxonomy, 2026 to 2036
- By Country
- Germany
- UK
- Italy
- Spain
- France
- Nordic
- BENELUX
- Rest of Western Europe
- By Agent Type
- By Substrate
- By Application
- By End Use
- By Sales Channel
- By Country
- Market Attractiveness Analysis
- By Country
- By Agent Type
- By Substrate
- By Application
- By End Use
- By Sales Channel
- Key Takeaways
- Eastern Europe Market Analysis and Forecast, By Country
- Historical Market Size Value (USD Mn) Trend Analysis By Market Taxonomy, 2021 to 2025
- Market Size Value (USD Mn) Forecast By Market Taxonomy, 2026 to 2036
- By Country
- Russia
- Poland
- Hungary
- Balkan & Baltic
- Rest of Eastern Europe
- By Agent Type
- By Substrate
- By Application
- By End Use
- By Sales Channel
- By Country
- Market Attractiveness Analysis
- By Country
- By Agent Type
- By Substrate
- By Application
- By End Use
- By Sales Channel
- Key Takeaways
- East Asia Market Analysis and Forecast, By Country
- Historical Market Size Value (USD Mn) Trend Analysis By Market Taxonomy, 2021 to 2025
- Market Size Value (USD Mn) Forecast By Market Taxonomy, 2026 to 2036
- By Country
- China
- Japan
- South Korea
- By Agent Type
- By Substrate
- By Application
- By End Use
- By Sales Channel
- By Country
- Market Attractiveness Analysis
- By Country
- By Agent Type
- By Substrate
- By Application
- By End Use
- By Sales Channel
- Key Takeaways
- South Asia and Pacific Market Analysis and Forecast, By Country
- Historical Market Size Value (USD Mn) Trend Analysis By Market Taxonomy, 2021 to 2025
- Market Size Value (USD Mn) Forecast By Market Taxonomy, 2026 to 2036
- By Country
- India
- ASEAN
- Australia & New Zealand
- Rest of South Asia and Pacific
- By Agent Type
- By Substrate
- By Application
- By End Use
- By Sales Channel
- By Country
- Market Attractiveness Analysis
- By Country
- By Agent Type
- By Substrate
- By Application
- By End Use
- By Sales Channel
- Key Takeaways
- Middle East & Africa Market Analysis and Forecast, By Country
- Historical Market Size Value (USD Mn) Trend Analysis By Market Taxonomy, 2021 to 2025
- Market Size Value (USD Mn) Forecast By Market Taxonomy, 2026 to 2036
- By Country
- Kingdom of Saudi Arabia
- Other GCC Countries
- Türkiye
- South Africa
- Other African Union
- Rest of Middle East & Africa
- By Agent Type
- By Substrate
- By Application
- By End Use
- By Sales Channel
- By Country
- Market Attractiveness Analysis
- By Country
- By Agent Type
- By Substrate
- By Application
- By End Use
- By Sales Channel
- Key Takeaways
- Key Countries Market Analysis
- USA
- Pricing Analysis
- Market Share Analysis, 2025
- By Agent Type
- By Substrate
- By Application
- By End Use
- By Sales Channel
- Canada
- Pricing Analysis
- Market Share Analysis, 2025
- By Agent Type
- By Substrate
- By Application
- By End Use
- By Sales Channel
- Mexico
- Pricing Analysis
- Market Share Analysis, 2025
- By Agent Type
- By Substrate
- By Application
- By End Use
- By Sales Channel
- Brazil
- Pricing Analysis
- Market Share Analysis, 2025
- By Agent Type
- By Substrate
- By Application
- By End Use
- By Sales Channel
- Chile
- Pricing Analysis
- Market Share Analysis, 2025
- By Agent Type
- By Substrate
- By Application
- By End Use
- By Sales Channel
- Germany
- Pricing Analysis
- Market Share Analysis, 2025
- By Agent Type
- By Substrate
- By Application
- By End Use
- By Sales Channel
- UK
- Pricing Analysis
- Market Share Analysis, 2025
- By Agent Type
- By Substrate
- By Application
- By End Use
- By Sales Channel
- Italy
- Pricing Analysis
- Market Share Analysis, 2025
- By Agent Type
- By Substrate
- By Application
- By End Use
- By Sales Channel
- Spain
- Pricing Analysis
- Market Share Analysis, 2025
- By Agent Type
- By Substrate
- By Application
- By End Use
- By Sales Channel
- France
- Pricing Analysis
- Market Share Analysis, 2025
- By Agent Type
- By Substrate
- By Application
- By End Use
- By Sales Channel
- India
- Pricing Analysis
- Market Share Analysis, 2025
- By Agent Type
- By Substrate
- By Application
- By End Use
- By Sales Channel
- ASEAN
- Pricing Analysis
- Market Share Analysis, 2025
- By Agent Type
- By Substrate
- By Application
- By End Use
- By Sales Channel
- Australia & New Zealand
- Pricing Analysis
- Market Share Analysis, 2025
- By Agent Type
- By Substrate
- By Application
- By End Use
- By Sales Channel
- China
- Pricing Analysis
- Market Share Analysis, 2025
- By Agent Type
- By Substrate
- By Application
- By End Use
- By Sales Channel
- Japan
- Pricing Analysis
- Market Share Analysis, 2025
- By Agent Type
- By Substrate
- By Application
- By End Use
- By Sales Channel
- South Korea
- Pricing Analysis
- Market Share Analysis, 2025
- By Agent Type
- By Substrate
- By Application
- By End Use
- By Sales Channel
- Russia
- Pricing Analysis
- Market Share Analysis, 2025
- By Agent Type
- By Substrate
- By Application
- By End Use
- By Sales Channel
- Poland
- Pricing Analysis
- Market Share Analysis, 2025
- By Agent Type
- By Substrate
- By Application
- By End Use
- By Sales Channel
- Hungary
- Pricing Analysis
- Market Share Analysis, 2025
- By Agent Type
- By Substrate
- By Application
- By End Use
- By Sales Channel
- Kingdom of Saudi Arabia
- Pricing Analysis
- Market Share Analysis, 2025
- By Agent Type
- By Substrate
- By Application
- By End Use
- By Sales Channel
- Türkiye
- Pricing Analysis
- Market Share Analysis, 2025
- By Agent Type
- By Substrate
- By Application
- By End Use
- By Sales Channel
- South Africa
- Pricing Analysis
- Market Share Analysis, 2025
- By Agent Type
- By Substrate
- By Application
- By End Use
- By Sales Channel
- USA
- Market Structure Analysis
- Competition Dashboard
- Competition Benchmarking
- Market Share Analysis of Top Players
- By Regional
- By Agent Type
- By Substrate
- By Application
- By End Use
- By Sales Channel
- Emerging Startups
- Innovation Benchmarking
- Competition Analysis
- Competition Deep Dive
- Parker LORD
- Overview
- Product Portfolio
- Profitability by Market Segments
- Sales Footprint
- Strategy Overview
- Marketing Strategy
- Product Strategy
- Channel Strategy
- Henkel
- H. B. Fuller
- Dow
- Eastman
- Arkema
- Bostik
- Sika
- Wacker Chemie
- Parker LORD
- Case Studies
- Success Stories
- Recent Developments
- Competition Deep Dive
- Assumptions & Acronyms Used


