
- Market Size (2026)
- USD 1.9 Bn
- Forecast (2036)
- USD 3.1 Bn
- CAGR (2026 to 2036)
- 4.8%
How Big Is the Rutile Market in 2026?
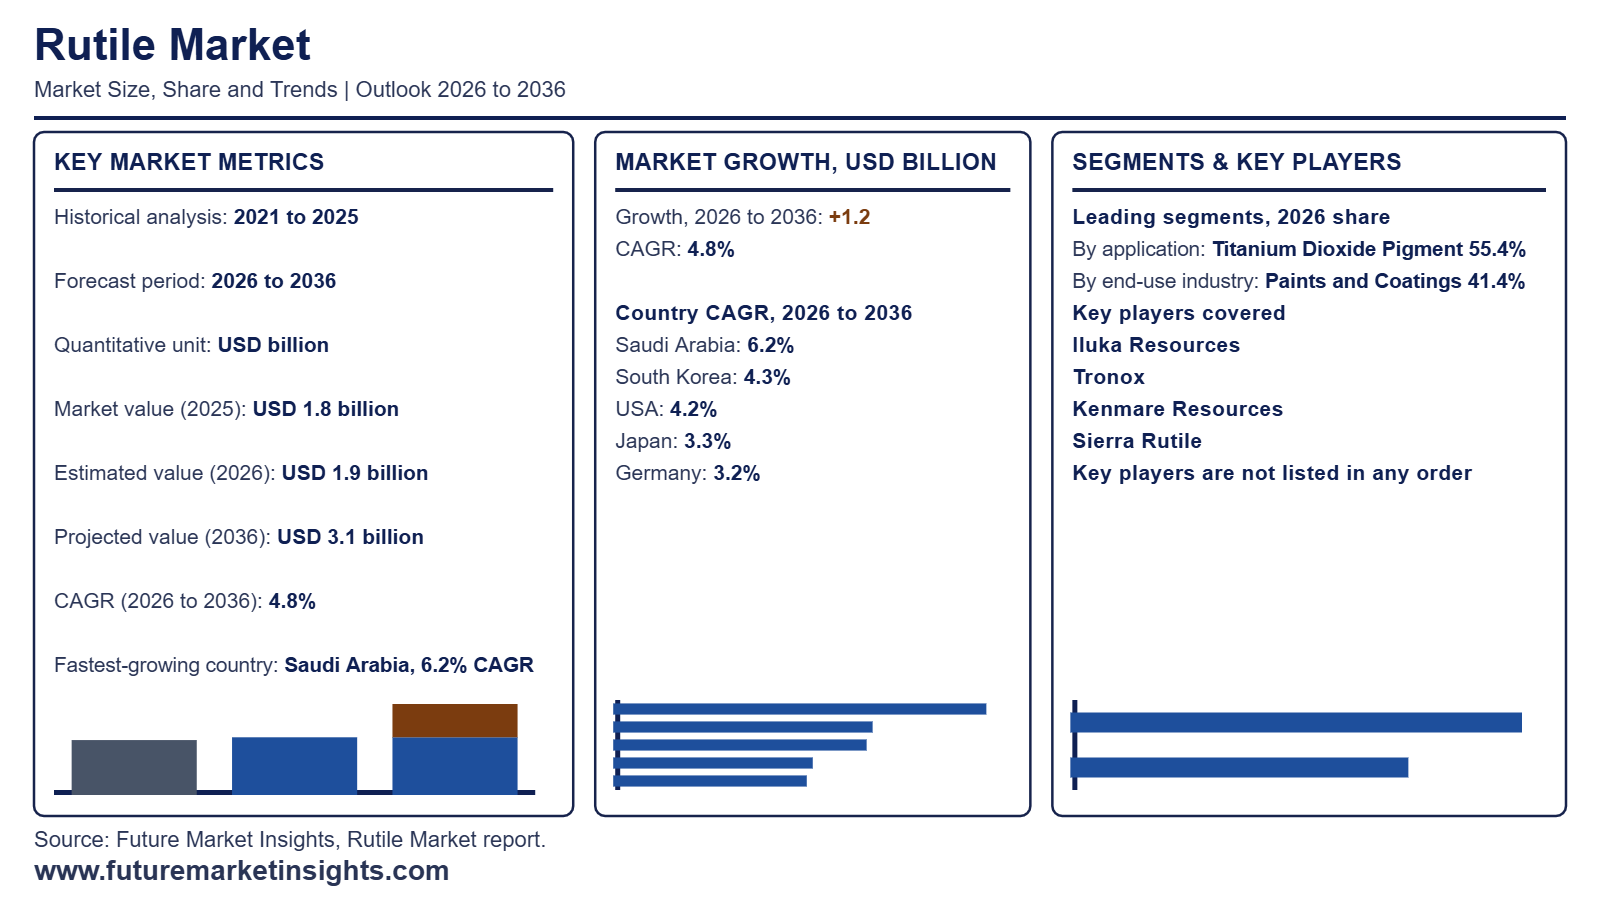
The rutile market is valued at USD 1.9 billion in 2026, up from USD 1.8 billion in 2025. FMI projects it to reach USD 3.1 billion by 2036 at a 4.8% CAGR, which adds USD 1.2 billion in incremental revenue.
| Metric | Value |
|---|---|
| Market Size (2025 Historical) | USD 1.8 billion |
| Market Size (2026 Estimated) | USD 1.9 billion |
| Market Size (2036 Projected) | USD 3.1 billion |
| CAGR (2026 to 2036) | 4.8% |
| Incremental Dollar Opportunity (2026 to 2036) | USD 1.2 billion |
| Dominant Product | Natural Granular Rutile | 38.0% share in 2026 | 39.5% share in 2036 |
| Leading & Fastest-Growing Application | Leading | Titanium Dioxide Pigment (55.4%) | Fastest-Growing | Titanium Metal and Sponge (6.1% CAGR) |
| Leading & Fastest-Growing End-Use Industry | Leading | Paints and Coatings (41.4%) | Fastest-Growing | Aerospace and Defense (6.4% CAGR) |
| Largest Country Markets | USA (13.5%) | Japan (9.5%) | Germany (7.0%) |
| Fastest-Growing Country Markets | Saudi Arabia (6.2% CAGR) | South Korea (4.3% CAGR) | USA (4.2% CAGR) |
| Leading Tier-1 Companies | Iluka Resources | Tronox | Kenmare Resources | Sierra Rutile |
Source: Future Market Insights analysis of the rutile market, 2026.
Executive Market Overview
Rutile demand worldwide follows titanium feedstock chemistry. Titanium dioxide pigment takes 55.4% of consumption because chloride route plants pay a premium for high grade input that cuts waste and chlorine use. Paints and coatings anchor 41.4% of end use while natural granular rutile holds 38.0% of the product mix. Asia Pacific carries the largest volume base with Europe and the Middle East adding specialty pull. Saudi Arabia leads country growth at 6.2% CAGR with South Korea at 4.3% and USA at 4.2%. USA holds the largest country share near 13.5% ahead of Japan at 9.5%. Rutile also feeds welding electrodes and rods where coating chemistry needs stable arc behavior and it competes with ilmenite for pigment plant slots.
Aerospace and defense use records 6.4% CAGR. Pigment buyers still set the volume baseline within titanium dioxide supply chains. The scope covers natural granular rutile and fine grades sold for pigment metal and welding uses and leaves ilmenite and synthetic rutile outside the count. Supply concentration shapes pricing since only a few mineral sands producers ship high grade rutile and ore bodies mature toward lower grades. Suppliers respond with long term offtake contracts and tailings retreatment and synthetic upgrading to widen volume. Titanium metal and sponge is projected by FMI at 6.1% CAGR as aerospace builds lift demand for qualified feedstock linked to aerospace titanium programs.
Analyst Perspective
“Rutile value will build around high-grade natural supply feeding titanium sponge and welding electrode makers who prize consistent chemistry and high purity. The key watch-point is concentration of mine output in a few countries where licensing changes or processing capacity shifts can reset pricing for buyers and favor suppliers holding secure long-term contracts and synthetic rutile flexibility.”
- Nikhil Kaitwade, Principal Consultant, Future Market Insights (FMI)
Major Market Trends and Insights
- Iluka Rutile Sales Gather Pace as Pigment Customers Restock Rutile sales at Iluka Resources reached 27.6 thousand tonnes in the first half of 2026 which is 34.6% above the prior year according to the company interim report of 19 August 2026. The realized price held at US$1254 per tonne excluding HyTi. Some pigment producers report leaner inventories and improving operating rates with price increases announced across several regions. Balranald commissioning finished in June 2026 and adds a rutile-rich source. Management states in the July 2026 quarterly review that it is positioned to respond to recovering Northern Hemisphere housing demand or changing Chinese pigment economics. FMI places pigment feedstock at a 58.0% share in 2026 with a 4.3% CAGR so customer restocking supports tier-1 suppliers such as Iluka.
- Sierra Leone Growth Reshapes the Rutile Supply Map Supply is broadening beyond a single dominant origin. The U.S. Geological Survey (February 2026) estimates 2025 world rutile output at 450 thousand metric tons with Australia contributing 200 thousand and Sierra Leone rising from 80 thousand to 110 thousand. As of July 2025 American buyers sourced rutile from Australia at 51% of volume while South Africa and Sierra Leone supplied 20% and 18%. Net import reliance reached 88% of apparent consumption. The agency prices bulk rutile at an estimated US$1140 per metric ton for 2025. With more than 95% of titanium mineral concentrates flowing to pigment makers the 6.4% CAGR for titanium metal and aerospace marks the segment with the sharpest upside inside a 4.8% market.
- European Anti-Dumping Duties Reorder Pigment Sourcing and Feedstock Demand Brussels acted on 9 January 2025 by imposing definitive anti-dumping duties of 0.25 to 0.74 euro per kilogram on titanium dioxide from China while exempting graphic grades used in printing ink. The duties follow a provisional measure of July 2024 that the European Commission adjusted after consulting European users. The Commission describes the outcome as a fair balance between protecting an industry that employs almost 5000 people and serving European users of the compound. Pigment plants inside the Union gain a firmer footing and that supports steady purchasing of high-grade feedstock such as rutile. FMI's anticipated 4.6% CAGR for Germany reflects this regional anchor and tier-1 suppliers can plan around stable European orders.
What Are the Main Drivers, Restraints, and Opportunities?
Chloride-route pigment plants keep rutile purchases steady through each production cycle while slower mine ramp-ups and paused upgrading kilns tighten qualified supply and more reliable separation plus ilmenite upgrading routes open fresh volumes that pass customer assay checks.
Driver: Chloride-Route Pigment Plants Anchoring Titanium Feedstock Purchases
Chlorinators run best on feedstock that carries high titanium content and a clean impurity profile so every titanium dioxide pigment line becomes a standing rutile customer. USGS (February 2026) reports that more than 95% of titanium mineral concentrates used in the United States during 2025 went to pigment producers. That share covers all concentrates rather than rutile alone yet it shows where purchasing power sits. Recovery in coatings and plastics orders first lifts plant utilization and inventory turns and only later mineral contracts. Sellers that ship consistent qualified lots earn more repeat business than those that add tonnage alone.
Restraint: Mine Ramp-Ups and Kiln Pauses Narrowing Qualified Supply
Qualified supply tightens when upgrading assets and concentrator plants run below plan and the ilmenite route that feeds kilns follows the same cycle. Iluka (July 2026) reported that both synthetic rutile kilns stayed paused through the June quarter with restart tied to market conditions while 36.5 kt of synthetic rutile still shipped. Kenmare (October 2026) lowered its 2026 ilmenite outlook to 710 kt to 750 kt from about 800 kt as commissioning at wet concentrator plant A continued and port delays shortened vessel loading time at Moma. Each shift sends buyers back to assay checks at the receiving plant.
Opportunity: Reliable Separation and Ilmenite Upgrading for Spec-Ready Feedstock
Upgrading ilmenite lifts titanium dioxide content and gives pigment makers and aerospace titanium buyers more usable feedstock. A Murdoch University doctoral thesis describes kiln reduction of ilmenite with coal followed by leaching that delivers synthetic rutile above 88% TiO2. Sierra Rutile (February 2026) relocated the Kwale mineral sands plant from Kenya to Sembehun with a USD 40 million Ecobank facility and lowered projected capital spending by 61%. FMI projects titanium metal and sponge at a 6.1% CAGR and aerospace and defense at 6.4% through 2036. Operating separation routes backed by open assays stand ready to turn interest into contracted shipments.
How Is the Rutile Market Segmented?
The rutile market is segmented by product and application and titanium dioxide content and end-use industry with region used for geographic reporting. Each axis describes a different characteristic of the same rutile revenue.
| Segmentation Axis | Sub-Segments Covered | 2026 Leading Segment & Share | Main Growth Benchmark (2026 to 2036) |
|---|---|---|---|
| Product | Natural Granular Rutile, Synthetic Rutile from the Becher Process, Natural Fine and Milled Rutile, Synthetic Rutile from Other Processes | Natural Granular Rutile (38.0%) | Reaches 39.5% by 2036 while Natural Fine and Milled Rutile advances at 5.6% CAGR |
| Application | Titanium Dioxide Pigment, Titanium Metal and Sponge, Welding Electrodes, Ceramics Glass and Specialty | Titanium Dioxide Pigment (55.4%) | Titanium Metal and Sponge rises fastest at 6.1% CAGR |
| Titanium Dioxide Content | 93 to 95 Percent, 92 to 93 Percent, 95 to 96 Percent, Above 96 Percent | 93 to 95 Percent (36.0%) | Above 96 Percent advances at 6.0% CAGR |
| End-Use Industry | Paints and Coatings, Plastics, Construction and Fabrication, Aerospace and Defense | Paints and Coatings (41.4%) | Aerospace and Defense rises fastest at 6.4% CAGR |
| Region | USA, Japan, Germany, Saudi Arabia, South Korea | USA (13.5%) | Saudi Arabia grows fastest at 6.2% CAGR with South Korea next at 4.3% |
Future Market Insights analysis of the rutile market 2026.
What Supports Natural Granular Rutile Within Product Demand?
Buyers who feed chlorinators want grains that arrive ready to use with a dependable titanium content. Natural Granular Rutile delivers that and earns 38.0% of 2026 product revenue. A derived 5.2% CAGR lifts its share to 39.5% in 2036. Iluka (January 2026) began mining and processing run-of-mine ore at the rutile-rich Balranald deposit in New South Wales and that fresh supply sits beside ilmenite based feedstock routes in the wider titanium chain. Natural Fine and Milled Rutile sets the pace at 5.6% CAGR as specialty users ask for tailored particle sizes.
Why Does Titanium Dioxide Pigment Anchor Application Demand?
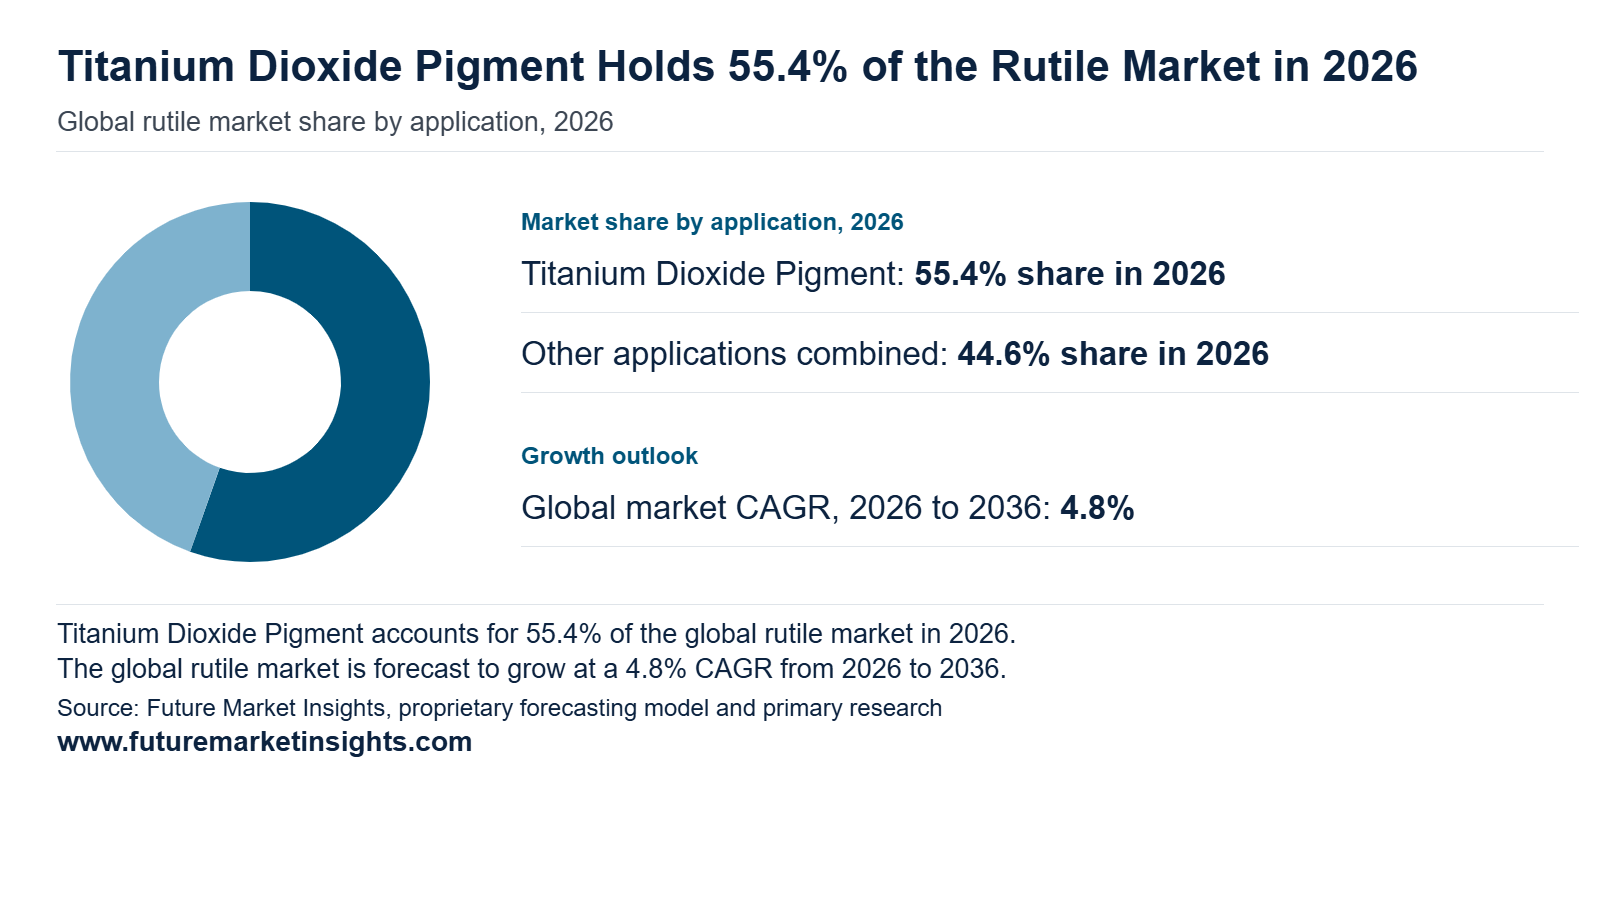
Chloride lines convert it into titanium tetrachloride and then into white TiO2 so steady supply keeps reactors productive. That routine buying gives Titanium Dioxide Pigment 55.4% of 2026 application revenue and 54.4% in 2036 on a 4.6% CAGR. Tronox (May 2026) reported its highest first quarter TiO2 volumes since 2022 which signals healthy conversion activity downstream. Plants value that reliability because every hour of steady feed supports output and cost control. Titanium Metal and Sponge grows fastest at 6.1% CAGR as aerospace programs widen their need for titanium.
How Does 93 to 95 Percent Shape Titanium Dioxide Content Purchasing?
Buyers who confirm assay and trace impurities before contracting keep chlorinator throughput smooth. Above 96 Percent rises fastest at 6.0% CAGR as impurity-sensitive routes such as aerospace titanium production favor tighter chemistry. A grade band of 93 to 95 Percent anchors purchasing at 36.0% of 2026 titanium dioxide content revenue and reaches 35.7% in 2036 on a 4.7% CAGR. Iluka (October 2026) set natural rutile at about 95% TiO2 beside its HyTi product at 70 to 90% and that clear grade ladder helps buyers match feedstock to plant design.
Why Do Paints and Coatings Lead End-Use Industry Demand?
TiO2 delivers the opacity and weather resistance that every white inorganic pigment formulator needs and rutile reaches it through pigment makers. Aerospace and Defense is the quickest end use at 6.4% CAGR as titanium metal programs expand. VdL (February 2026) reported German paint and printing ink sales of about 1.4 million tonnes worth EUR 5.8 billion in 2025 and that scale shows the depth of the downstream pull on titanium feedstock. Paints and Coatings holds 41.4% of 2026 end-use revenue and 40.2% in 2036 on a 4.5% CAGR.
Rutile Market by Region and Country (2026 to 2036)
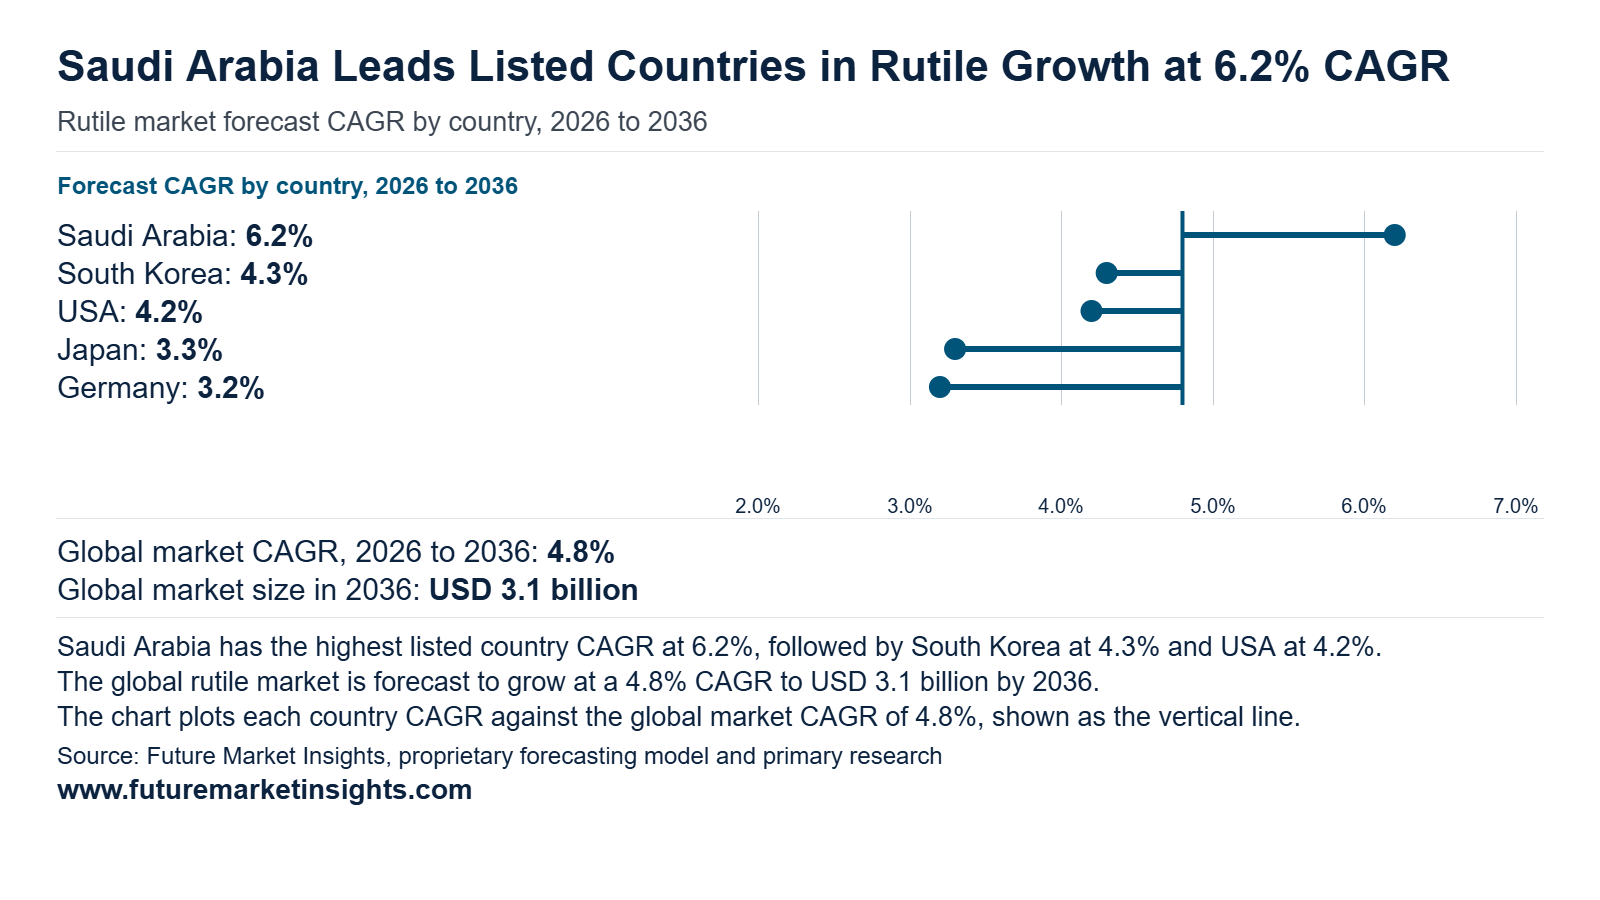
The five tracked countries account for 38.0% of global rutile revenue in 2026 and 35.3% by 2036 as markets outside this group gain momentum. The majority of demand therefore sits elsewhere and spreads wider over the decade. The United States remains the largest market and adds USD 133 million while its share settles at 12.7% from 13.5%. Saudi Arabia leads the group on growth at 6.2% a year. South Korea and Saudi Arabia together rise from USD 155 million to USD 257 million which is an addition of USD 102 million. Titanium pigment and aerospace metal demand both feed this expansion.
| Country | 2026 Revenue | 2036 Revenue | 10-Year Addition | 2026 to 2036 CAGR | Global Share (2026 → 2036) |
|---|---|---|---|---|---|
| Saudi Arabia | USD 68 million | USD 124 million | USD 56 million | 6.2% | 3.5% → 4.0% |
| South Korea | USD 87 million | USD 133 million | USD 46 million | 4.3% | 4.5% → 4.3% |
| USA | USD 262 million | USD 395 million | USD 133 million | 4.2% | 13.5% → 12.7% |
| Japan | USD 184 million | USD 255 million | USD 71 million | 3.3% | 9.5% → 8.2% |
| Germany | USD 136 million | USD 186 million | USD 50 million | 3.2% | 7.0% → 6.0% |
Source: Future Market Insights analysis of the rutile market 2026.
United States
The United States moves from USD 262 million in 2026 to USD 395 million in 2036 at a 4.2% CAGR. That is an addition of USD 133 million and the largest dollar gain among the five countries. Its global share settles at 12.7% from 13.5% while the country keeps first rank. Import reliance shapes this market. USGS estimates titanium mineral and synthetic concentrate imports at USD 720 million in 2025 with net import reliance near 88% of apparent consumption (U.S. Geological Survey February 2026). A third domestic company also began commercial ilmenite production at Stony Creek Virginia. Growing domestic mine output widens local feedstock options and gives rutile buyers more room to negotiate supply terms. Early supply contracts with these producers should set cost positions across the decade.
Japan
Japan advances from USD 184 million to USD 255 million over the decade at a 3.3% CAGR and adds USD 71 million. Share settles at 8.2% from 9.5% and the country holds second place. Aerospace titanium is the clearest growth path. OSAKA Titanium technologies is building an extra 10 thousand tons per year of sponge capacity that lifts its total from 40 thousand to 50 thousand tons with completion planned for the end of fiscal 2027 (OSAKA Titanium technologies June 2026). The company points to larger Boeing and Airbus order backlogs as the demand base. Added sponge capacity raises domestic need for high grade titanium feedstock and rutile suppliers with consistent quality stand to benefit. Capacity additions of this size usually come with multiyear feedstock planning.
Germany
Germany grows from USD 136 million to USD 186 million at a 3.2% CAGR with an addition of USD 50 million. Its share settles at 6.0% from 7.0% while the country holds third place. Pigment makers anchor local rutile use. Kronos reported second quarter 2026 net sales of USD 558.1 million which rose 13% and credited market share gains across all markets (Kronos Worldwide August 2026). Its TiO2 segment profit reached USD 41.0 million versus USD 10.9 million a year earlier. Kronos operates plants at Leverkusen and Nordenham in Germany (NL Industries March 2025). Stronger pigment output supports steady feedstock purchasing and gives chloride process producers a firm base for long term supply contracts. These plants keep Germany central to European pigment supply.
South Korea
Fighter production draws titanium alloy parts and that builds a steady pull on sponge and rutile inputs. Korean buyers source titanium feedstock from overseas so supply agreements with established producers become the practical route to secure volumes. The company also cites Poland and Malaysia export programs as drivers of growth. South Korea expands from USD 87 million to USD 133 million at a 4.3% CAGR which adds USD 46 million. Share settles at 4.3% from 4.5% and the country ranks fourth. Aerospace programs lead demand for titanium metal. Korea Aerospace Industries reported first quarter 2026 revenue growth across all business segments and expects domestic KF-21 production deliveries to start in the second half of 2026 (Korea Aerospace Industries May 2026).
Saudi Arabia
Local titanium tetrachloride supply gives the kingdom a base for downstream titanium chemicals and metal. Feedstock buyers at Yanbu and new downstream entrants can secure rutile under multi year contracts which supports the strongest growth rate in the group. A sustained chlorine and TiCl4 chain also shortens logistics for local metal producers. Saudi Arabia posts the fastest growth at a 6.2% CAGR rising from USD 68 million to USD 124 million. The USD 56 million addition lifts share to 4.0% from 3.5% and widens the kingdom's weight in the group. Integration drives this pace. Tronox runs the Yanbu complex as the first site in the Middle East fully integrated across TiO2 pigment and metal grade TiCl4 and chlorine (Tronox 2025).
Competitive Environment and Notable Companies
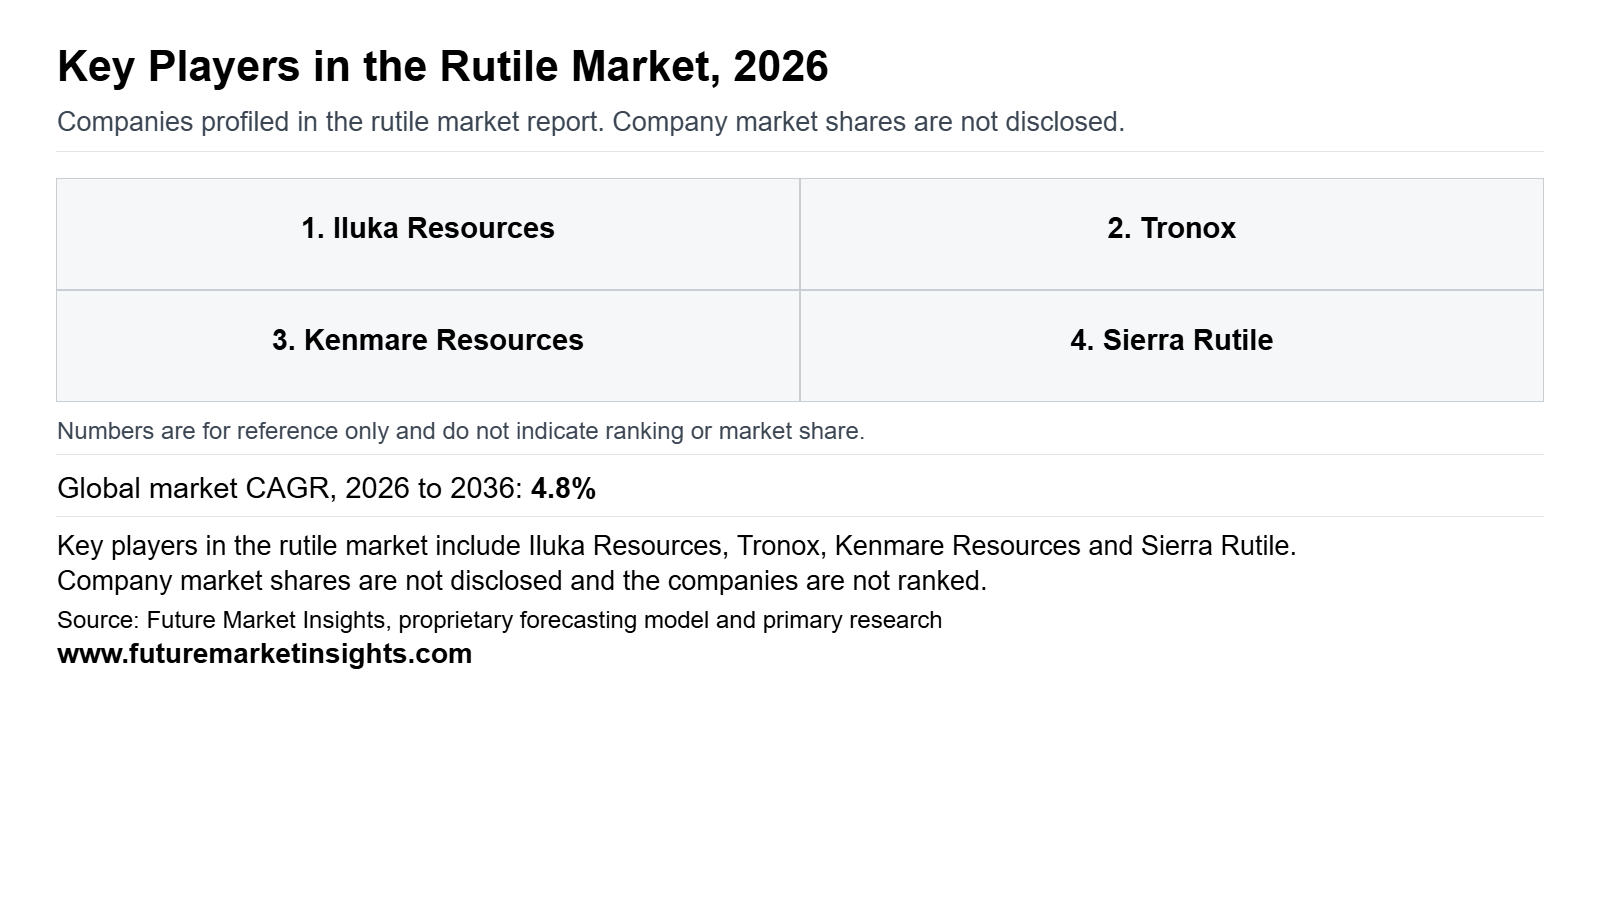
Notable companies operating in the global rutile market include Iluka Resources and Tronox and Kenmare Resources and Sierra Rutile. Rutile sits at the premium end of titanium feedstock beside synthetic rutile and ilmenite and slag. The four producers hold separate positions. Iluka and Tronox pair natural rutile with synthetic conversion. Kenmare sells rutile as a small co-product next to very large ilmenite and zircon streams. Sierra Rutile concentrates on high grade natural rutile from Sierra Leone with separate pigment and welding channels. The roles describe operating mix and stand apart from any revenue league table.
How Are Companies Positioned in the Rutile Market?
Positions follow the feedstock route each producer controls. Iluka Resources and Tronox combine natural rutile from mineral separation with synthetic rutile upgraded from ilmenite so both grades reach titanium customers. Kenmare Resources mines large ilmenite and zircon volumes at Moma and adds a modest rutile stream. Sierra Rutile sells natural rutile as its core product. These roles describe operating mix and show who supplies which grade across the chain.
What Matters When a Buyer Selects a Rutile Supplier?
A pigment or welding or titanium metal buyer starts with particle chemistry and impurity levels then checks contract form and delivered logistics. Reliable mining output matters as much as grade because feedstock plants plan around steady shipments. Take-or-pay terms and held inventory let a seller serve customers while plants adjust. Iluka showed this in 2026 by servicing synthetic rutile contracts from inventory. Buyers therefore review mines and kilns and contracts and stockpiles together.
Which Capabilities Distinguish Product Offers?
Product offers separate on three points. Synthetic rutile conversion capacity lets Iluka and Tronox turn ilmenite into high titania feedstock. Natural rutile supply gives Sierra Rutile a high grade position backed by the large Sembehun deposit. A documented welding channel adds a specialist outlet for industrial customers. Kenmare supplies rutile in smaller lots next to ilmenite and zircon and so suits buyers who blend several mineral sands products from one port.
How Does Geographic Reach Affect Competition?
Geography shapes freight and risk. Iluka mines and separates in Western Australia and sells to customers in many countries. Tronox runs mineral sands mines in Australia and South Africa and a synthetic rutile complex in Western Australia beside its own pigment plants. Kenmare loads from Mozambique through transshipment at Moma. Sierra Rutile ships from Sierra Leone to pigment and welding customers overseas. Port conditions and shipping schedules therefore influence delivery timing as much as mine output does.
| Verified Company Evidence (2026) | Commercial Effect | Buyer Action |
|---|---|---|
| 28 October 2026 Iluka sold 16000 tonnes of synthetic rutile in the September quarter and year to date sales reached 52000 tonnes with both kilns idled. Rutile production was 21200 tonnes including HyTi. [Iluka Resources quarterly review (October 2026)] | Deliveries came from inventory so kiln restart depends on market conditions while the remaining contracted volume ships in the fourth quarter. | Check stock cover and restart timing before agreeing new merchant synthetic rutile terms. |
| 15 October 2026 Kenmare reported rutile production of 2200 tonnes for the third quarter and 22% growth year on year. Shipments for 2026 are now guided near 1.05 million tonnes because delays at other ports limited vessel loading time at Moma. WCP A is expected to reach its 3500 tonne per hour nameplate rate consistently in the first half of 2027. [Kenmare Resources Q3 2026 production report (October 2026)] | Rutile volumes are rising from a small base while plant ramp-up and port timing shape availability. | Build loading windows and lot sizes into rutile orders from Moma. |
| 21 July 2026 Sierra Rutile held the groundbreaking for Sembehun Area 5 under 100% ownership by Leonoil Company Limited with a mine life extension of at least 14 years and up to 175000 tonnes of rutile per year once complete. [Sierra Rutile (July 2026)] | The event marks a construction milestone while output remains ahead. | Track the construction timetable before counting on Sembehun tonnes in multi-year supply plans. |
Source: Verified corporate disclosures and Future Market Insights analysis, 2026.
| Company | Core Positioning | Verified Activity & Source Attribution |
|---|---|---|
| Iluka Resources | Natural and synthetic rutile from Western Australian mineral sands | Both synthetic rutile kilns stayed idled through the September 2026 quarter while 16000 tonnes shipped from stock (Iluka Resources October 2026) |
| Tronox | Integrated mineral sands and synthetic rutile feeding its own pigment plants | Ramped up the Namakwa furnace and West Mine in the third quarter of 2026 and agreed a shared rare earths study budget of about $32 million with JX Advanced Metals (Tronox November 2026) |
| Kenmare Resources | Rutile co-product from Moma ilmenite and zircon operations | 2200 tonnes of rutile in the third quarter of 2026 (Kenmare Resources October 2026) |
| Sierra Rutile | Natural rutile specialist with pigment and welding channels | Sembehun Area 5 groundbreaking on 21 July 2026 (Sierra Rutile July 2026) |
Source: Verified corporate disclosures and Future Market Insights analysis, 2026.
Rutile Market Report Scope and Research Methodology
FMI builds the global rutile market from revenue on natural and synthetic rutile feedstocks sold to titanium dioxide pigment makers and titanium metal producers and welding electrode makers and ceramics and glass users and then checks the total against national mineral sands and titanium feedstock industry data. Natural granular rutile and Becher process synthetic rutile carry the largest share of value because pigment and sponge producers buy these grades at scale. Revenue is recorded at the merchant sale of rutile itself so ilmenite and titanium slag and mixed mineral products and downstream pigment and metal and finished product value sit in neighboring markets. Captive transfers inside integrated operations stay outside the merchant totals. Interviews with miners and processors and consumers are paired with a review of trade data and regulatory filings and standards and company reports. Titanium dioxide content bands and product types are reconciled by country so regional values add up to the global total in every year. Company information confirms product ranges and capacity plans and is used to verify positioning rather than derive company revenues.
| Coverage Field | Report Scope |
|---|---|
| Market definition | Revenue from sales of natural rutile and synthetic rutile feedstocks within the specified product and use categories. |
| Products | Natural granular rutile, synthetic rutile from the Becher process, natural fine and milled rutile, and synthetic rutile from other processes. |
| Applications | Titanium dioxide pigment, titanium metal and sponge, welding electrodes, and ceramics, glass and specialty. |
| Titanium dioxide content | 92 to 93 percent, 93 to 95 percent, 95 to 96 percent, and above 96 percent. |
| End-use industries | Paints and coatings, plastics, construction and fabrication, and aerospace and defense. |
| Exclusions | Ilmenite, titanium slag and mixed mineral products that are not sold as rutile, downstream pigment, metal, welding-consumable and finished-product revenue, and internal captive transfers. |
| Quantitative units | USD billion for value. |
| Value basis | Revenue from merchant sales of rutile to buyers in each country. |
| Regions covered | North America, Latin America, Western Europe, Eastern Europe, East Asia, South Asia and Pacific, and Middle East and Africa. |
| National coverage | USA, China, Germany, Japan, India, Saudi Arabia, and South Korea. |
| Companies covered | Iluka Resources, Tronox, Kenmare Resources, and Sierra Rutile. |
| Forecast period | 2026 to 2036. |
| Approach | Primary and secondary research with market triangulation, followed by validation against independent indicators to avoid double counting. |
Source: Future Market Insights analysis of the rutile market, 2026.
Research Sources and Bibliography
- European Commission, Directorate-General for Trade and Economic Security (January 2025). EU acts to counter dumping of titanium dioxide from China. https://policy.trade.ec.europa.eu/news/eu-acts-counter-dumping-titanium-dioxide-china-2025-01-09_en
- Iluka Resources (August 2026). 2026 Half Year Results Presentation. https://www.iluka.com/media/1b5ptzh4/2026-half-year-results-presentation.pdf
- Iluka Resources (n.d.). Balranald. https://iluka.com/operations-resource-development/resource-development/balranald/
- Iluka Resources (August 2026). Interim Report for the Half-Year Ended 30 June 2026. https://www.iluka.com/media/mjujrki3/2026-half-year-results-interim-report.pdf
- Iluka Resources (July 2026). Quarterly Review to 30 June 2026. https://www.iluka.com/media/yanmys1i/28jul26-quarterly-review-to-30-june.pdf
- Iluka Resources (October 2026). Quarterly Review to 30 September 2026 (ASX release dated 28 October 2026). https://asx.api.markitdigital.com/asx-research/1.0/file/2924-03154022-6A1351806
- Kenmare Resources (October 2026). Q3 2026 Production Report. https://www.globenewswire.com/news-release/2026/10/15/3381283/0/en/q3-2026-production-report.html
- Korea Aerospace Industries (May 2026). 2026 Q1 Earnings Release. https://www.koreaaero.com/KO/Services/Common/DownloadFile.aspx?FilePid=14621
- Kronos Worldwide (August 2026). Second Quarter 2026 Results (Exhibit 99.1). https://www.sec.gov/Archives/edgar/data/1257640/000125764026000029/kro-20260805xex99d1.htm
- Murdoch University (2025). Advancing Cleaner Technologies for Production of Synthetic Rutile and Activated Carbon (doctoral thesis by William Spencer). https://researchportal.murdoch.edu.au/esploro/outputs/doctoral/Advancing-Cleaner-Technologies-for-Production-of/991005790673507891
- NL Industries (March 2025). Annual Report. https://www.sec.gov/Archives/edgar/data/72162/000005925525000019/nlars25.pdf
- OSAKA Titanium technologies (June 2026). Notice of the 29th Annual General Meeting of Shareholders (English translation). https://www.osaka-ti.co.jp/e/e_ir/pdf/e20260624shoushu.pdf
- Sierra Rutile (July 2026). Sierra Rutile Breaks Ground on its Sembehun Area 5 Expansion. https://www.sierra-rutile.com/sierra-rutile-breaks-ground-on-its-sembehun-area-5-expansion/
- Tronox (February 2026). Annual Report on Form 10-K for 2025. https://www.sec.gov/Archives/edgar/data/1530804/000153080426000006/trox-20251231.htm
- Tronox (May 2026). Tronox Reports First Quarter 2026 Financial Results. https://www.tronox.com/?p=22796
- Tronox (November 2026). Tronox Reports Third Quarter 2026 Financial Results. https://www.tronox.com/tronox-reports-third-quarter-2026-financial-results/
- Tronox (n.d.). Yanbu Plant Summary (Tronox Saudi Industries). https://www.tronox.com/download.php?path=20479
- U.S. Geological Survey (February 2026). Mineral Commodity Summaries 2026: Titanium Mineral Concentrates. https://pubs.usgs.gov/periodicals/mcs2026/mcs2026-titanium-minerals.pdf
- Verband der deutschen Lack- und Druckfarbenindustrie (February 2026). Düsteres Grau statt leuchtender Farben. https://www.wirsindfarbe.de/presse/pressemitteilungen/duesteres-grau-statt-leuchtender-farben
Table of Content
- Key Takeaways
- Market Size and CAGR
- Top Growth Driver
- Fastest Growing Segment
- Leading Region
- Key Companies
- Emerging Opportunities
- Executive Summary
- Global Market Outlook
- Demand-side Trends
- Supply-side Trends
- Technology Roadmap Analysis
- Analysis and Recommendations
- Analyst Perspective (What is happening? Why now? What should investors know?)
- Key Questions Answered
- How large is the market?
- What is the CAGR?
- What are key trends?
- Which region dominates?
- Who are the leaders?
Read More...
- Market Overview
- Market Coverage / Taxonomy
- Market Definition / Scope / Limitations
- Research Methodology
- Chapter Orientation
- Analytical Lens and Working Hypotheses
- Market Structure, Signals, and Trend Drivers
- Benchmarking and Cross-market Comparability
- Market Sizing, Forecasting, and Opportunity Mapping
- Research Design and Evidence Framework
- Desk Research Programme (Secondary Evidence)
- Expert Input and Fieldwork (Primary Evidence)
- Tooling, Models, and Reference Databases
- Data Engineering and Model Build
- Quality Assurance and Audit Trail
- Market Background
- Market Dynamics (Drivers, Restraints, Opportunity, Trends)
- Scenario Forecast (Optimistic, Likely, Conservative)
- Impact Analysis
- AI Impact
- Sustainability Impact
- Regulatory Impact
- Technology Impact
- Consumer / Buyer Analysis
- Purchase Drivers
- Adoption Barriers
- Buyer Journey
- Opportunity Map Analysis
- Product Life Cycle Analysis
- Supply Chain Analysis
- Investment Feasibility Matrix
- Value Chain Analysis
- PESTLE and Porter's Analysis
- Regulatory Landscape
- Regional Parent Market Outlook
- Production and Consumption Statistics
- Import and Export Statistics
- Global Market Analysis and Forecast, 2021 to 2036
- Historical Market Size Value (USD Million) Analysis, 2021 to 2025
- Current and Future Market Size Value (USD Million) Projections, 2026 to 2036
- Y-o-Y Growth Trend Analysis
- Absolute $ Opportunity Analysis
- Global Market Pricing Analysis, 2021 to 2036
- Global Market Analysis and Forecast, By Product, 2021 to 2036
- Introduction / Key Findings
- Historical Market Size Value (USD Million) Analysis By Product, 2021 to 2025
- Current and Future Market Size Value (USD Million) Analysis and Forecast By Product, 2026 to 2036
- Natural Granular Rutile
- Synthetic Rutile from the Becher Process
- Natural Fine and Milled Rutile
- Synthetic Rutile from Other Processes
- Y-o-Y Growth Trend Analysis By Product, 2021 to 2025
- Absolute $ Opportunity Analysis By Product, 2026 to 2036
- Global Market Analysis and Forecast, By Application, 2021 to 2036
- Introduction / Key Findings
- Historical Market Size Value (USD Million) Analysis By Application, 2021 to 2025
- Current and Future Market Size Value (USD Million) Analysis and Forecast By Application, 2026 to 2036
- Titanium Dioxide Pigment
- Titanium Metal and Sponge
- Welding Electrodes
- Ceramics, Glass and Specialty
- Y-o-Y Growth Trend Analysis By Application, 2021 to 2025
- Absolute $ Opportunity Analysis By Application, 2026 to 2036
- Global Market Analysis and Forecast, By Titanium Dioxide Content, 2021 to 2036
- Introduction / Key Findings
- Historical Market Size Value (USD Million) Analysis By Titanium Dioxide Content, 2021 to 2025
- Current and Future Market Size Value (USD Million) Analysis and Forecast By Titanium Dioxide Content, 2026 to 2036
- 93 to 95 Percent
- 92 to 93 Percent
- 95 to 96 Percent
- Above 96 Percent
- Y-o-Y Growth Trend Analysis By Titanium Dioxide Content, 2021 to 2025
- Absolute $ Opportunity Analysis By Titanium Dioxide Content, 2026 to 2036
- Global Market Analysis and Forecast, By End-Use Industry, 2021 to 2036
- Introduction / Key Findings
- Historical Market Size Value (USD Million) Analysis By End-Use Industry, 2021 to 2025
- Current and Future Market Size Value (USD Million) Analysis and Forecast By End-Use Industry, 2026 to 2036
- Paints and Coatings
- Plastics
- Construction and Fabrication
- Aerospace and Defence
- Y-o-Y Growth Trend Analysis By End-Use Industry, 2021 to 2025
- Absolute $ Opportunity Analysis By End-Use Industry, 2026 to 2036
- Global Market Analysis and Forecast, By Region, 2021 to 2036
- Introduction
- Historical Market Size Value (USD Million) Analysis By Region, 2021 to 2025
- Current Market Size Value (USD Million) Analysis and Forecast By Region, 2026 to 2036
- North America
- Latin America
- Western Europe
- Eastern Europe
- East Asia
- South Asia and Pacific
- Middle East and Africa
- Market Attractiveness Analysis By Region
- North America Market Analysis and Forecast, By Country, 2021 to 2036
- Historical Market Size Value (USD Million) Trend Analysis By Market Taxonomy, 2021 to 2025
- Market Size Value (USD Million) Forecast By Market Taxonomy, 2026 to 2036
- By Country
- United States
- Canada
- By Product
- By Application
- By Titanium Dioxide Content
- By End-Use Industry
- By Country
- Market Attractiveness Analysis
- By Country
- By Product
- By Application
- By Titanium Dioxide Content
- By End-Use Industry
- Key Takeaways
- Latin America Market Analysis and Forecast, By Country, 2021 to 2036
- Historical Market Size Value (USD Million) Trend Analysis By Market Taxonomy, 2021 to 2025
- Market Size Value (USD Million) Forecast By Market Taxonomy, 2026 to 2036
- By Country
- Brazil
- Mexico
- Argentina
- Chile
- By Product
- By Application
- By Titanium Dioxide Content
- By End-Use Industry
- By Country
- Market Attractiveness Analysis
- By Country
- By Product
- By Application
- By Titanium Dioxide Content
- By End-Use Industry
- Key Takeaways
- Western Europe Market Analysis and Forecast, By Country, 2021 to 2036
- Historical Market Size Value (USD Million) Trend Analysis By Market Taxonomy, 2021 to 2025
- Market Size Value (USD Million) Forecast By Market Taxonomy, 2026 to 2036
- By Country
- Germany
- France
- United Kingdom
- Italy
- Spain
- Benelux
- Nordics
- By Product
- By Application
- By Titanium Dioxide Content
- By End-Use Industry
- By Country
- Market Attractiveness Analysis
- By Country
- By Product
- By Application
- By Titanium Dioxide Content
- By End-Use Industry
- Key Takeaways
- Eastern Europe Market Analysis and Forecast, By Country, 2021 to 2036
- Historical Market Size Value (USD Million) Trend Analysis By Market Taxonomy, 2021 to 2025
- Market Size Value (USD Million) Forecast By Market Taxonomy, 2026 to 2036
- By Country
- Poland
- Czech Republic
- Romania
- Hungary
- By Product
- By Application
- By Titanium Dioxide Content
- By End-Use Industry
- By Country
- Market Attractiveness Analysis
- By Country
- By Product
- By Application
- By Titanium Dioxide Content
- By End-Use Industry
- Key Takeaways
- East Asia Market Analysis and Forecast, By Country, 2021 to 2036
- Historical Market Size Value (USD Million) Trend Analysis By Market Taxonomy, 2021 to 2025
- Market Size Value (USD Million) Forecast By Market Taxonomy, 2026 to 2036
- By Country
- China
- Japan
- South Korea
- By Product
- By Application
- By Titanium Dioxide Content
- By End-Use Industry
- By Country
- Market Attractiveness Analysis
- By Country
- By Product
- By Application
- By Titanium Dioxide Content
- By End-Use Industry
- Key Takeaways
- South Asia and Pacific Market Analysis and Forecast, By Country, 2021 to 2036
- Historical Market Size Value (USD Million) Trend Analysis By Market Taxonomy, 2021 to 2025
- Market Size Value (USD Million) Forecast By Market Taxonomy, 2026 to 2036
- By Country
- India
- ASEAN
- Australia and New Zealand
- By Product
- By Application
- By Titanium Dioxide Content
- By End-Use Industry
- By Country
- Market Attractiveness Analysis
- By Country
- By Product
- By Application
- By Titanium Dioxide Content
- By End-Use Industry
- Key Takeaways
- Middle East and Africa Market Analysis and Forecast, By Country, 2021 to 2036
- Historical Market Size Value (USD Million) Trend Analysis By Market Taxonomy, 2021 to 2025
- Market Size Value (USD Million) Forecast By Market Taxonomy, 2026 to 2036
- By Country
- GCC Countries
- South Africa
- Türkiye
- Israel
- By Product
- By Application
- By Titanium Dioxide Content
- By End-Use Industry
- By Country
- Market Attractiveness Analysis
- By Country
- By Product
- By Application
- By Titanium Dioxide Content
- By End-Use Industry
- Key Takeaways
- Key Countries Market Analysis
- United States
- Pricing Analysis
- Market Share Analysis, 2025
- By Product
- By Application
- By Titanium Dioxide Content
- By End-Use Industry
- Canada
- Pricing Analysis
- Market Share Analysis, 2025
- By Product
- By Application
- By Titanium Dioxide Content
- By End-Use Industry
- Brazil
- Pricing Analysis
- Market Share Analysis, 2025
- By Product
- By Application
- By Titanium Dioxide Content
- By End-Use Industry
- Mexico
- Pricing Analysis
- Market Share Analysis, 2025
- By Product
- By Application
- By Titanium Dioxide Content
- By End-Use Industry
- Argentina
- Pricing Analysis
- Market Share Analysis, 2025
- By Product
- By Application
- By Titanium Dioxide Content
- By End-Use Industry
- Chile
- Pricing Analysis
- Market Share Analysis, 2025
- By Product
- By Application
- By Titanium Dioxide Content
- By End-Use Industry
- Germany
- Pricing Analysis
- Market Share Analysis, 2025
- By Product
- By Application
- By Titanium Dioxide Content
- By End-Use Industry
- France
- Pricing Analysis
- Market Share Analysis, 2025
- By Product
- By Application
- By Titanium Dioxide Content
- By End-Use Industry
- United Kingdom
- Pricing Analysis
- Market Share Analysis, 2025
- By Product
- By Application
- By Titanium Dioxide Content
- By End-Use Industry
- Italy
- Pricing Analysis
- Market Share Analysis, 2025
- By Product
- By Application
- By Titanium Dioxide Content
- By End-Use Industry
- Spain
- Pricing Analysis
- Market Share Analysis, 2025
- By Product
- By Application
- By Titanium Dioxide Content
- By End-Use Industry
- Benelux
- Pricing Analysis
- Market Share Analysis, 2025
- By Product
- By Application
- By Titanium Dioxide Content
- By End-Use Industry
- Nordics
- Pricing Analysis
- Market Share Analysis, 2025
- By Product
- By Application
- By Titanium Dioxide Content
- By End-Use Industry
- Poland
- Pricing Analysis
- Market Share Analysis, 2025
- By Product
- By Application
- By Titanium Dioxide Content
- By End-Use Industry
- Czech Republic
- Pricing Analysis
- Market Share Analysis, 2025
- By Product
- By Application
- By Titanium Dioxide Content
- By End-Use Industry
- Romania
- Pricing Analysis
- Market Share Analysis, 2025
- By Product
- By Application
- By Titanium Dioxide Content
- By End-Use Industry
- Hungary
- Pricing Analysis
- Market Share Analysis, 2025
- By Product
- By Application
- By Titanium Dioxide Content
- By End-Use Industry
- China
- Pricing Analysis
- Market Share Analysis, 2025
- By Product
- By Application
- By Titanium Dioxide Content
- By End-Use Industry
- Japan
- Pricing Analysis
- Market Share Analysis, 2025
- By Product
- By Application
- By Titanium Dioxide Content
- By End-Use Industry
- South Korea
- Pricing Analysis
- Market Share Analysis, 2025
- By Product
- By Application
- By Titanium Dioxide Content
- By End-Use Industry
- India
- Pricing Analysis
- Market Share Analysis, 2025
- By Product
- By Application
- By Titanium Dioxide Content
- By End-Use Industry
- ASEAN
- Pricing Analysis
- Market Share Analysis, 2025
- By Product
- By Application
- By Titanium Dioxide Content
- By End-Use Industry
- Australia and New Zealand
- Pricing Analysis
- Market Share Analysis, 2025
- By Product
- By Application
- By Titanium Dioxide Content
- By End-Use Industry
- GCC Countries
- Pricing Analysis
- Market Share Analysis, 2025
- By Product
- By Application
- By Titanium Dioxide Content
- By End-Use Industry
- South Africa
- Pricing Analysis
- Market Share Analysis, 2025
- By Product
- By Application
- By Titanium Dioxide Content
- By End-Use Industry
- Türkiye
- Pricing Analysis
- Market Share Analysis, 2025
- By Product
- By Application
- By Titanium Dioxide Content
- By End-Use Industry
- Israel
- Pricing Analysis
- Market Share Analysis, 2025
- By Product
- By Application
- By Titanium Dioxide Content
- By End-Use Industry
- United States
- Market Structure Analysis
- Competition Dashboard
- Competition Benchmarking
- Market Share Analysis of Top Players
- By Region
- By Product
- By Application
- By Titanium Dioxide Content
- By End-Use Industry
- Emerging Startups
- Innovation Benchmarking
- Competition Analysis
- Competition Deep Dive
- Iluka Resources
- Overview
- Product Portfolio
- Profitability by Market Segments
- Sales Footprint
- Strategy Overview
- Marketing Strategy
- Product Strategy
- Channel Strategy
- Tronox
- Kenmare Resources
- Sierra Rutile
- Iluka Resources
- Case Studies
- Success Stories
- Recent Developments
- Competition Deep Dive
- Assumptions & Acronyms Used
List of Tables
- Table 1: Global Market Value (USD Million) Forecast by Region, 2021 to 2036
- Table 2: Global Market Value (USD Million) Forecast by Product, 2021 to 2036
- Table 3: Global Market Value (USD Million) Forecast by Application, 2021 to 2036
- Table 4: Global Market Value (USD Million) Forecast by Titanium Dioxide Content, 2021 to 2036
- Table 5: Global Market Value (USD Million) Forecast by End-Use Industry, 2021 to 2036
- Table 6: North America Market Value (USD Million) Forecast by Country, 2021 to 2036
- Table 7: North America Market Value (USD Million) Forecast by Product, 2021 to 2036
- Table 8: North America Market Value (USD Million) Forecast by Application, 2021 to 2036
- Table 9: North America Market Value (USD Million) Forecast by Titanium Dioxide Content, 2021 to 2036
- Table 10: North America Market Value (USD Million) Forecast by End-Use Industry, 2021 to 2036
- Table 11: Latin America Market Value (USD Million) Forecast by Country, 2021 to 2036
- Table 12: Latin America Market Value (USD Million) Forecast by Product, 2021 to 2036
- Table 13: Latin America Market Value (USD Million) Forecast by Application, 2021 to 2036
- Table 14: Latin America Market Value (USD Million) Forecast by Titanium Dioxide Content, 2021 to 2036
- Table 15: Latin America Market Value (USD Million) Forecast by End-Use Industry, 2021 to 2036
- Table 16: Western Europe Market Value (USD Million) Forecast by Country, 2021 to 2036
- Table 17: Western Europe Market Value (USD Million) Forecast by Product, 2021 to 2036
- Table 18: Western Europe Market Value (USD Million) Forecast by Application, 2021 to 2036
- Table 19: Western Europe Market Value (USD Million) Forecast by Titanium Dioxide Content, 2021 to 2036
- Table 20: Western Europe Market Value (USD Million) Forecast by End-Use Industry, 2021 to 2036
- Table 21: Eastern Europe Market Value (USD Million) Forecast by Country, 2021 to 2036
- Table 22: Eastern Europe Market Value (USD Million) Forecast by Product, 2021 to 2036
- Table 23: Eastern Europe Market Value (USD Million) Forecast by Application, 2021 to 2036
- Table 24: Eastern Europe Market Value (USD Million) Forecast by Titanium Dioxide Content, 2021 to 2036
- Table 25: Eastern Europe Market Value (USD Million) Forecast by End-Use Industry, 2021 to 2036
- Table 26: East Asia Market Value (USD Million) Forecast by Country, 2021 to 2036
- Table 27: East Asia Market Value (USD Million) Forecast by Product, 2021 to 2036
- Table 28: East Asia Market Value (USD Million) Forecast by Application, 2021 to 2036
- Table 29: East Asia Market Value (USD Million) Forecast by Titanium Dioxide Content, 2021 to 2036
- Table 30: East Asia Market Value (USD Million) Forecast by End-Use Industry, 2021 to 2036
- Table 31: South Asia and Pacific Market Value (USD Million) Forecast by Country, 2021 to 2036
- Table 32: South Asia and Pacific Market Value (USD Million) Forecast by Product, 2021 to 2036
- Table 33: South Asia and Pacific Market Value (USD Million) Forecast by Application, 2021 to 2036
- Table 34: South Asia and Pacific Market Value (USD Million) Forecast by Titanium Dioxide Content, 2021 to 2036
- Table 35: South Asia and Pacific Market Value (USD Million) Forecast by End-Use Industry, 2021 to 2036
- Table 36: Middle East and Africa Market Value (USD Million) Forecast by Country, 2021 to 2036
- Table 37: Middle East and Africa Market Value (USD Million) Forecast by Product, 2021 to 2036
- Table 38: Middle East and Africa Market Value (USD Million) Forecast by Application, 2021 to 2036
- Table 39: Middle East and Africa Market Value (USD Million) Forecast by Titanium Dioxide Content, 2021 to 2036
- Table 40: Middle East and Africa Market Value (USD Million) Forecast by End-Use Industry, 2021 to 2036
List of Figures
- Figure 1: Global Market Pricing Analysis
- Figure 2: Global Market Value (USD Million) Forecast 2021-2036
- Figure 3: Global Market Value Share and BPS Analysis by Product, 2026 and 2036
- Figure 4: Global Market Y-o-Y Growth Comparison by Product, 2026-2036
- Figure 5: Global Market Attractiveness Analysis by Product
- Figure 6: Global Market Value Share and BPS Analysis by Application, 2026 and 2036
- Figure 7: Global Market Y-o-Y Growth Comparison by Application, 2026-2036
- Figure 8: Global Market Attractiveness Analysis by Application
- Figure 9: Global Market Value Share and BPS Analysis by Titanium Dioxide Content, 2026 and 2036
- Figure 10: Global Market Y-o-Y Growth Comparison by Titanium Dioxide Content, 2026-2036
- Figure 11: Global Market Attractiveness Analysis by Titanium Dioxide Content
- Figure 12: Global Market Value Share and BPS Analysis by End-Use Industry, 2026 and 2036
- Figure 13: Global Market Y-o-Y Growth Comparison by End-Use Industry, 2026-2036
- Figure 14: Global Market Attractiveness Analysis by End-Use Industry
- Figure 15: Global Market Value (USD Million) Share and BPS Analysis by Region, 2026 and 2036
- Figure 16: Global Market Y-o-Y Growth Comparison by Region, 2026-2036
- Figure 17: Global Market Attractiveness Analysis by Region
- Figure 18: North America Market Incremental Dollar Opportunity, 2026-2036
- Figure 19: Latin America Market Incremental Dollar Opportunity, 2026-2036
- Figure 20: Western Europe Market Incremental Dollar Opportunity, 2026-2036
- Figure 21: Eastern Europe Market Incremental Dollar Opportunity, 2026-2036
- Figure 22: East Asia Market Incremental Dollar Opportunity, 2026-2036
- Figure 23: South Asia and Pacific Market Incremental Dollar Opportunity, 2026-2036
- Figure 24: Middle East and Africa Market Incremental Dollar Opportunity, 2026-2036
- Figure 25: North America Market Value Share and BPS Analysis by Country, 2026 and 2036
- Figure 26: North America Market Value Share and BPS Analysis by Product, 2026 and 2036
- Figure 27: North America Market Y-o-Y Growth Comparison by Product, 2026-2036
- Figure 28: North America Market Attractiveness Analysis by Product
- Figure 29: North America Market Value Share and BPS Analysis by Application, 2026 and 2036
- Figure 30: North America Market Y-o-Y Growth Comparison by Application, 2026-2036
- Figure 31: North America Market Attractiveness Analysis by Application
- Figure 32: North America Market Value Share and BPS Analysis by Titanium Dioxide Content, 2026 and 2036
- Figure 33: North America Market Y-o-Y Growth Comparison by Titanium Dioxide Content, 2026-2036
- Figure 34: North America Market Attractiveness Analysis by Titanium Dioxide Content
- Figure 35: North America Market Value Share and BPS Analysis by End-Use Industry, 2026 and 2036
- Figure 36: North America Market Y-o-Y Growth Comparison by End-Use Industry, 2026-2036
- Figure 37: North America Market Attractiveness Analysis by End-Use Industry
- Figure 38: Latin America Market Value Share and BPS Analysis by Country, 2026 and 2036
- Figure 39: Latin America Market Value Share and BPS Analysis by Product, 2026 and 2036
- Figure 40: Latin America Market Y-o-Y Growth Comparison by Product, 2026-2036
- Figure 41: Latin America Market Attractiveness Analysis by Product
- Figure 42: Latin America Market Value Share and BPS Analysis by Application, 2026 and 2036
- Figure 43: Latin America Market Y-o-Y Growth Comparison by Application, 2026-2036
- Figure 44: Latin America Market Attractiveness Analysis by Application
- Figure 45: Latin America Market Value Share and BPS Analysis by Titanium Dioxide Content, 2026 and 2036
- Figure 46: Latin America Market Y-o-Y Growth Comparison by Titanium Dioxide Content, 2026-2036
- Figure 47: Latin America Market Attractiveness Analysis by Titanium Dioxide Content
- Figure 48: Latin America Market Value Share and BPS Analysis by End-Use Industry, 2026 and 2036
- Figure 49: Latin America Market Y-o-Y Growth Comparison by End-Use Industry, 2026-2036
- Figure 50: Latin America Market Attractiveness Analysis by End-Use Industry
- Figure 51: Western Europe Market Value Share and BPS Analysis by Country, 2026 and 2036
- Figure 52: Western Europe Market Value Share and BPS Analysis by Product, 2026 and 2036
- Figure 53: Western Europe Market Y-o-Y Growth Comparison by Product, 2026-2036
- Figure 54: Western Europe Market Attractiveness Analysis by Product
- Figure 55: Western Europe Market Value Share and BPS Analysis by Application, 2026 and 2036
- Figure 56: Western Europe Market Y-o-Y Growth Comparison by Application, 2026-2036
- Figure 57: Western Europe Market Attractiveness Analysis by Application
- Figure 58: Western Europe Market Value Share and BPS Analysis by Titanium Dioxide Content, 2026 and 2036
- Figure 59: Western Europe Market Y-o-Y Growth Comparison by Titanium Dioxide Content, 2026-2036
- Figure 60: Western Europe Market Attractiveness Analysis by Titanium Dioxide Content
- Figure 61: Western Europe Market Value Share and BPS Analysis by End-Use Industry, 2026 and 2036
- Figure 62: Western Europe Market Y-o-Y Growth Comparison by End-Use Industry, 2026-2036
- Figure 63: Western Europe Market Attractiveness Analysis by End-Use Industry
- Figure 64: Eastern Europe Market Value Share and BPS Analysis by Country, 2026 and 2036
- Figure 65: Eastern Europe Market Value Share and BPS Analysis by Product, 2026 and 2036
- Figure 66: Eastern Europe Market Y-o-Y Growth Comparison by Product, 2026-2036
- Figure 67: Eastern Europe Market Attractiveness Analysis by Product
- Figure 68: Eastern Europe Market Value Share and BPS Analysis by Application, 2026 and 2036
- Figure 69: Eastern Europe Market Y-o-Y Growth Comparison by Application, 2026-2036
- Figure 70: Eastern Europe Market Attractiveness Analysis by Application
- Figure 71: Eastern Europe Market Value Share and BPS Analysis by Titanium Dioxide Content, 2026 and 2036
- Figure 72: Eastern Europe Market Y-o-Y Growth Comparison by Titanium Dioxide Content, 2026-2036
- Figure 73: Eastern Europe Market Attractiveness Analysis by Titanium Dioxide Content
- Figure 74: Eastern Europe Market Value Share and BPS Analysis by End-Use Industry, 2026 and 2036
- Figure 75: Eastern Europe Market Y-o-Y Growth Comparison by End-Use Industry, 2026-2036
- Figure 76: Eastern Europe Market Attractiveness Analysis by End-Use Industry
- Figure 77: East Asia Market Value Share and BPS Analysis by Country, 2026 and 2036
- Figure 78: East Asia Market Value Share and BPS Analysis by Product, 2026 and 2036
- Figure 79: East Asia Market Y-o-Y Growth Comparison by Product, 2026-2036
- Figure 80: East Asia Market Attractiveness Analysis by Product
- Figure 81: East Asia Market Value Share and BPS Analysis by Application, 2026 and 2036
- Figure 82: East Asia Market Y-o-Y Growth Comparison by Application, 2026-2036
- Figure 83: East Asia Market Attractiveness Analysis by Application
- Figure 84: East Asia Market Value Share and BPS Analysis by Titanium Dioxide Content, 2026 and 2036
- Figure 85: East Asia Market Y-o-Y Growth Comparison by Titanium Dioxide Content, 2026-2036
- Figure 86: East Asia Market Attractiveness Analysis by Titanium Dioxide Content
- Figure 87: East Asia Market Value Share and BPS Analysis by End-Use Industry, 2026 and 2036
- Figure 88: East Asia Market Y-o-Y Growth Comparison by End-Use Industry, 2026-2036
- Figure 89: East Asia Market Attractiveness Analysis by End-Use Industry
- Figure 90: South Asia and Pacific Market Value Share and BPS Analysis by Country, 2026 and 2036
- Figure 91: South Asia and Pacific Market Value Share and BPS Analysis by Product, 2026 and 2036
- Figure 92: South Asia and Pacific Market Y-o-Y Growth Comparison by Product, 2026-2036
- Figure 93: South Asia and Pacific Market Attractiveness Analysis by Product
- Figure 94: South Asia and Pacific Market Value Share and BPS Analysis by Application, 2026 and 2036
- Figure 95: South Asia and Pacific Market Y-o-Y Growth Comparison by Application, 2026-2036
- Figure 96: South Asia and Pacific Market Attractiveness Analysis by Application
- Figure 97: South Asia and Pacific Market Value Share and BPS Analysis by Titanium Dioxide Content, 2026 and 2036
- Figure 98: South Asia and Pacific Market Y-o-Y Growth Comparison by Titanium Dioxide Content, 2026-2036
- Figure 99: South Asia and Pacific Market Attractiveness Analysis by Titanium Dioxide Content
- Figure 100: South Asia and Pacific Market Value Share and BPS Analysis by End-Use Industry, 2026 and 2036
- Figure 101: South Asia and Pacific Market Y-o-Y Growth Comparison by End-Use Industry, 2026-2036
- Figure 102: South Asia and Pacific Market Attractiveness Analysis by End-Use Industry
- Figure 103: Middle East and Africa Market Value Share and BPS Analysis by Country, 2026 and 2036
- Figure 104: Middle East and Africa Market Value Share and BPS Analysis by Product, 2026 and 2036
- Figure 105: Middle East and Africa Market Y-o-Y Growth Comparison by Product, 2026-2036
- Figure 106: Middle East and Africa Market Attractiveness Analysis by Product
- Figure 107: Middle East and Africa Market Value Share and BPS Analysis by Application, 2026 and 2036
- Figure 108: Middle East and Africa Market Y-o-Y Growth Comparison by Application, 2026-2036
- Figure 109: Middle East and Africa Market Attractiveness Analysis by Application
- Figure 110: Middle East and Africa Market Value Share and BPS Analysis by Titanium Dioxide Content, 2026 and 2036
- Figure 111: Middle East and Africa Market Y-o-Y Growth Comparison by Titanium Dioxide Content, 2026-2036
- Figure 112: Middle East and Africa Market Attractiveness Analysis by Titanium Dioxide Content
- Figure 113: Middle East and Africa Market Value Share and BPS Analysis by End-Use Industry, 2026 and 2036
- Figure 114: Middle East and Africa Market Y-o-Y Growth Comparison by End-Use Industry, 2026-2036
- Figure 115: Middle East and Africa Market Attractiveness Analysis by End-Use Industry
- Figure 116: Global Market - Tier Structure Analysis
- Figure 117: Global Market - Company Share Analysis
Frequently Asked Questions
How big is the Rutile Market in 2026?
Future Market Insights estimates the global rutile market at USD 1.9 billion in 2026, projected to reach USD 3.1 billion by 2036.
How fast is the Rutile Market expected to grow through 2036?
FMI projects a 4.8% CAGR from 2026 to 2036, taking the global market from USD 1.9 billion in 2026 to USD 3.1 billion by 2036.
Which product segment leads the Rutile Market?
Natural granular rutile leads the product segment with a 38.0% share in 2026, supported by established natural-mineral separation processes and bulk feedstock handling.
Which application leads the Rutile Market?
Titanium dioxide pigment accounts for the largest application share at 55.4% in 2026, driven by recurring feedstock requirements from pigment manufacturers and their conversion facilities.
Which countries are expected to grow fastest in the Rutile Market?
Saudi Arabia is projected to record the fastest growth at a 6.2% CAGR from 2026 to 2036, followed by South Korea at 4.3% over the same period.
Which companies are profiled in the Rutile Market?
The key companies profiled in the rutile market include Iluka Resources, Tronox, Kenmare Resources, and Sierra Rutile. Their market activities span natural rutile extraction, synthetic rutile upgrading, and specialty industrial grades.
Preview the report firsthand - request a free sample
Get SampleGet the brochure for pricing and purchase details.
Get PDF
