

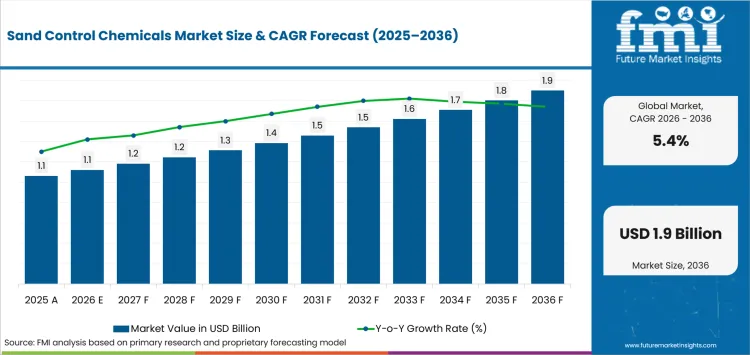
- Market Size (2026)
- USD 1.1 Bn
- Forecast (2036)
- USD 1.9 Bn
- CAGR (2026 to 2036)
- 5.4%
How big is Sand Control Chemicals Market in 2026?
USD 1.1 billion in 2026 and USD 1.9 billion by 2036, expanding at 5.4% CAGR
Sales of sand control chemicals are valued at USD 1.1 billion in 2026 and are projected to reach USD 1.9 billion by 2036. Operators repeat treatments only after chemistry controls sand without unacceptable permeability loss during production. The Society of Petroleum Engineers' October 2025 sand-management review included a documented field case of externally catalyzed resin consolidation used successfully in Latin America. The 5.4% CAGR over the forecast period therefore depends on technically qualified treatments reaching wells where chemical placement can preserve productive flow.
Offshore project intensity changes country exposure because failed chemical placement becomes more costly to correct. The USA Energy Information Administration expected 13 federal Gulf fields to start production during 2025 and 2026, including eight subsea tiebacks or underwater extensions. Projects with subsea infrastructure make remedial access more costly, so suppliers must qualify chemistry around placement reliability and formation compatibility before field use.
Key Takeaways
- Offshore development and mature-well intervention sustain purchases where operators must control sand without sacrificing productive drawdown or equipment life.
- By chemical type, resin consolidation chemicals are estimated to hold 24.0% in 2026 owing to rigless stabilization of selected unconsolidated intervals.
- In 2026, gravel pack support is expected to lead the technique category with 31.0% share because carrier-fluid control affects pack placement.
- By application, sand production control is forecast to represent 38.0% in 2026 driven by operators protecting drawdown and production equipment.
- Formation mineralogy and permeability restrict chemical adoption because excessive grain bonding can reduce flow even after sand production is controlled.
- Key players in the sand control chemicals market include Baker Hughes, Halliburton, SLB, Weatherford, ChampionX (an SLB business), Clariant, Innospec, Nouryon, SNF Group, and TETRA Technologies.
Analyst Perspective
"Sand-control chemistry earns repeat work only where field teams can place it without sacrificing permeability or extending intervention time. Integrated completion contracts favor formulations that arrive with compatibility data and local technical support because the service company must defend treatment performance and job execution."
- Nikhil Kaitwade, Principal Consultant, Future Market Insights
How is the sand control chemicals market segmented?
Sand control chemicals market is segmented by chemical type, technique, application, well type, sales channel, and region
Chemical type covers resin consolidation chemicals, surfactants, clay stabilizers, scale inhibitors, breaker additives, and fines migration control. Technique separates gravel pack support, frac pack support, chemical consolidation, and standalone screen support. Application covers sand production control, formation stabilization, completion cleanup, and permeability retention while well type and sales channel separate operating environment from purchase route.
What supports demand for resin consolidation chemicals within the chemical type category?
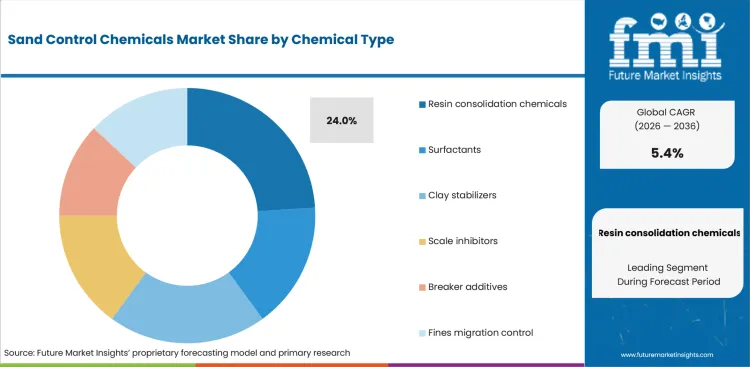
Resin consolidation chemicals fit remedial wells where operators need grain bonding without another permanent downhole barrier. Their formulation overlaps with oilfield chemicals because placement must preserve permeability before the resin cures in the target interval. A January 2026 Scientific Reports study found that furan resin retained 79% permeability and epoxy retained 62% after chemical sand consolidation in high-clay sandstone. Those results keep qualification centered on bond strength and retained flow rather than stabilization alone.
- Based on chemical type, resin consolidation chemicals are projected to account for 24.0% in 2026 due to rigless stabilization needs in selected unconsolidated intervals.
- Operators repeat chemical consolidation only after laboratory work confirms adequate grain bonding and acceptable permeability under the planned placement sequence.
How does gravel pack support shape demand within the technique category?
Gravel-pack support chemistry controls carrier-fluid stability before the pack becomes the primary sand barrier. Poor suspension or fluid incompatibility can leave uneven placement and formation damage during pack installation. A November 2025 Journal of Petroleum Technology paper described a high-temperature reservoir drill-in system for wells using openhole screens or gravel packs, including a low-corrosive breaker for post-installation cleanup. Completion teams therefore tie completion fluids to pack placement and cleanup performance during technically demanding jobs.
- Gravel pack support is set to lead the technique category with 31.0% share in 2026 due to pack-fluid requirements during engineered sand-control completions.
- Completion teams repeat pack-support chemistry after carrier-fluid stability and cleanup behavior meet the operator's qualification limits for comparable well designs.
What role does sand production control play within the application category?
Sand production control is specified where migrating grains or fines threaten drawdown and surface equipment over a producing cycle. An October 2025 Journal of Petroleum Technology paper described an automated workflow that sets minimum tubinghead pressure to avoid sanding from excessive drawdown. Production chemicals enter this program only where formulation and placement can manage solids that operating controls cannot prevent.
- Sand production control is projected to hold 38.0% share in 2026 owing to the need to protect drawdown and production equipment from solids.
- Operators adopt chemical treatments after laboratory work links formation mineralogy and fluid compatibility to a repeatable placement procedure for the target interval.
Why does offshore hold a material position within the well type category?
Offshore wells raise the cost of failed treatment because intervention access depends on rigs or vessels and subsea equipment. An October 2025 Journal of Petroleum Technology study reviewed 125 through-tubing sand-screen installations in offshore eastern Malaysia to improve future sand-control workflows. The recurring interventions explain why offshore teams place more weight on repeatable qualification and contingency planning before field use.
- Offshore is likely to capture 30.0% share in 2026 attributable to high intervention costs and technically demanding sand-control completion programs.
- Deepwater operators place more weight on inventory planning and contingency support because a failed treatment can consume scarce vessel or rig time.
How do completion service companies influence the sales channel category?
Completion service companies influence chemical choice because they often own treatment design and field placement with completion tools. Weatherford announced in May 2026 that ExxonMobil awarded a deepwater integrated completions contract for Nigeria. Integrated awards place formulation support beside the engineers who control job design and field troubleshooting.
- The sales channel category is forecast to be led by completion service companies at 44.0% share in 2026 due to operator preference for one accountable execution team.
- Direct operator contracts remain viable where internal technical teams maintain qualification standards and purchase chemistry separately from completion execution services.
What are the drivers, restraints and opportunities in the Sand Control Chemicals Market?
Driver: repeated completion campaigns expand treatable well activity. Restraint: technical and environmental qualification can delay field adoption. Opportunity: intervention programs can place qualified chemistry inside existing offshore service work.
- Driver: Multiwell completion programs increase the number of intervals requiring sand management and formation-protection chemistry under repeat operating procedures.
- Restraint: Offshore chemistry can lose field access when environmental documentation or reservoir compatibility delays qualification beyond the planned completion window.
- Opportunity: Intervention programs provide a route for qualified sand-control chemistry where operators want production recovery without committing to full recompletion.
Integrated completion programs increase repeat treatment opportunities
Repeated unconventional well campaigns favor chemistry that can be qualified once and reused under comparable operating procedures. Halliburton received a multi-year Aramco contract in July 2026 for integrated stimulation and completion services supporting Saudi unconventional gas development. The award expands local execution capacity and gives qualified treatment programs more chances to move from trial work into repeated shale gas fracturing campaigns.
Environmental documentation can slow offshore chemical substitution
Offshore chemical substitution can stall after laboratory performance is accepted because environmental documentation is part of the field-use gate. OSPAR's 2025 HOCNF guidance requires mandatory information for chemicals used in offshore exploration and production within its maritime area. Completion and workover chemicals need documented composition and use data before national authorities can evaluate field deployment beside sand control screens.
Integrated intervention work expands the treatment revenue route
Mature offshore fields support intervention-led chemistry where operators want production recovery without a full recompletion. Baker Hughes received a bp contract in September 2026 for vessel-based stimulation covering new wells and mature UK North Sea assets. Sand-control treatments gain a practical revenue route when they fit the same intervention schedule and avoid extra rig work.
Which country CAGRs are profiled in the Sand Control Chemicals Market?
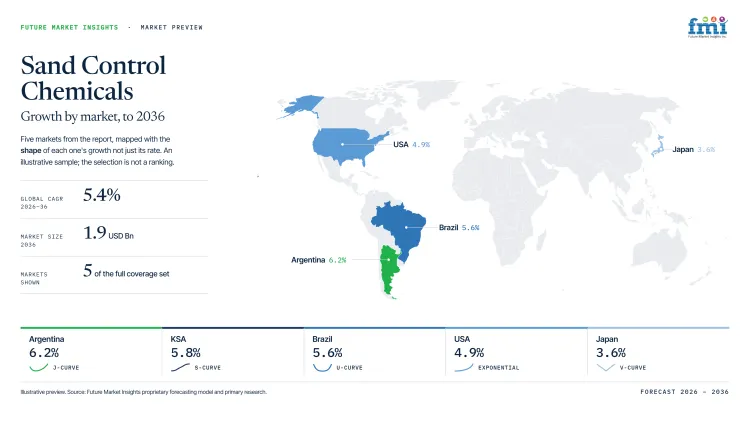
| Country | CAGR |
|---|---|
| Argentina | 6.2% |
| KSA | 5.8% |
| UAE | 5.7% |
| Brazil | 5.6% |
| USA | 4.9% |
| Canada | 4.8% |
| Japan | 3.6% |
How do country-level CAGRs compare in the Sand Control Chemicals Market?
The country CAGRs range from Argentina at 6.2% to Japan at 3.6% across different completion conditions. Growth rates describe pace instead of revenue scale because well count and sanding risk still determine treatable demand.
- Argentina’s concentrated activity in the Vaca Muerta region supports recurring well completions and sustained demand for proven treatment solutions.
- In Saudi Arabia, long-duration multiwell developments favor treatment programs that have demonstrated reliability across repeated field applications.
- UAE offshore gas projects are often governed by centralized technical approvals, making treatment qualification a key factor in market access.
- Brazil’s deepwater pre-salt operations place a premium on treatment continuity, as high intervention costs encourage the use of established solutions.
- The USA’s market is driven by mature-well intervention requirements alongside ongoing offshore completion activity across producing assets.
- In Canada, a mix of basin economics creates targeted demand for treatment technologies across both conventional and offshore developments.
- Japan’s limited domestic upstream sector results in more selective demand, with activity focused on specialized treatment applications rather than large-scale deployment.
The full report provides country-level CAGR analysis across North America, Latin America, Western Europe, Eastern Europe, East Asia, South Asia and Pacific, and Middle East and Africa.
Country-wise Analysis
- Vaca Muerta gives Argentina a concentrated hydraulic fracturing and completion program where local field teams repeat procedures over closely spaced campaigns. Argentina is projected to grow at 6.2% CAGR through 2036 because new horizontal wells expand the population requiring solids-management decisions. The national energy secretariat reported in January 2025 that 2024 oil production rose 11% and Vaca Muerta supplied 54.9% of national oil. Neuquen service capacity and local inventory shorten response time for qualified treatments while pipeline limits and capital discipline can delay planned well starts or disrupt campaign schedules.
- Saudi Arabia is expanding Jafurah and other unconventional programs where long multiwell campaigns place repeatability ahead of one-off chemical pricing. Aramco stated in February 2026 that Jafurah started production in December 2025 and still targets roughly 80% higher sales-gas capacity by 2030 versus 2021. The KSA sand control chemicals sector is projected to record 5.8% CAGR during the assessment period with growth tied to intensive completion programs. Local manufacturing and long-term service agreements improve field support while high-temperature reservoirs and operator approval cycles restrict unqualified formulations during repeated campaigns.
- Offshore gas work in the UAE places sand-control decisions inside long-cycle development plans with narrow installation windows and centralized technical approval. ADNOC approved the SARB Deep Gas development in January 2026 with four offshore wells designed to supply 200 million standard cubic feet per day. Sand control chemicals demand in the UAE is forecast to rise at 5.7% CAGR over the forecast period owing to technically demanding offshore wells. ADNOC's integrated contracting model gives qualified chemistry a repeat route into field programs while marine logistics and late formulation changes raise execution risk.
- Brazil's pre-salt developments keep sand management close to deepwater completion engineering because intervention becomes expensive after subsea production systems enter service. Adoption of sand control chemicals in Brazil is estimated to expand at 5.6% CAGR through 2036 supported by sustained deepwater drilling. ANP reported in August 2026 that pre-salt fields supplied 82% of national production in June and offshore wells produced 98.1% of crude oil. Domestic deepwater service capacity supports qualification work but long logistics chains and project-specific specifications make switching formulations costly for contractors.
- The USA has a large producing-well inventory which shifts commercial screening toward productivity and intervention economics instead of simple rig growth. EIA reported in March 2026 that USA crude production reached a record 13.6 million barrels per day in 2025 and increased 3% from 2024. USA is estimated to post 4.9% CAGR over the forecast period attributable to mature-well work and continued offshore completion activity. Dense service coverage supports treatment trials while artificial lift systems and other production work compete for maintenance budgets which raises the proof required for repeat sand-control treatment.
- Canada's mix of oil sands and conventional wells produces uneven sand-control needs because basin geology and completion practices differ sharply. The Canada Energy Regulator reported in June 2026 that crude oil and equivalent production averaged 5.35 million barrels per day during 2025. Sand control chemical sales in Canada are forecast to expand at 4.8% CAGR by 2036 aided by demand in treatable conventional and offshore wells. Mature service networks ease field execution while remote locations and enhanced oil recovery spending compete with specialized chemistry for inventory and intervention budgets.
- Japan's domestic upstream base is small and sand-control demand therefore concentrates in a limited number of technically specific wells. Japan's sand control chemicals outlook is anticipated to advance at 3.6% CAGR over the assessment period reinforced by selective maintenance and exploration work. METI stated in March 2026 that domestic crude oil supplies roughly 1% of national demand and current production capacity cannot materially expand. Experienced operators provide a route for specialist treatments while the narrow account base limits inventory scale and makes each qualification costly for entrants.
Who are the notable companies in the Sand Control Chemicals Market?
Baker Hughes, Halliburton, SLB, Weatherford, ChampionX (an SLB business), Clariant, Innospec, Nouryon, SNF Group, and TETRA Technologies
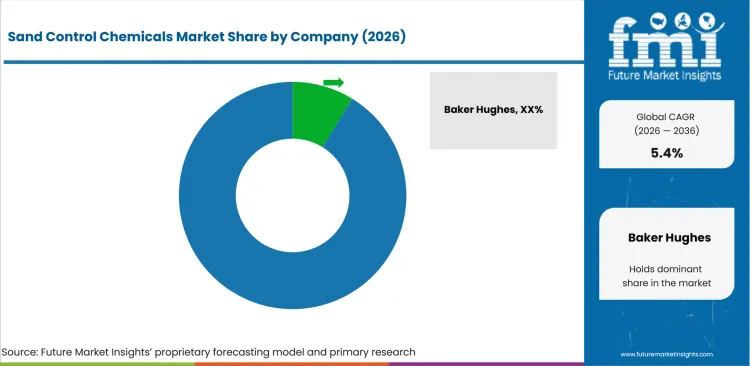
Integrated completion scopes place Baker Hughes and Halliburton beside SLB and Weatherford close to field execution. Specialist chemistry channels include ChampionX and Clariant beside Innospec, Nouryon and SNF Group while TETRA Technologies competes through deepwater completion fluids.
- Integrated completion platforms include Baker Hughes and Halliburton plus SLB and Weatherford because each controls field execution.
- Oilfield chemical specialists include ChampionX and Clariant plus Innospec and Nouryon with SNF Group supporting formulation work.
- TETRA Technologies competes as a completion-fluid specialist with deepwater brines used near sand-control job design and offshore execution.
Competitive Benchmarking: Sand Control Chemicals Market
| Company | Completion-Service Integration | Oilfield Chemistry Participation | Offshore / Deepwater Evidence | Geographic Reach |
|---|---|---|---|---|
| Baker Hughes | High | Medium | High | Global completion-service footprint |
| Halliburton | High | Medium | High | Global completion-service footprint |
| SLB | High | High | High | Global completion and production footprint |
| Weatherford | High | Medium | High | Multi-region completion footprint |
| ChampionX (an SLB business) | Low | High | Medium | SLB production-chemistry channels |
| Clariant | Low | High | High | Multi-region oilfield chemical supply |
| Innospec | Low | High | High | International oilfield chemical operations |
| Nouryon | Low | High | Medium | Global specialty-chemical network |
| SNF Group | Low | High | Medium | Global oilfield chemical network |
| TETRA Technologies | Medium | High | High | North America and international completion-fluid operations |
High completion-service integration requires documented control of completion design and field execution under one service scope. High oilfield chemistry participation requires current production or well-service chemistry evidence and High offshore evidence requires a recent offshore or deepwater action. Medium records narrower documented participation while Low records a documented limited or non-integrated position within the rated criterion.
Key Developments in the Sand Control Chemicals Market
- In July 2026, SLB reported a RemedySlot through-tubing sand-screen intervention that restored a Gulf of America deepwater well shut in because of sand production and avoided full recompletion.
- In May 2026, Halliburton launched the OSTMZ sand-control system for single-trip multizone frac-pack operations in complex wells.
- In April 2026, Weatherford executed a rigless through-tubing sand-control gravel-pack operation in Saudi Arabia and restored a shut-in gas well to sand-free production without a workover rig.
Key Players in the Sand Control Chemicals Market
Integrated completion-service platforms
- Baker Hughes
- Halliburton
- SLB
- Weatherford
Oilfield chemical specialists
- ChampionX (an SLB business)
- Clariant
- Innospec
- Nouryon
- SNF Group
Completion-fluid specialist
- TETRA Technologies
Sand Control Chemicals Market - Report Scope
| Coverage field | Report scope |
|---|---|
| Market breakdown | By chemical type, technique, application, well type, sales channel, and region |
| Quantitative Units | USD billion |
| Market Definition | Revenue includes sand-control chemicals used in completion and well-treatment programs for formation stabilization, sand production control, pack support, cleanup, and permeability protection. Hardware-only screens and packers are excluded. |
| Regions Covered | North America, Latin America, Western Europe, Eastern Europe, East Asia, South Asia and Pacific, and Middle East and Africa |
| Countries Covered | Argentina, KSA, UAE, Brazil, USA, Canada, Japan, and 20+ countries included in the full report |
| Key Companies Profiled | Baker Hughes, Halliburton, SLB, Weatherford, ChampionX (an SLB business), Clariant, Innospec, Nouryon, SNF Group, and TETRA Technologies |
| Forecast Period | 2026 to 2036 |
| Approach | Primary and secondary research with market triangulation |
Sand Control Chemicals Market - Research Methodology
| Method | Approach |
|---|---|
| Primary Research | FMI analysts gathered input from manufacturers, service providers, technology developers, distributors, end users, procurement teams, and subject-matter experts. Interviews examined purchasing decisions, product or service evaluation, adoption barriers, approval requirements, pricing considerations, and expectations for technical or commercial support. Respondents were also asked what evidence is required before a trial, pilot, or initial order develops into regular purchasing. |
| Desk Research | Desk research covered government statistics, regulatory publications, trade data, industry associations, technical literature, standards, company filings, product information, and official corporate announcements. Sources were reviewed for relevance, publication date, geographic coverage, and consistency with the defined market scope. Claims relating to performance, applications, approvals, capacity, investment, and commercial activity were retained only when supported by credible public evidence. |
| Market Sizing and Forecasting | The market model combined the baseline value with historical performance, segment structure, pricing and volume indicators, adoption levels, company participation, and country-level demand conditions. Forecast assumptions considered economic activity, investment trends, regulatory developments, technology adoption, purchasing cycles, supply availability, and barriers to wider market use. Segment and regional estimates were reconciled before the final market total was calculated. |
| Data Validation | Estimates were checked against multiple independent indicators, including public data, company activity, trade patterns, industry developments, and findings from primary interviews. Validation also tested whether products, services, applications, and company revenues fell within the defined market boundaries. Adjacent categories, unsupported claims, overlapping revenues, and activities without direct market relevance were excluded to reduce double counting and maintain consistency across segments and countries. |
Sand Control Chemicals Market by Segments
Sand Control Chemicals Market segmented by Chemical Type:
- Resin consolidation chemicals
- Surfactants
- Clay stabilizers
- Scale inhibitors
- Breaker additives
- Fines migration control
Sand Control Chemicals Market segmented by Technique:
- Gravel pack support
- Frac pack support
- Chemical consolidation
- Standalone screen support
Sand Control Chemicals Market segmented by Application:
- Sand production control
- Formation stabilization
- Completion cleanup
- Permeability retention
Sand Control Chemicals Market segmented by Well Type:
- Offshore
- Onshore
- Deepwater
- Unconsolidated formations
- Mature fields
Sand Control Chemicals Market segmented by Sales Channel:
- Completion service companies
- Oilfield chemical distributors
- Direct operator contracts
- Regional formulators
Sand Control Chemicals Market by Region:
- North America
- United States
- Canada
- Latin America
- Brazil
- Mexico
- Argentina
- Chile
- Western Europe
- Germany
- France
- United Kingdom
- Italy
- Spain
- Benelux
- Nordics
- Eastern Europe
- Poland
- Czech Republic
- Romania
- Hungary
- East Asia
- China
- Japan
- South Korea
- South Asia and Pacific
- India
- ASEAN
- Australia and New Zealand
- Middle East and Africa
- GCC Countries
- South Africa
- Türkiye
- Israel
Research Sources and Bibliography
- Weatherford International plc. (2026, April 21). Weatherford Announces First Quarter 2026 Results
- SLB. (2025, September 25). SLB Awarded Major Completions Contract for Ultra-Deepwater Project Offshore Brazil
- SLB. (2026, July 24). SLB Announces Second-Quarter 2026 Results
- Halliburton. (2026, May 27). Halliburton launches OSTMZ sand control system to streamline multizone completions
- Nouryon. (2025, June 18). Nouryon launches Innovation Center for oilfield solutions in Texas, US
- SLB. (2025, March 31). SLB Awarded Major Drilling Contract by Woodside Energy for Ultra-deepwater Trion Development, Offshore Mexico
- Weatherford International plc. (2026, May 21). Weatherford Awarded Deepwater Integrated Completions Contract with ExxonMobil in Nigeria
- Halliburton. (2026, July 15). Aramco awards Halliburton long-term contract for unconventional gas program
- OSPAR Commission. (2025). OSPAR Guidelines for Completing the Harmonised Offshore Chemical Notification Format (HOCNF). Update 2025
- Baker Hughes. (2026, September 4). Baker Hughes Awarded Offshore Production Enhancement and Stimulation Services Contract by bp
- Secretaría de Energía de Argentina. (2025, January 24). Argentina tuvo un año histórico en la producción de hidrocarburos
- Saudi Aramco. (2026, February 26). Aramco's gas strategy builds momentum with major progress towards growth target
- ADNOC. (2026, January 7). ADNOC announces final investment decision for the SARB Deep Gas Development
- Agência Nacional do Petróleo, Gás Natural e Biocombustíveis. (2026, August 3). ANP divulga dados consolidados da produção de petróleo e gás em junho de 2026
- USA Energy Information Administration. (2026, March 31). USA crude oil production rose in 2025, setting new record
- Canada Energy Regulator. (2026, June 17). Market Snapshot: Canada sets new record in crude oil production in 2025
- Ministry of Economy, Trade and Industry, Japan. (2026, March 27). Press Conference by Minister Akazawa (Excerpt)
- TETRA Technologies, Inc. (2026, June 29). TETRA Technologies Introduces TETRA Neptune Z-Lite Deepwater Completions Fluid
- Clariant. (2025, September 2). Clariant Oil Services and Swire Energy Services open new supply base in Norway supporting European energy production
- Baker Hughes. (2025, March 20). Baker Hughes to Provide Fully Integrated Completions for Petrobras Offshore Fields
- Weatherford International plc. (2026, September 1). Weatherford Completes Acquisition of NCS Multistage
- Halliburton. (2026, July 13). Halliburton wins integrated drilling and completions contract for GranMorgu in Suriname
- Clariant. (2026, July 29). Clariant appoints Gapuma Group as Well Service Additives distributor across West Africa
- Weatherford International plc. (2026, February 12). Weatherford Awarded Multi-Year Integrated Completions Contract in Denmark
- Halliburton. (2025, October 15). Petrobras awards Halliburton deepwater contracts for completion and stimulation in Brazil
- Baker Hughes. (2026, May 26). Baker Hughes Extends and Expands Integrated Well Construction Contract with Petrobras
- Halliburton. (2025, September 9). Halliburton launches SmartWell Turing electro-hydraulic control system for improved reservoir management
- SLB. (2025, January 8). SLB awarded multi-region deepwater contracts by Shell to support capital-efficient energy development
- Weatherford International plc. (2025, April 22). Weatherford Announces First Quarter 2025 Results
- SLB. (2025, July 16). SLB Completes Acquisition of ChampionX
- Clariant. (2025, September 8). Clariant Oil Services launches customer portal for seamless digital access
- Innospec Oilfield Services. (2025, March 24). Innospec Announces LaZuli Product Line for Deepwater Subsea Production
- Nouryon. (2025, February 10). Nouryon opens new office in Al Dhahran to strengthen presence in Saudi Arabia and the Middle East
- SNF Group. (2026, January 2). SNF Group completes the acquisition of the Oil & Gas division of Syensqo
- TETRA Technologies, Inc. (2025, July 29). TETRA Technologies, Inc. Announces Strong Second Quarter 2025 Results and Provides Full Year Guidance
- USA Energy Information Administration. (2025, June 6). Gulf of America oil and natural gas production expected to increase through 2026.
- Journal of Petroleum Technology. (2025, October 1). Sand Management-2025.
- Banashooshtari, H., Khamehchi, E., & Rashidi, F. (2026, January 28). Increasing the compressive strength of a high clay content sandstone reservoir by chemical sand consolidation with minimal permeability reduction. Scientific Reports, 16, 6489.
- Journal of Petroleum Technology. (2025, November 1). Water-Based Reservoir Drill-In Fluid Withstands Extreme Thermal Boundaries.
- Journal of Petroleum Technology. (2025, October 1). Automated Workflow Mitigates Sand Influx by Determining Minimum Tubinghead Pressure.
- Journal of Petroleum Technology. (2025, October 1). Study Analyzes Through-Tubing Sand-Screen Application Offshore Malaysia.
- SLB. (2026, February 12). SLB Awarded Multiple Offshore Drilling Contracts by Mubadala Energy for Tangkulo Deepwater Development in Indonesia.
- SLB. (2026, August 18). SLB to Support Offshore Production Restoration for Brunei Shell Petroleum.
- Innospec Inc. (2026, August 4). Innospec Reports Second Quarter 2026 Financial Results.
The bibliography provides selected reader references while the full report retains the complete source list and detailed citations.
This Report Answers
- How large is the sand control chemicals market in 2026 and what value is projected by 2036?
- Which completion conditions sustain demand for sand control chemicals in offshore and mature wells?
- Why do resin consolidation chemicals account for 24.0% of chemical type demand in 2026?
- How does gravel pack support influence chemistry selected for engineered sand-control completion programs?
- Why does sand production control represent 38.0% of application demand during the 2026 base year?
- How do Argentina and KSA compare with the UAE, Brazil, USA, Canada, and Japan on forecast growth?
- Which companies combine field completion execution with production or well-service chemistry in this market?
- Which technical conditions delay wider use of chemical sand-control treatments beside mechanical systems?
Frequently Asked Questions
How big is the sand control chemicals market in 2026?
The sand control chemicals market is valued at USD 1.1 billion in 2026 and is projected to reach USD 1.9 billion by 2036. Offshore completions and mature-well intervention sustain purchases where produced sand threatens drawdown or equipment life.
What is the CAGR of the sand control chemicals market from 2026 to 2036?
The sand control chemicals market is projected to grow at a CAGR of 5.4% between 2026 and 2036. Expansion depends on completion intensity and remedial treatments that control sand without unacceptable permeability loss or intervention cost.
Which chemical type leads the sand control chemicals market?
The resin consolidation chemicals segment is expected to hold 24.0% of the sand control chemicals market in 2026, attributable to rigless stabilization options for selected unconsolidated formations. Operators still require evidence that grain bonding will preserve productive permeability under intended placement conditions.
Which technique holds the stated 2026 share in the sand control chemicals market?
The gravel pack support segment is expected to hold 31.0% of the sand control chemicals market in 2026, driven by pack programs requiring stable carrier-fluid behavior. Pack placement and cleanup determine whether qualified chemistry can be repeated on comparable wells.
Which companies are active in the sand control chemicals market?
Key companies operating in the market include Baker Hughes, Halliburton, SLB, Weatherford, ChampionX (an SLB business), Clariant, Innospec, Nouryon, SNF Group, and TETRA Technologies. Their roles span integrated completion execution plus oilfield chemistry and deepwater completion-fluid support across several operating regions.
Preview the report firsthand - request a free sample
Get SampleGet the brochure for pricing and purchase details.
Get PDFTable of Content
- Key Takeaways
- Market Size and CAGR
- Top Growth Driver
- Fastest Growing Segment
- Leading Region
- Key Companies
- Emerging Opportunities
- Executive Summary
- Global Market Outlook
- Demand-side Trends
- Supply-side Trends
- Technology Roadmap Analysis
- Analysis and Recommendations
- Analyst Perspective (What is happening? Why now? What should investors know?)
- Key Questions Answered
- How large is the market?
- What is the CAGR?
- What are key trends?
- Which region dominates?
- Who are the leaders?
- Market Overview
- Market Coverage / Taxonomy
- Market Definition / Scope / Limitations
- Research Methodology
- Chapter Orientation
- Analytical Lens and Working Hypotheses
- Market Structure, Signals, and Trend Drivers
- Benchmarking and Cross-market Comparability
- Market Sizing, Forecasting, and Opportunity Mapping
- Research Design and Evidence Framework
- Desk Research Programme (Secondary Evidence)
- Expert Input and Fieldwork (Primary Evidence)
- Tooling, Models, and Reference Databases
- Data Engineering and Model Build
- Quality Assurance and Audit Trail
- Market Background
- Market Dynamics (Drivers, Restraints, Opportunity, Trends)
- Scenario Forecast (Optimistic, Likely, Conservative)
- Impact Analysis
- AI Impact
- Sustainability Impact
- Regulatory Impact
- Technology Impact
- Consumer / Buyer Analysis
- Purchase Drivers
- Adoption Barriers
- Buyer Journey
- Opportunity Map Analysis
- Product Life Cycle Analysis
- Supply Chain Analysis
- Investment Feasibility Matrix
- Value Chain Analysis
- PESTLE and Porter's Analysis
- Regulatory Landscape
- Regional Parent Market Outlook
- Production and Consumption Statistics
- Import and Export Statistics
- Global Market Analysis and Forecast, 2021 to 2036
- Historical Market Size Value (USD Billion) Analysis, 2021 to 2025
- Current and Future Market Size Value (USD Billion) Projections, 2026 to 2036
- Y-o-Y Growth Trend Analysis
- Absolute $ Opportunity Analysis
- Global Market Pricing Analysis, 2021 to 2036
- Global Market Analysis and Forecast, By Chemical Type, 2021 to 2036
- Introduction / Key Findings
- Historical Market Size Value (USD Billion) Analysis By Chemical Type, 2021 to 2025
- Current and Future Market Size Value (USD Billion) Analysis and Forecast By Chemical Type, 2026 to 2036
- Resin consolidation chemicals
- Surfactants
- Clay stabilizers
- Scale inhibitors
- Breaker additives
- Fines migration control
- Resin consolidation chemicals
- Y-o-Y Growth Trend Analysis By Chemical Type, 2021 to 2025
- Absolute $ Opportunity Analysis By Chemical Type, 2026 to 2036
- Global Market Analysis and Forecast, By Technique, 2021 to 2036
- Introduction / Key Findings
- Historical Market Size Value (USD Billion) Analysis By Technique, 2021 to 2025
- Current and Future Market Size Value (USD Billion) Analysis and Forecast By Technique, 2026 to 2036
- Gravel pack support
- Frac pack support
- Chemical consolidation
- Standalone screen support
- Gravel pack support
- Y-o-Y Growth Trend Analysis By Technique, 2021 to 2025
- Absolute $ Opportunity Analysis By Technique, 2026 to 2036
- Global Market Analysis and Forecast, By Application, 2021 to 2036
- Introduction / Key Findings
- Historical Market Size Value (USD Billion) Analysis By Application, 2021 to 2025
- Current and Future Market Size Value (USD Billion) Analysis and Forecast By Application, 2026 to 2036
- Sand production control
- Formation stabilization
- Completion cleanup
- Permeability retention
- Sand production control
- Y-o-Y Growth Trend Analysis By Application, 2021 to 2025
- Absolute $ Opportunity Analysis By Application, 2026 to 2036
- Global Market Analysis and Forecast, By Well Type, 2021 to 2036
- Introduction / Key Findings
- Historical Market Size Value (USD Billion) Analysis By Well Type, 2021 to 2025
- Current and Future Market Size Value (USD Billion) Analysis and Forecast By Well Type, 2026 to 2036
- Offshore
- Onshore
- Deepwater
- Unconsolidated formations
- Mature fields
- Offshore
- Y-o-Y Growth Trend Analysis By Well Type, 2021 to 2025
- Absolute $ Opportunity Analysis By Well Type, 2026 to 2036
- Global Market Analysis and Forecast, By Sales Channel, 2021 to 2036
- Introduction / Key Findings
- Historical Market Size Value (USD Billion) Analysis By Sales Channel, 2021 to 2025
- Current and Future Market Size Value (USD Billion) Analysis and Forecast By Sales Channel, 2026 to 2036
- Completion service companies
- Oilfield chemical distributors
- Direct operator contracts
- Regional formulators
- Completion service companies
- Y-o-Y Growth Trend Analysis By Sales Channel, 2021 to 2025
- Absolute $ Opportunity Analysis By Sales Channel, 2026 to 2036
- Global Market Analysis and Forecast, By Region, 2021 to 2036
- Introduction
- Historical Market Size Value (USD Billion) Analysis By Region, 2021 to 2025
- Current Market Size Value (USD Billion) Analysis and Forecast By Region, 2026 to 2036
- North America
- Latin America
- Western Europe
- Eastern Europe
- East Asia
- South Asia and Pacific
- Middle East & Africa
- Market Attractiveness Analysis By Region
- North America Market Analysis and Forecast, By Country, 2021 to 2036
- Historical Market Size Value (USD Billion) Trend Analysis By Market Taxonomy, 2021 to 2025
- Market Size Value (USD Billion) Forecast By Market Taxonomy, 2026 to 2036
- By Country
- USA
- Canada
- By Chemical Type
- By Technique
- By Application
- By Well Type
- By Sales Channel
- By Country
- Market Attractiveness Analysis
- By Country
- By Chemical Type
- By Technique
- By Application
- By Well Type
- By Sales Channel
- Key Takeaways
- Latin America Market Analysis and Forecast, By Country
- Historical Market Size Value (USD Billion) Trend Analysis By Market Taxonomy, 2021 to 2025
- Market Size Value (USD Billion) Forecast By Market Taxonomy, 2026 to 2036
- By Country
- Brazil
- Mexico
- Chile
- Rest of Latin America
- By Chemical Type
- By Technique
- By Application
- By Well Type
- By Sales Channel
- By Country
- Market Attractiveness Analysis
- By Country
- By Chemical Type
- By Technique
- By Application
- By Well Type
- By Sales Channel
- Key Takeaways
- Western Europe Market Analysis and Forecast, By Country
- Historical Market Size Value (USD Billion) Trend Analysis By Market Taxonomy, 2021 to 2025
- Market Size Value (USD Billion) Forecast By Market Taxonomy, 2026 to 2036
- By Country
- Germany
- UK
- Italy
- Spain
- France
- Nordic
- BENELUX
- Rest of Western Europe
- By Chemical Type
- By Technique
- By Application
- By Well Type
- By Sales Channel
- By Country
- Market Attractiveness Analysis
- By Country
- By Chemical Type
- By Technique
- By Application
- By Well Type
- By Sales Channel
- Key Takeaways
- Eastern Europe Market Analysis and Forecast, By Country
- Historical Market Size Value (USD Billion) Trend Analysis By Market Taxonomy, 2021 to 2025
- Market Size Value (USD Billion) Forecast By Market Taxonomy, 2026 to 2036
- By Country
- Russia
- Poland
- Hungary
- Balkan & Baltic
- Rest of Eastern Europe
- By Chemical Type
- By Technique
- By Application
- By Well Type
- By Sales Channel
- By Country
- Market Attractiveness Analysis
- By Country
- By Chemical Type
- By Technique
- By Application
- By Well Type
- By Sales Channel
- Key Takeaways
- East Asia Market Analysis and Forecast, By Country
- Historical Market Size Value (USD Billion) Trend Analysis By Market Taxonomy, 2021 to 2025
- Market Size Value (USD Billion) Forecast By Market Taxonomy, 2026 to 2036
- By Country
- China
- Japan
- South Korea
- By Chemical Type
- By Technique
- By Application
- By Well Type
- By Sales Channel
- By Country
- Market Attractiveness Analysis
- By Country
- By Chemical Type
- By Technique
- By Application
- By Well Type
- By Sales Channel
- Key Takeaways
- South Asia and Pacific Market Analysis and Forecast, By Country
- Historical Market Size Value (USD Billion) Trend Analysis By Market Taxonomy, 2021 to 2025
- Market Size Value (USD Billion) Forecast By Market Taxonomy, 2026 to 2036
- By Country
- India
- ASEAN
- Australia & New Zealand
- Rest of South Asia and Pacific
- By Chemical Type
- By Technique
- By Application
- By Well Type
- By Sales Channel
- By Country
- Market Attractiveness Analysis
- By Country
- By Chemical Type
- By Technique
- By Application
- By Well Type
- By Sales Channel
- Key Takeaways
- Middle East & Africa Market Analysis and Forecast, By Country
- Historical Market Size Value (USD Billion) Trend Analysis By Market Taxonomy, 2021 to 2025
- Market Size Value (USD Billion) Forecast By Market Taxonomy, 2026 to 2036
- By Country
- Kingdom of Saudi Arabia
- Other GCC Countries
- Türkiye
- South Africa
- Other African Union
- Rest of Middle East & Africa
- By Chemical Type
- By Technique
- By Application
- By Well Type
- By Sales Channel
- By Country
- Market Attractiveness Analysis
- By Country
- By Chemical Type
- By Technique
- By Application
- By Well Type
- By Sales Channel
- Key Takeaways
- Key Countries Market Analysis
- USA
- Pricing Analysis
- Market Share Analysis, 2025
- By Chemical Type
- By Technique
- By Application
- By Well Type
- By Sales Channel
- Canada
- Pricing Analysis
- Market Share Analysis, 2025
- By Chemical Type
- By Technique
- By Application
- By Well Type
- By Sales Channel
- Mexico
- Pricing Analysis
- Market Share Analysis, 2025
- By Chemical Type
- By Technique
- By Application
- By Well Type
- By Sales Channel
- Brazil
- Pricing Analysis
- Market Share Analysis, 2025
- By Chemical Type
- By Technique
- By Application
- By Well Type
- By Sales Channel
- Chile
- Pricing Analysis
- Market Share Analysis, 2025
- By Chemical Type
- By Technique
- By Application
- By Well Type
- By Sales Channel
- Germany
- Pricing Analysis
- Market Share Analysis, 2025
- By Chemical Type
- By Technique
- By Application
- By Well Type
- By Sales Channel
- UK
- Pricing Analysis
- Market Share Analysis, 2025
- By Chemical Type
- By Technique
- By Application
- By Well Type
- By Sales Channel
- Italy
- Pricing Analysis
- Market Share Analysis, 2025
- By Chemical Type
- By Technique
- By Application
- By Well Type
- By Sales Channel
- Spain
- Pricing Analysis
- Market Share Analysis, 2025
- By Chemical Type
- By Technique
- By Application
- By Well Type
- By Sales Channel
- France
- Pricing Analysis
- Market Share Analysis, 2025
- By Chemical Type
- By Technique
- By Application
- By Well Type
- By Sales Channel
- India
- Pricing Analysis
- Market Share Analysis, 2025
- By Chemical Type
- By Technique
- By Application
- By Well Type
- By Sales Channel
- ASEAN
- Pricing Analysis
- Market Share Analysis, 2025
- By Chemical Type
- By Technique
- By Application
- By Well Type
- By Sales Channel
- Australia & New Zealand
- Pricing Analysis
- Market Share Analysis, 2025
- By Chemical Type
- By Technique
- By Application
- By Well Type
- By Sales Channel
- China
- Pricing Analysis
- Market Share Analysis, 2025
- By Chemical Type
- By Technique
- By Application
- By Well Type
- By Sales Channel
- Japan
- Pricing Analysis
- Market Share Analysis, 2025
- By Chemical Type
- By Technique
- By Application
- By Well Type
- By Sales Channel
- South Korea
- Pricing Analysis
- Market Share Analysis, 2025
- By Chemical Type
- By Technique
- By Application
- By Well Type
- By Sales Channel
- Russia
- Pricing Analysis
- Market Share Analysis, 2025
- By Chemical Type
- By Technique
- By Application
- By Well Type
- By Sales Channel
- Poland
- Pricing Analysis
- Market Share Analysis, 2025
- By Chemical Type
- By Technique
- By Application
- By Well Type
- By Sales Channel
- Hungary
- Pricing Analysis
- Market Share Analysis, 2025
- By Chemical Type
- By Technique
- By Application
- By Well Type
- By Sales Channel
- Kingdom of Saudi Arabia
- Pricing Analysis
- Market Share Analysis, 2025
- By Chemical Type
- By Technique
- By Application
- By Well Type
- By Sales Channel
- Türkiye
- Pricing Analysis
- Market Share Analysis, 2025
- By Chemical Type
- By Technique
- By Application
- By Well Type
- By Sales Channel
- South Africa
- Pricing Analysis
- Market Share Analysis, 2025
- By Chemical Type
- By Technique
- By Application
- By Well Type
- By Sales Channel
- USA
- Market Structure Analysis
- Competition Dashboard
- Competition Benchmarking
- Market Share Analysis of Top Players
- By Regional
- By Chemical Type
- By Technique
- By Application
- By Well Type
- By Sales Channel
- Emerging Startups
- Innovation Benchmarking
- Competition Analysis
- Competition Deep Dive
- Baker Hughes
- Overview
- Product Portfolio
- Profitability by Market Segments
- Sales Footprint
- Strategy Overview
- Marketing Strategy
- Product Strategy
- Channel Strategy
- Halliburton
- SLB
- Weatherford
- ChampionX
- Clariant
- Innospec
- Nouryon
- Solvay
- TETRA Technologies
- Baker Hughes
- Case Studies
- Success Stories
- Recent Developments
- Competition Deep Dive
- Assumptions & Acronyms Used


