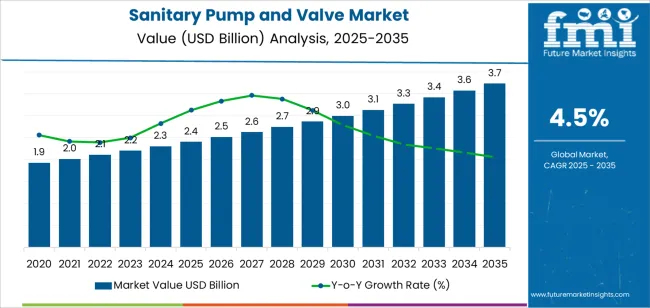
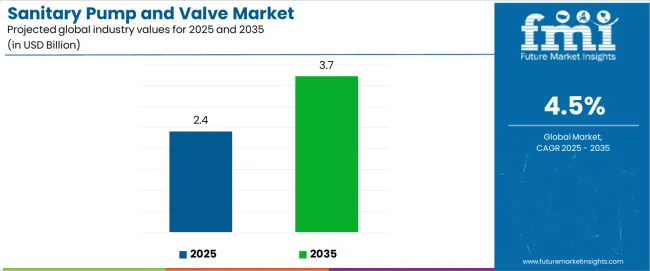
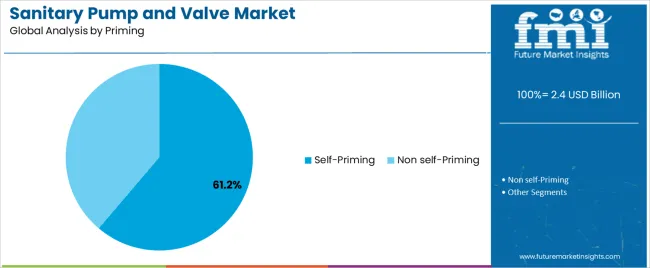
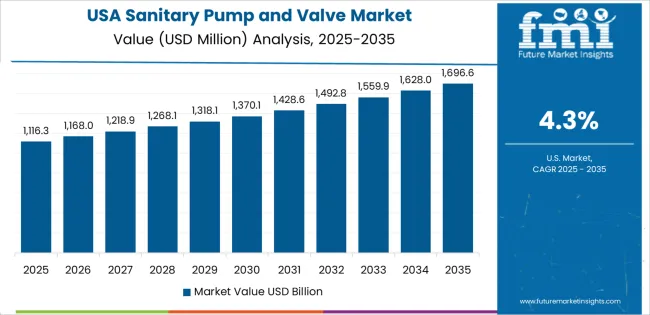
The sanitary pump and valve market had an estimated market share worth USD 2.2 billion in 2023, and it is predicted to reach a global market valuation of USD 3.6 billion by 2034, growing at a CAGR of 4.6% from 2024 to 2034.
Report Attribute | Details |
---|---|
Estimated Market Value in 2023 | USD 2.2 billion |
Expected Market Value in 2024 | USD 2.3 billion |
Projected Forecast Value in 2034 | USD 3.6 billion |
Anticipated Growth Rate from 2024 to 2034 | 4.6% |
The global demand for the sanitary pump and valve market was estimated to reach a valuation of USD 1.7 billion in 2019, according to a report from Future Market Insights (FMI). From 2019 to 2023, the sanitary pump and valve market witnessed significant growth, registering a CAGR of 6.5%.
Historical CAGR 2019 to 2023 | 6.5% |
---|---|
Forecast CAGR 2024 to 2034 | 4.6% |
The application of advanced predictive maintenance technology is a new development in the sanitary pump and valve industry. Manufacturers are now able to anticipate certain equipment problems before they happen, allowing for preventive maintenance and reducing downtime, by utilizing machine learning algorithms and sensor data. This invention is a great asset to the industry as it increases overall dependability, lowers maintenance costs, and boosts operational efficiency.
Artistic Trends that Enhances the Visual Appeal of Sanitary Pump and Valve to Boost Growth
There is a rising demand for sanitary pumps and valves that not only work well but also improve the aesthetics of their surroundings as companies prioritize aesthetics alongside utility.
This tendency is especially noticeable in high end hospitality industries like spas, hotels, and restaurants where patrons want both elegant design and excellent service. To satisfy picky customers, manufacturers are experimenting with innovative design strategies, adding sleek lines, high end finishes, and customizable choices.
Usage of Sanitary Pump and Valve in Space Exploration to be a Huge Market Opportunity
The sanitary pump and valve market has an exceptional opportunity to develop beyond terrestrial applications given the growing interest in space exploration. Small and light pump and valve solutions are crucial for space missions and interplanetary colonies, where weight and volume are important factors.
Manufacturers are pushed to create novel designs that can endure the rigors of space while increasing efficiency and dependability. Companies may put themselves at the pinnacle of space exploration technology by adopting this unconventional driver, creating new opportunities for expansion and cooperation within the aerospace sector.
Cost Fluctuations and Abnormalities in the Supply Chains to Impede the Market Growth
Few restraints of the market are:
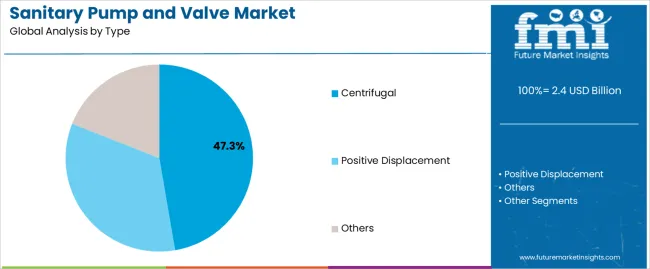
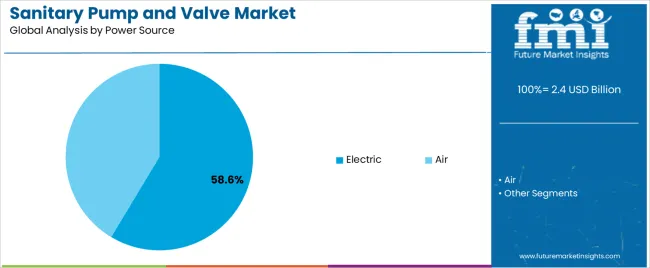
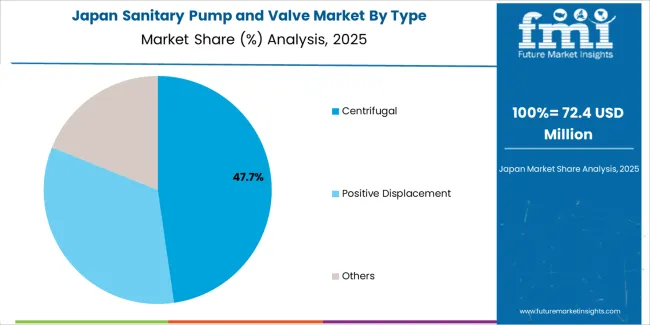
This section focuses on providing detailed analysis of two particular market segments for sanitary pump and valve, the dominant type and the significant power source. The two main segments discussed below are the positive displacement and air power source.
Type | Positive Displacement |
---|---|
Market Share in 2024 | 81.7% |
The positive displacement sanitary pump and valve is anticipated to register a 4.4% CAGR through 2034. Positive displacement sanitary pump and valve are expected to become more popular because of their accurate and reliable fluid handling qualities. This makes them perfect for delicate applications in the food, pharmaceutical, and biotechnology sectors.
By ensuring precise dosage and cautious product handling, these pumps preserve the integrity and quality of the product. Their construction reduces agitation and shear, which is essential for maintaining the delicate properties of delicate fluids and increasing their marketability in the sanitary sector.
Power Source | Air |
---|---|
CAGR from 2024 to 2034 | 4.2% |
From 2024 to 2034, the air power source segment is likely to garner a 4.2% CAGR.
The sanitary pump and valve market is expected to be dominated by air power sources because of their sustainability and adaptability.
They provide dependable and efficient functioning without requiring external power sources, therefore lowering reliance on fuel or electricity. Air power sources are positioned well in the market because they fulfill strict cleanliness requirements and minimize environmental effect, which is in line with the industry's focus on eco-friendly solutions.
This section will go into detail on the sanitary pump and valve markets in a few key countries, including the United States, the United Kingdom, China, Japan and South Korea. This segment will focus on the key factors that are driving up demand in these countries for sanitary pump and valve.
Countries | Forecast CAGR from 2024 to 2034 |
---|---|
The United States | 4.8% |
The United Kingdom | 5.4% |
China | 5.6% |
Japan | 5.9% |
South Korea | 7% |
The United States sanitary pump and valve ecosystem is anticipated to gain a CAGR of 4.8% through 2034. Factors that are bolstering the growth are:
The sanitary pump and valve market in the United Kingdom is expected to expand with a 5.4% CAGR through 2034. The factors pushing the growth are:
The sanitary pump and valve ecosystem in China is anticipated to develop with a 5.6% CAGR from 2024 to 2034. The drivers behind this growth are:
The sanitary pump and valve industry in Japan is anticipated to reach a 5.9% CAGR from 2024 to 2034. The drivers propelling growth forward are:
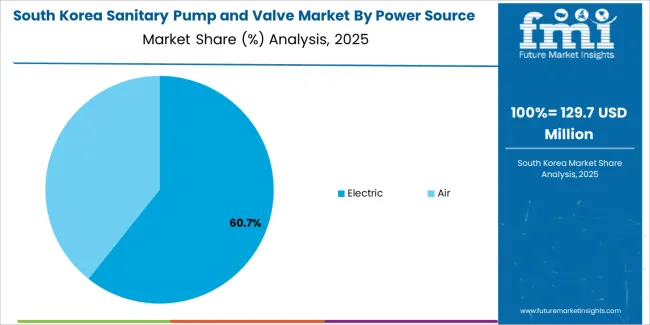
The sanitary pump and valve ecosystem in South Korea is likely to evolve with a 7% CAGR during the forecast period. The factors bolstering the growth are:
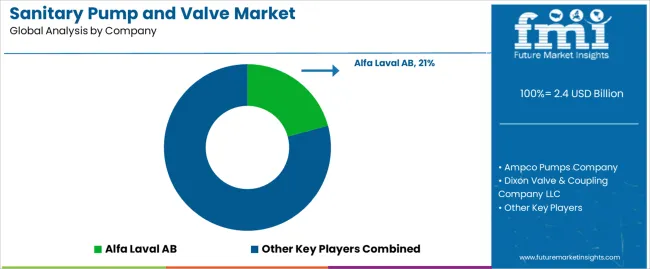
In order to achieve strict hygiene requirements and improve product efficiency and dependability, leading businesses in the global sanitary pump and valve market are embracing innovation via the integration of modern technologies. They guarantee regulatory compliance by concentrating on material and design advancements.
The goal of research and development is to present innovative solutions that are suited to a variety of industrial requirements, such as those in the biotechnology, pharmaceutical, and food and beverage industries. Eco friendly production methods and energy efficient goods are used to highlight sustainability, coupled with customer centric strategies that offer customized solutions and thorough after sales care.
By bringing modern innovations like IoT integration for remote monitoring, predictive maintenance algorithms, and creative materials, startups in the sanitary pump and valve market are disrupting the market. They put agility first, responding to changing market demands with scalable solutions, faster deployment times, and more affordable options than established providers. The key players in this market include:
Significant advancements in the sanitary pump and valve market are being made by key market participants, and these include:
Report Attribute | Details |
---|---|
Growth Rate | CAGR of 4.6% from 2024 to 2034 |
Market value in 2024 | USD 2.3 billion |
Market value in 2034 | USD 3.6 billion |
Base Year for Estimation | 2023 |
Historical Data | 2019 to 2023 |
Forecast Period | 2024 to 2034 |
Quantitative Units | USD billion for value |
Report Coverage | Revenue Forecast, Company Ranking, Competitive Landscape, Growth Factors, Trends, and Pricing Analysis |
Segments Covered | Type, Power Source, Priming, End User Industry, End User |
Region Covered | North America; Latin America; Western Europe; Eastern Europe; South Asia and Pacific; East Asia; Middle East & Africa |
Countries Profiled | The United States, Canada, Brazil, Mexico, Germany, United Kingdom, France, Spain, Italy, Poland, Russia, Czech Republic, Romania, India, Bangladesh, Australia, New Zealand, China, Japan, South Korea, GCC Countries, South Africa, Israel |
Key Companies Profiled | Alfa Laval AB; Ampco Pumps Company; Dixon Valve & Coupling Company LLC; Dover Corporation; GEA Group Aktiengesellschaft; Holland Applied Technologies, Inc.; IDEX Corporation; KSB SE & Co. KGaA; SPX Corporation; Tapflo Group |
Customization Scope | Available on Request |
Table 1: Global Market Value (US$ Million) Forecast by Region, 2019 to 2034
Table 2: Global Market Volume (Units) Forecast by Region, 2019 to 2034
Table 3: Global Market Value (US$ Million) Forecast by Type, 2019 to 2034
Table 4: Global Market Volume (Units) Forecast by Type, 2019 to 2034
Table 5: Global Market Value (US$ Million) Forecast by Power Source, 2019 to 2034
Table 6: Global Market Volume (Units) Forecast by Power Source, 2019 to 2034
Table 7: Global Market Value (US$ Million) Forecast by Priming, 2019 to 2034
Table 8: Global Market Volume (Units) Forecast by Priming, 2019 to 2034
Table 9: Global Market Value (US$ Million) Forecast by End-user Industry, 2019 to 2034
Table 10: Global Market Volume (Units) Forecast by End-user Industry, 2019 to 2034
Table 11: North America Market Value (US$ Million) Forecast by Country, 2019 to 2034
Table 12: North America Market Volume (Units) Forecast by Country, 2019 to 2034
Table 13: North America Market Value (US$ Million) Forecast by Type, 2019 to 2034
Table 14: North America Market Volume (Units) Forecast by Type, 2019 to 2034
Table 15: North America Market Value (US$ Million) Forecast by Power Source, 2019 to 2034
Table 16: North America Market Volume (Units) Forecast by Power Source, 2019 to 2034
Table 17: North America Market Value (US$ Million) Forecast by Priming, 2019 to 2034
Table 18: North America Market Volume (Units) Forecast by Priming, 2019 to 2034
Table 19: North America Market Value (US$ Million) Forecast by End-user Industry, 2019 to 2034
Table 20: North America Market Volume (Units) Forecast by End-user Industry, 2019 to 2034
Table 21: Latin America Market Value (US$ Million) Forecast by Country, 2019 to 2034
Table 22: Latin America Market Volume (Units) Forecast by Country, 2019 to 2034
Table 23: Latin America Market Value (US$ Million) Forecast by Type, 2019 to 2034
Table 24: Latin America Market Volume (Units) Forecast by Type, 2019 to 2034
Table 25: Latin America Market Value (US$ Million) Forecast by Power Source, 2019 to 2034
Table 26: Latin America Market Volume (Units) Forecast by Power Source, 2019 to 2034
Table 27: Latin America Market Value (US$ Million) Forecast by Priming, 2019 to 2034
Table 28: Latin America Market Volume (Units) Forecast by Priming, 2019 to 2034
Table 29: Latin America Market Value (US$ Million) Forecast by End-user Industry, 2019 to 2034
Table 30: Latin America Market Volume (Units) Forecast by End-user Industry, 2019 to 2034
Table 31: Western Europe Market Value (US$ Million) Forecast by Country, 2019 to 2034
Table 32: Western Europe Market Volume (Units) Forecast by Country, 2019 to 2034
Table 33: Western Europe Market Value (US$ Million) Forecast by Type, 2019 to 2034
Table 34: Western Europe Market Volume (Units) Forecast by Type, 2019 to 2034
Table 35: Western Europe Market Value (US$ Million) Forecast by Power Source, 2019 to 2034
Table 36: Western Europe Market Volume (Units) Forecast by Power Source, 2019 to 2034
Table 37: Western Europe Market Value (US$ Million) Forecast by Priming, 2019 to 2034
Table 38: Western Europe Market Volume (Units) Forecast by Priming, 2019 to 2034
Table 39: Western Europe Market Value (US$ Million) Forecast by End-user Industry, 2019 to 2034
Table 40: Western Europe Market Volume (Units) Forecast by End-user Industry, 2019 to 2034
Table 41: Eastern Europe Market Value (US$ Million) Forecast by Country, 2019 to 2034
Table 42: Eastern Europe Market Volume (Units) Forecast by Country, 2019 to 2034
Table 43: Eastern Europe Market Value (US$ Million) Forecast by Type, 2019 to 2034
Table 44: Eastern Europe Market Volume (Units) Forecast by Type, 2019 to 2034
Table 45: Eastern Europe Market Value (US$ Million) Forecast by Power Source, 2019 to 2034
Table 46: Eastern Europe Market Volume (Units) Forecast by Power Source, 2019 to 2034
Table 47: Eastern Europe Market Value (US$ Million) Forecast by Priming, 2019 to 2034
Table 48: Eastern Europe Market Volume (Units) Forecast by Priming, 2019 to 2034
Table 49: Eastern Europe Market Value (US$ Million) Forecast by End-user Industry, 2019 to 2034
Table 50: Eastern Europe Market Volume (Units) Forecast by End-user Industry, 2019 to 2034
Table 51: South Asia and Pacific Market Value (US$ Million) Forecast by Country, 2019 to 2034
Table 52: South Asia and Pacific Market Volume (Units) Forecast by Country, 2019 to 2034
Table 53: South Asia and Pacific Market Value (US$ Million) Forecast by Type, 2019 to 2034
Table 54: South Asia and Pacific Market Volume (Units) Forecast by Type, 2019 to 2034
Table 55: South Asia and Pacific Market Value (US$ Million) Forecast by Power Source, 2019 to 2034
Table 56: South Asia and Pacific Market Volume (Units) Forecast by Power Source, 2019 to 2034
Table 57: South Asia and Pacific Market Value (US$ Million) Forecast by Priming, 2019 to 2034
Table 58: South Asia and Pacific Market Volume (Units) Forecast by Priming, 2019 to 2034
Table 59: South Asia and Pacific Market Value (US$ Million) Forecast by End-user Industry, 2019 to 2034
Table 60: South Asia and Pacific Market Volume (Units) Forecast by End-user Industry, 2019 to 2034
Table 61: East Asia Market Value (US$ Million) Forecast by Country, 2019 to 2034
Table 62: East Asia Market Volume (Units) Forecast by Country, 2019 to 2034
Table 63: East Asia Market Value (US$ Million) Forecast by Type, 2019 to 2034
Table 64: East Asia Market Volume (Units) Forecast by Type, 2019 to 2034
Table 65: East Asia Market Value (US$ Million) Forecast by Power Source, 2019 to 2034
Table 66: East Asia Market Volume (Units) Forecast by Power Source, 2019 to 2034
Table 67: East Asia Market Value (US$ Million) Forecast by Priming, 2019 to 2034
Table 68: East Asia Market Volume (Units) Forecast by Priming, 2019 to 2034
Table 69: East Asia Market Value (US$ Million) Forecast by End-user Industry, 2019 to 2034
Table 70: East Asia Market Volume (Units) Forecast by End-user Industry, 2019 to 2034
Table 71: Middle East and Africa Market Value (US$ Million) Forecast by Country, 2019 to 2034
Table 72: Middle East and Africa Market Volume (Units) Forecast by Country, 2019 to 2034
Table 73: Middle East and Africa Market Value (US$ Million) Forecast by Type, 2019 to 2034
Table 74: Middle East and Africa Market Volume (Units) Forecast by Type, 2019 to 2034
Table 75: Middle East and Africa Market Value (US$ Million) Forecast by Power Source, 2019 to 2034
Table 76: Middle East and Africa Market Volume (Units) Forecast by Power Source, 2019 to 2034
Table 77: Middle East and Africa Market Value (US$ Million) Forecast by Priming, 2019 to 2034
Table 78: Middle East and Africa Market Volume (Units) Forecast by Priming, 2019 to 2034
Table 79: Middle East and Africa Market Value (US$ Million) Forecast by End-user Industry, 2019 to 2034
Table 80: Middle East and Africa Market Volume (Units) Forecast by End-user Industry, 2019 to 2034
Figure 1: Global Market Value (US$ Million) by Type, 2024 to 2034
Figure 2: Global Market Value (US$ Million) by Power Source, 2024 to 2034
Figure 3: Global Market Value (US$ Million) by Priming, 2024 to 2034
Figure 4: Global Market Value (US$ Million) by End-user Industry, 2024 to 2034
Figure 5: Global Market Value (US$ Million) by Region, 2024 to 2034
Figure 6: Global Market Value (US$ Million) Analysis by Region, 2019 to 2034
Figure 7: Global Market Volume (Units) Analysis by Region, 2019 to 2034
Figure 8: Global Market Value Share (%) and BPS Analysis by Region, 2024 to 2034
Figure 9: Global Market Y-o-Y Growth (%) Projections by Region, 2024 to 2034
Figure 10: Global Market Value (US$ Million) Analysis by Type, 2019 to 2034
Figure 11: Global Market Volume (Units) Analysis by Type, 2019 to 2034
Figure 12: Global Market Value Share (%) and BPS Analysis by Type, 2024 to 2034
Figure 13: Global Market Y-o-Y Growth (%) Projections by Type, 2024 to 2034
Figure 14: Global Market Value (US$ Million) Analysis by Power Source, 2019 to 2034
Figure 15: Global Market Volume (Units) Analysis by Power Source, 2019 to 2034
Figure 16: Global Market Value Share (%) and BPS Analysis by Power Source, 2024 to 2034
Figure 17: Global Market Y-o-Y Growth (%) Projections by Power Source, 2024 to 2034
Figure 18: Global Market Value (US$ Million) Analysis by Priming, 2019 to 2034
Figure 19: Global Market Volume (Units) Analysis by Priming, 2019 to 2034
Figure 20: Global Market Value Share (%) and BPS Analysis by Priming, 2024 to 2034
Figure 21: Global Market Y-o-Y Growth (%) Projections by Priming, 2024 to 2034
Figure 22: Global Market Value (US$ Million) Analysis by End-user Industry, 2019 to 2034
Figure 23: Global Market Volume (Units) Analysis by End-user Industry, 2019 to 2034
Figure 24: Global Market Value Share (%) and BPS Analysis by End-user Industry, 2024 to 2034
Figure 25: Global Market Y-o-Y Growth (%) Projections by End-user Industry, 2024 to 2034
Figure 26: Global Market Attractiveness by Type, 2024 to 2034
Figure 27: Global Market Attractiveness by Power Source, 2024 to 2034
Figure 28: Global Market Attractiveness by Priming, 2024 to 2034
Figure 29: Global Market Attractiveness by End-user Industry, 2024 to 2034
Figure 30: Global Market Attractiveness by Region, 2024 to 2034
Figure 31: North America Market Value (US$ Million) by Type, 2024 to 2034
Figure 32: North America Market Value (US$ Million) by Power Source, 2024 to 2034
Figure 33: North America Market Value (US$ Million) by Priming, 2024 to 2034
Figure 34: North America Market Value (US$ Million) by End-user Industry, 2024 to 2034
Figure 35: North America Market Value (US$ Million) by Country, 2024 to 2034
Figure 36: North America Market Value (US$ Million) Analysis by Country, 2019 to 2034
Figure 37: North America Market Volume (Units) Analysis by Country, 2019 to 2034
Figure 38: North America Market Value Share (%) and BPS Analysis by Country, 2024 to 2034
Figure 39: North America Market Y-o-Y Growth (%) Projections by Country, 2024 to 2034
Figure 40: North America Market Value (US$ Million) Analysis by Type, 2019 to 2034
Figure 41: North America Market Volume (Units) Analysis by Type, 2019 to 2034
Figure 42: North America Market Value Share (%) and BPS Analysis by Type, 2024 to 2034
Figure 43: North America Market Y-o-Y Growth (%) Projections by Type, 2024 to 2034
Figure 44: North America Market Value (US$ Million) Analysis by Power Source, 2019 to 2034
Figure 45: North America Market Volume (Units) Analysis by Power Source, 2019 to 2034
Figure 46: North America Market Value Share (%) and BPS Analysis by Power Source, 2024 to 2034
Figure 47: North America Market Y-o-Y Growth (%) Projections by Power Source, 2024 to 2034
Figure 48: North America Market Value (US$ Million) Analysis by Priming, 2019 to 2034
Figure 49: North America Market Volume (Units) Analysis by Priming, 2019 to 2034
Figure 50: North America Market Value Share (%) and BPS Analysis by Priming, 2024 to 2034
Figure 51: North America Market Y-o-Y Growth (%) Projections by Priming, 2024 to 2034
Figure 52: North America Market Value (US$ Million) Analysis by End-user Industry, 2019 to 2034
Figure 53: North America Market Volume (Units) Analysis by End-user Industry, 2019 to 2034
Figure 54: North America Market Value Share (%) and BPS Analysis by End-user Industry, 2024 to 2034
Figure 55: North America Market Y-o-Y Growth (%) Projections by End-user Industry, 2024 to 2034
Figure 56: North America Market Attractiveness by Type, 2024 to 2034
Figure 57: North America Market Attractiveness by Power Source, 2024 to 2034
Figure 58: North America Market Attractiveness by Priming, 2024 to 2034
Figure 59: North America Market Attractiveness by End-user Industry, 2024 to 2034
Figure 60: North America Market Attractiveness by Country, 2024 to 2034
Figure 61: Latin America Market Value (US$ Million) by Type, 2024 to 2034
Figure 62: Latin America Market Value (US$ Million) by Power Source, 2024 to 2034
Figure 63: Latin America Market Value (US$ Million) by Priming, 2024 to 2034
Figure 64: Latin America Market Value (US$ Million) by End-user Industry, 2024 to 2034
Figure 65: Latin America Market Value (US$ Million) by Country, 2024 to 2034
Figure 66: Latin America Market Value (US$ Million) Analysis by Country, 2019 to 2034
Figure 67: Latin America Market Volume (Units) Analysis by Country, 2019 to 2034
Figure 68: Latin America Market Value Share (%) and BPS Analysis by Country, 2024 to 2034
Figure 69: Latin America Market Y-o-Y Growth (%) Projections by Country, 2024 to 2034
Figure 70: Latin America Market Value (US$ Million) Analysis by Type, 2019 to 2034
Figure 71: Latin America Market Volume (Units) Analysis by Type, 2019 to 2034
Figure 72: Latin America Market Value Share (%) and BPS Analysis by Type, 2024 to 2034
Figure 73: Latin America Market Y-o-Y Growth (%) Projections by Type, 2024 to 2034
Figure 74: Latin America Market Value (US$ Million) Analysis by Power Source, 2019 to 2034
Figure 75: Latin America Market Volume (Units) Analysis by Power Source, 2019 to 2034
Figure 76: Latin America Market Value Share (%) and BPS Analysis by Power Source, 2024 to 2034
Figure 77: Latin America Market Y-o-Y Growth (%) Projections by Power Source, 2024 to 2034
Figure 78: Latin America Market Value (US$ Million) Analysis by Priming, 2019 to 2034
Figure 79: Latin America Market Volume (Units) Analysis by Priming, 2019 to 2034
Figure 80: Latin America Market Value Share (%) and BPS Analysis by Priming, 2024 to 2034
Figure 81: Latin America Market Y-o-Y Growth (%) Projections by Priming, 2024 to 2034
Figure 82: Latin America Market Value (US$ Million) Analysis by End-user Industry, 2019 to 2034
Figure 83: Latin America Market Volume (Units) Analysis by End-user Industry, 2019 to 2034
Figure 84: Latin America Market Value Share (%) and BPS Analysis by End-user Industry, 2024 to 2034
Figure 85: Latin America Market Y-o-Y Growth (%) Projections by End-user Industry, 2024 to 2034
Figure 86: Latin America Market Attractiveness by Type, 2024 to 2034
Figure 87: Latin America Market Attractiveness by Power Source, 2024 to 2034
Figure 88: Latin America Market Attractiveness by Priming, 2024 to 2034
Figure 89: Latin America Market Attractiveness by End-user Industry, 2024 to 2034
Figure 90: Latin America Market Attractiveness by Country, 2024 to 2034
Figure 91: Western Europe Market Value (US$ Million) by Type, 2024 to 2034
Figure 92: Western Europe Market Value (US$ Million) by Power Source, 2024 to 2034
Figure 93: Western Europe Market Value (US$ Million) by Priming, 2024 to 2034
Figure 94: Western Europe Market Value (US$ Million) by End-user Industry, 2024 to 2034
Figure 95: Western Europe Market Value (US$ Million) by Country, 2024 to 2034
Figure 96: Western Europe Market Value (US$ Million) Analysis by Country, 2019 to 2034
Figure 97: Western Europe Market Volume (Units) Analysis by Country, 2019 to 2034
Figure 98: Western Europe Market Value Share (%) and BPS Analysis by Country, 2024 to 2034
Figure 99: Western Europe Market Y-o-Y Growth (%) Projections by Country, 2024 to 2034
Figure 100: Western Europe Market Value (US$ Million) Analysis by Type, 2019 to 2034
Figure 101: Western Europe Market Volume (Units) Analysis by Type, 2019 to 2034
Figure 102: Western Europe Market Value Share (%) and BPS Analysis by Type, 2024 to 2034
Figure 103: Western Europe Market Y-o-Y Growth (%) Projections by Type, 2024 to 2034
Figure 104: Western Europe Market Value (US$ Million) Analysis by Power Source, 2019 to 2034
Figure 105: Western Europe Market Volume (Units) Analysis by Power Source, 2019 to 2034
Figure 106: Western Europe Market Value Share (%) and BPS Analysis by Power Source, 2024 to 2034
Figure 107: Western Europe Market Y-o-Y Growth (%) Projections by Power Source, 2024 to 2034
Figure 108: Western Europe Market Value (US$ Million) Analysis by Priming, 2019 to 2034
Figure 109: Western Europe Market Volume (Units) Analysis by Priming, 2019 to 2034
Figure 110: Western Europe Market Value Share (%) and BPS Analysis by Priming, 2024 to 2034
Figure 111: Western Europe Market Y-o-Y Growth (%) Projections by Priming, 2024 to 2034
Figure 112: Western Europe Market Value (US$ Million) Analysis by End-user Industry, 2019 to 2034
Figure 113: Western Europe Market Volume (Units) Analysis by End-user Industry, 2019 to 2034
Figure 114: Western Europe Market Value Share (%) and BPS Analysis by End-user Industry, 2024 to 2034
Figure 115: Western Europe Market Y-o-Y Growth (%) Projections by End-user Industry, 2024 to 2034
Figure 116: Western Europe Market Attractiveness by Type, 2024 to 2034
Figure 117: Western Europe Market Attractiveness by Power Source, 2024 to 2034
Figure 118: Western Europe Market Attractiveness by Priming, 2024 to 2034
Figure 119: Western Europe Market Attractiveness by End-user Industry, 2024 to 2034
Figure 120: Western Europe Market Attractiveness by Country, 2024 to 2034
Figure 121: Eastern Europe Market Value (US$ Million) by Type, 2024 to 2034
Figure 122: Eastern Europe Market Value (US$ Million) by Power Source, 2024 to 2034
Figure 123: Eastern Europe Market Value (US$ Million) by Priming, 2024 to 2034
Figure 124: Eastern Europe Market Value (US$ Million) by End-user Industry, 2024 to 2034
Figure 125: Eastern Europe Market Value (US$ Million) by Country, 2024 to 2034
Figure 126: Eastern Europe Market Value (US$ Million) Analysis by Country, 2019 to 2034
Figure 127: Eastern Europe Market Volume (Units) Analysis by Country, 2019 to 2034
Figure 128: Eastern Europe Market Value Share (%) and BPS Analysis by Country, 2024 to 2034
Figure 129: Eastern Europe Market Y-o-Y Growth (%) Projections by Country, 2024 to 2034
Figure 130: Eastern Europe Market Value (US$ Million) Analysis by Type, 2019 to 2034
Figure 131: Eastern Europe Market Volume (Units) Analysis by Type, 2019 to 2034
Figure 132: Eastern Europe Market Value Share (%) and BPS Analysis by Type, 2024 to 2034
Figure 133: Eastern Europe Market Y-o-Y Growth (%) Projections by Type, 2024 to 2034
Figure 134: Eastern Europe Market Value (US$ Million) Analysis by Power Source, 2019 to 2034
Figure 135: Eastern Europe Market Volume (Units) Analysis by Power Source, 2019 to 2034
Figure 136: Eastern Europe Market Value Share (%) and BPS Analysis by Power Source, 2024 to 2034
Figure 137: Eastern Europe Market Y-o-Y Growth (%) Projections by Power Source, 2024 to 2034
Figure 138: Eastern Europe Market Value (US$ Million) Analysis by Priming, 2019 to 2034
Figure 139: Eastern Europe Market Volume (Units) Analysis by Priming, 2019 to 2034
Figure 140: Eastern Europe Market Value Share (%) and BPS Analysis by Priming, 2024 to 2034
Figure 141: Eastern Europe Market Y-o-Y Growth (%) Projections by Priming, 2024 to 2034
Figure 142: Eastern Europe Market Value (US$ Million) Analysis by End-user Industry, 2019 to 2034
Figure 143: Eastern Europe Market Volume (Units) Analysis by End-user Industry, 2019 to 2034
Figure 144: Eastern Europe Market Value Share (%) and BPS Analysis by End-user Industry, 2024 to 2034
Figure 145: Eastern Europe Market Y-o-Y Growth (%) Projections by End-user Industry, 2024 to 2034
Figure 146: Eastern Europe Market Attractiveness by Type, 2024 to 2034
Figure 147: Eastern Europe Market Attractiveness by Power Source, 2024 to 2034
Figure 148: Eastern Europe Market Attractiveness by Priming, 2024 to 2034
Figure 149: Eastern Europe Market Attractiveness by End-user Industry, 2024 to 2034
Figure 150: Eastern Europe Market Attractiveness by Country, 2024 to 2034
Figure 151: South Asia and Pacific Market Value (US$ Million) by Type, 2024 to 2034
Figure 152: South Asia and Pacific Market Value (US$ Million) by Power Source, 2024 to 2034
Figure 153: South Asia and Pacific Market Value (US$ Million) by Priming, 2024 to 2034
Figure 154: South Asia and Pacific Market Value (US$ Million) by End-user Industry, 2024 to 2034
Figure 155: South Asia and Pacific Market Value (US$ Million) by Country, 2024 to 2034
Figure 156: South Asia and Pacific Market Value (US$ Million) Analysis by Country, 2019 to 2034
Figure 157: South Asia and Pacific Market Volume (Units) Analysis by Country, 2019 to 2034
Figure 158: South Asia and Pacific Market Value Share (%) and BPS Analysis by Country, 2024 to 2034
Figure 159: South Asia and Pacific Market Y-o-Y Growth (%) Projections by Country, 2024 to 2034
Figure 160: South Asia and Pacific Market Value (US$ Million) Analysis by Type, 2019 to 2034
Figure 161: South Asia and Pacific Market Volume (Units) Analysis by Type, 2019 to 2034
Figure 162: South Asia and Pacific Market Value Share (%) and BPS Analysis by Type, 2024 to 2034
Figure 163: South Asia and Pacific Market Y-o-Y Growth (%) Projections by Type, 2024 to 2034
Figure 164: South Asia and Pacific Market Value (US$ Million) Analysis by Power Source, 2019 to 2034
Figure 165: South Asia and Pacific Market Volume (Units) Analysis by Power Source, 2019 to 2034
Figure 166: South Asia and Pacific Market Value Share (%) and BPS Analysis by Power Source, 2024 to 2034
Figure 167: South Asia and Pacific Market Y-o-Y Growth (%) Projections by Power Source, 2024 to 2034
Figure 168: South Asia and Pacific Market Value (US$ Million) Analysis by Priming, 2019 to 2034
Figure 169: South Asia and Pacific Market Volume (Units) Analysis by Priming, 2019 to 2034
Figure 170: South Asia and Pacific Market Value Share (%) and BPS Analysis by Priming, 2024 to 2034
Figure 171: South Asia and Pacific Market Y-o-Y Growth (%) Projections by Priming, 2024 to 2034
Figure 172: South Asia and Pacific Market Value (US$ Million) Analysis by End-user Industry, 2019 to 2034
Figure 173: South Asia and Pacific Market Volume (Units) Analysis by End-user Industry, 2019 to 2034
Figure 174: South Asia and Pacific Market Value Share (%) and BPS Analysis by End-user Industry, 2024 to 2034
Figure 175: South Asia and Pacific Market Y-o-Y Growth (%) Projections by End-user Industry, 2024 to 2034
Figure 176: South Asia and Pacific Market Attractiveness by Type, 2024 to 2034
Figure 177: South Asia and Pacific Market Attractiveness by Power Source, 2024 to 2034
Figure 178: South Asia and Pacific Market Attractiveness by Priming, 2024 to 2034
Figure 179: South Asia and Pacific Market Attractiveness by End-user Industry, 2024 to 2034
Figure 180: South Asia and Pacific Market Attractiveness by Country, 2024 to 2034
Figure 181: East Asia Market Value (US$ Million) by Type, 2024 to 2034
Figure 182: East Asia Market Value (US$ Million) by Power Source, 2024 to 2034
Figure 183: East Asia Market Value (US$ Million) by Priming, 2024 to 2034
Figure 184: East Asia Market Value (US$ Million) by End-user Industry, 2024 to 2034
Figure 185: East Asia Market Value (US$ Million) by Country, 2024 to 2034
Figure 186: East Asia Market Value (US$ Million) Analysis by Country, 2019 to 2034
Figure 187: East Asia Market Volume (Units) Analysis by Country, 2019 to 2034
Figure 188: East Asia Market Value Share (%) and BPS Analysis by Country, 2024 to 2034
Figure 189: East Asia Market Y-o-Y Growth (%) Projections by Country, 2024 to 2034
Figure 190: East Asia Market Value (US$ Million) Analysis by Type, 2019 to 2034
Figure 191: East Asia Market Volume (Units) Analysis by Type, 2019 to 2034
Figure 192: East Asia Market Value Share (%) and BPS Analysis by Type, 2024 to 2034
Figure 193: East Asia Market Y-o-Y Growth (%) Projections by Type, 2024 to 2034
Figure 194: East Asia Market Value (US$ Million) Analysis by Power Source, 2019 to 2034
Figure 195: East Asia Market Volume (Units) Analysis by Power Source, 2019 to 2034
Figure 196: East Asia Market Value Share (%) and BPS Analysis by Power Source, 2024 to 2034
Figure 197: East Asia Market Y-o-Y Growth (%) Projections by Power Source, 2024 to 2034
Figure 198: East Asia Market Value (US$ Million) Analysis by Priming, 2019 to 2034
Figure 199: East Asia Market Volume (Units) Analysis by Priming, 2019 to 2034
Figure 200: East Asia Market Value Share (%) and BPS Analysis by Priming, 2024 to 2034
Figure 201: East Asia Market Y-o-Y Growth (%) Projections by Priming, 2024 to 2034
Figure 202: East Asia Market Value (US$ Million) Analysis by End-user Industry, 2019 to 2034
Figure 203: East Asia Market Volume (Units) Analysis by End-user Industry, 2019 to 2034
Figure 204: East Asia Market Value Share (%) and BPS Analysis by End-user Industry, 2024 to 2034
Figure 205: East Asia Market Y-o-Y Growth (%) Projections by End-user Industry, 2024 to 2034
Figure 206: East Asia Market Attractiveness by Type, 2024 to 2034
Figure 207: East Asia Market Attractiveness by Power Source, 2024 to 2034
Figure 208: East Asia Market Attractiveness by Priming, 2024 to 2034
Figure 209: East Asia Market Attractiveness by End-user Industry, 2024 to 2034
Figure 210: East Asia Market Attractiveness by Country, 2024 to 2034
Figure 211: Middle East and Africa Market Value (US$ Million) by Type, 2024 to 2034
Figure 212: Middle East and Africa Market Value (US$ Million) by Power Source, 2024 to 2034
Figure 213: Middle East and Africa Market Value (US$ Million) by Priming, 2024 to 2034
Figure 214: Middle East and Africa Market Value (US$ Million) by End-user Industry, 2024 to 2034
Figure 215: Middle East and Africa Market Value (US$ Million) by Country, 2024 to 2034
Figure 216: Middle East and Africa Market Value (US$ Million) Analysis by Country, 2019 to 2034
Figure 217: Middle East and Africa Market Volume (Units) Analysis by Country, 2019 to 2034
Figure 218: Middle East and Africa Market Value Share (%) and BPS Analysis by Country, 2024 to 2034
Figure 219: Middle East and Africa Market Y-o-Y Growth (%) Projections by Country, 2024 to 2034
Figure 220: Middle East and Africa Market Value (US$ Million) Analysis by Type, 2019 to 2034
Figure 221: Middle East and Africa Market Volume (Units) Analysis by Type, 2019 to 2034
Figure 222: Middle East and Africa Market Value Share (%) and BPS Analysis by Type, 2024 to 2034
Figure 223: Middle East and Africa Market Y-o-Y Growth (%) Projections by Type, 2024 to 2034
Figure 224: Middle East and Africa Market Value (US$ Million) Analysis by Power Source, 2019 to 2034
Figure 225: Middle East and Africa Market Volume (Units) Analysis by Power Source, 2019 to 2034
Figure 226: Middle East and Africa Market Value Share (%) and BPS Analysis by Power Source, 2024 to 2034
Figure 227: Middle East and Africa Market Y-o-Y Growth (%) Projections by Power Source, 2024 to 2034
Figure 228: Middle East and Africa Market Value (US$ Million) Analysis by Priming, 2019 to 2034
Figure 229: Middle East and Africa Market Volume (Units) Analysis by Priming, 2019 to 2034
Figure 230: Middle East and Africa Market Value Share (%) and BPS Analysis by Priming, 2024 to 2034
Figure 231: Middle East and Africa Market Y-o-Y Growth (%) Projections by Priming, 2024 to 2034
Figure 232: Middle East and Africa Market Value (US$ Million) Analysis by End-user Industry, 2019 to 2034
Figure 233: Middle East and Africa Market Volume (Units) Analysis by End-user Industry, 2019 to 2034
Figure 234: Middle East and Africa Market Value Share (%) and BPS Analysis by End-user Industry, 2024 to 2034
Figure 235: Middle East and Africa Market Y-o-Y Growth (%) Projections by End-user Industry, 2024 to 2034
Figure 236: Middle East and Africa Market Attractiveness by Type, 2024 to 2034
Figure 237: Middle East and Africa Market Attractiveness by Power Source, 2024 to 2034
Figure 238: Middle East and Africa Market Attractiveness by Priming, 2024 to 2034
Figure 239: Middle East and Africa Market Attractiveness by End-user Industry, 2024 to 2034
Figure 240: Middle East and Africa Market Attractiveness by Country, 2024 to 2034
The sanitary pump and valve market is expected to garner a 4.6% CAGR from 2024 to 2034.
By 2024, the global sanitary pump and valve market is likely to gain USD 2.3 billion.
By 2034, the sanitary pump and valve market valuation is likely to reach a sum of USD 3.6 billion.
The sanitary pump and valve industry in the United States is likely to garner a 4.8% CAGR during the forecast period.
The highly preferred power source is likely to be air in the sanitary pump and valve market, with an anticipated 4.2% CAGR through 2034.
The positive displacement sanitary pump and valve will gain traction in 2024, with an anticipated 4.4% CAGR through 2034.
Explore Similar Insights
Thank you!
You will receive an email from our Business Development Manager. Please be sure to check your SPAM/JUNK folder too.