Reports

- Global Locations -

Headquarters

Future Market Insights, Inc.

Christiana Corporate, 200
Continental Drive, Suite 401,
Newark, Delaware - 19713,
United States

T: +1-845-579-5705

Americas

Future Market Insights, Inc.

616 Corporate Way, Suite 2-9018,
Valley Cottage, NY 10989, United States

T: +1-347-918-3531

MEA

Future Market Insights

1602-6 Jumeirah Bay X2 Tower, Plot No: JLT-PH2-X2A,
Jumeirah Lakes Towers, Dubai,
United Arab Emirates

Europe

Future Market Insights

3rd Floor, 207 Regent Street,
W1B 3HH London
United Kingdom

T: + 44 (0) 20 8123 9659
D: +44 (0) 20 3287 4268

Asia Pacific

Future Market Insights

IndiaLand Global Tech Park, Unit UG-1, Behind Grand HighStreet, Phase 1, Hinjawadi, MH, Pune – 411057, India

Scaffold Technology Market Snapshot (2023 to 2033)

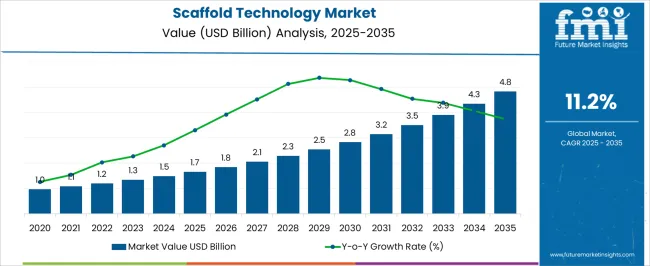
Newly-released Scaffold Technology industry analysis report by Future Market Insights shows that global sales of Scaffold Technology in 2021 were held at US$ 1 billion. With a CAGR of 11.3% from 2022 to 2032, the market is projected to reach a valuation of US$ 3.3 billion by 2032. Stem Cell Therapy, Regenerative Medicine, & Tissue Engineering is expected to be the highest revenue-generating application, accounting for an absolute dollar opportunity of nearly US$ 2.2 million from 2022 to 2032.

Attribute Details
Global Scaffold Technology Market (2022) US$ 1.2 billion
Global Scaffold Technology Market (2032) US$ 3.3 billion
Global Scaffold Technology Market CAGR (2022 to 2032) 11.3%
USA Scaffold Technology Market CAGR (2022 to 2032) 11.5%
Key Companies Profiled
  • Thermo Fisher Scientific, Inc.
  • Merck KGaA
  • Tecan Trading AG
  • REPROCELL Inc.
  • 3D Biotek LLC
  • Becton, Dickinson, and Company
  • Medtronic
  • Xanofi
  • Molecular Matrix, Inc.
  • Matricel GmbH
  • Pelobiotech
  • 4titude
  • Corning Incorporated
  • Akron Biotech
  • Bioquote Ltd
  • Avacta Life Sciences Limited
  • Nanofiber Solutions
  • Vericel Corporation
  • NuVasive, Inc.
  • Allergan

Don't pay for what you don't need

Customize your report by selecting specific countries or regions and save 30%!

Revenue of Scaffold Technology from 2017 to 2021 Compared to Demand Outlook for 2022 to 2032

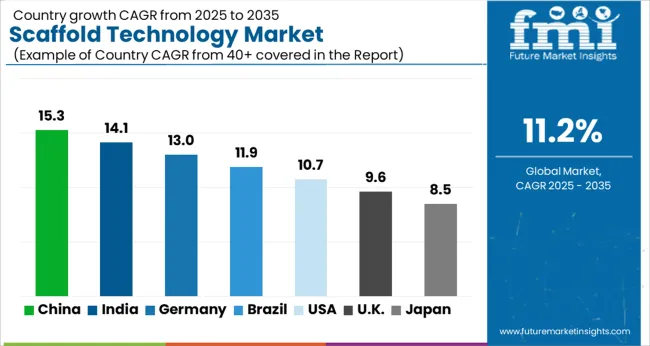
As per the Scaffold Technology industry research by Future Market Insights - a market research and competitive intelligence provider, historically, from 2017 to 2021, the market value of the Scaffold Technology industry increased at around 9.6% CAGR, wherein, countries such as the USA, United Kingdom, China, South Korea, and Japan held a significant share in the global market. Owing to this, the Scaffold Technology market is projected to grow at a CAGR of 11.3% over the coming 10 years.

Which factors are leading to the growth of the Scaffold Technology Industry?

The increased need for 3D cellular models in biomedical research and translational research is primarily responsible for the market's rise. The market for scaffold technology is predicted to rise owing to the quick shift in the cell culture paradigm to address the obstacles associated with the drug development cycle.

3D cell cultures are becoming increasingly popular due to their capacity to mimic in vivo physiological states for an accurate depiction of microenvironmental variables playing a role in the onset of disease. 3D cell culture approaches have been revealed as a useful platform for early clinical research and the development of potential therapeutics for a variety of health issues.

By providing information about diseased cells and driving the market, the healthcare industry's 3D cell cultivation concept promotes the examination of phenotypic heterogeneity of cancer cells and heterotypic communication between cells.

Furthermore, recent important advances in tissue regeneration engineering have enhanced the use of 3D bioprinting for tissue and organ regeneration treatments. The 3D bioprinting process, in which genetic material is directly produced onto scaffolds that may require cell seeding, is regarded as one of the most profitable progress in the area of regenerative medicine.

New 3D bio-printed personalized scaffolds for tissue repair are being developed by companies. For example, in November 2020, CELLINK GLOBAL joined the TRIANKLE partnership to develop innovative individualized gelatine & collagen-based implants for ankle joint tissue regeneration using 3D printing technology. Owing to these factors, the market for scaffold technology is being driven by the introduction of digital technologies for the tissue restoration process.

Sabyasachi Ghosh
Sabyasachi Ghosh

Principal Consultant

Talk to Analyst

Find your sweet spots for generating winning opportunities in this market.

Regional Analysis

Which Region holds the largest opportunity in the coming ten years for Scaffold Technology?

Demand for scaffold technology throughout the forecast period is projected to increase at a healthy rate in the Asia Pacific. Specialists engaged in research and advancement with regard to regenerative medicine and stem cell are expected to boost the forecast's growth.

In India, in addition to the Indian Council of Medical Research and the Ministry of Science and Technology, stem cell biology and regenerative medicine research are prioritized. In addition, the National Centre for Cell Science's research in stem cell biology and other advanced therapy fields is predicted to continue to increase the usefulness of scaffolds throughout India.

Country-wise Analysis

USA Scaffold Technology Market Analysis

In 2021, the United States dominated the scaffold technology market with over 40% of total revenue. The presence of significant companies including Akron Biotech, 3D Biotek LLC, Thermo Fisher Scientific Inc., Molecular Matrix Inc., Xanofi, and Corning Incorporated is propelling the region's growth. Additionally, enterprises in this region are inventing new and innovative solutions to aid in the creation of 3D cell culture, which is beneficial to the growth of the market in the country.

United Kingdom Scaffold Technology Market Analysis

The market in the United Kingdom is expected to reach a valuation of US$ 1.2 billion by 2032. Growing at a CAGR of 11.5%, the market in the country is projected to gross an absolute dollar opportunity of US$ 786 million, during the forecast period.

Japan Scaffold Technology Market Analysis

In Japan, the market is projected to reach US$ 137 million by 2032. With a CAGR of 11.8%, the market is likely to gross an absolute dollar opportunity of US$ 92 million from 2022 to 2032.

South Korea Scaffold Technology Market Analysis

The market in South Korea is expected to reach US$ 82 million by 2032. The market in the country is expected to garner an absolute dollar opportunity of US$ 56 million, growing at a CAGR of 12.4% during the forecast period.

Get the data you need at a Fraction of the cost

Personalize your report by choosing insights you need
and save 40%!

Category-wise Insights

Why did stem cell therapy, regenerative medicine, and tissue engineering dominate the market for Scaffold Technology as an application type?

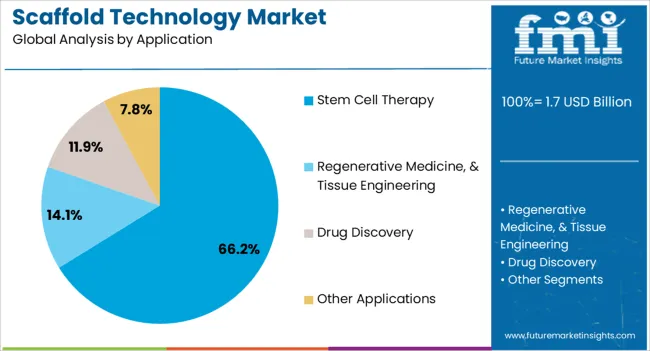
The scaffold technology market was dominated by the stem cell treatment, regenerative medicine, and tissue engineering sector in 2021, accounting for more than 66% of total revenue. Scaffold technology is being utilized increasingly frequently in reconstructive surgeries, aesthetic surgeries, soft tissue tumor repair, abdominal wall repair, periodontology, and colorectal treatments, which is propelling the industry forward.

Furthermore, in recent years, researchers have become increasingly interested in the widespread use of scaffold technologies in the field of regenerative medicine. Wake Forest Institute for Regenerative Medicine (WFIRM) scientists, for example, introduced a hybrid tissue structure that can be used for cartilage regeneration in November 2020. It was created with the use of 3D bioprinting technology. As a result, the expanding research into tissue development can be ascribed to segment expansion.

Why does the Market Grosses Most Revenue through Orthopedics, Musculoskeletal, and Spine Diseases?

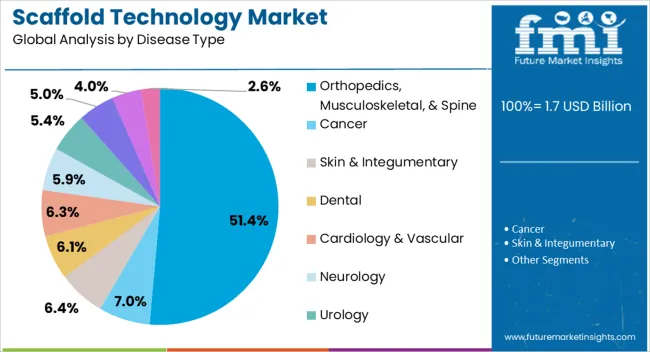
The market for scaffold technology generates the highest revenue through orthopedics, musculoskeletal, and spine diseases, accounting for more than 50% of the total revenue. Annually, about 34 million musculoskeletal procedures are estimated to be done in the United States. As a result, regenerative therapies are gaining traction as low-risk alternatives to allograft surgery.

Because of the widespread use of stem cell therapy and regenerative medicine for the treatment of neurological illnesses, the neurology segment is predicted to grow at the fastest pace from 2022 to 2032. In addition, experts are working on new nerve regeneration scaffolds, which will further boost the market growth.

Competitive Analysis

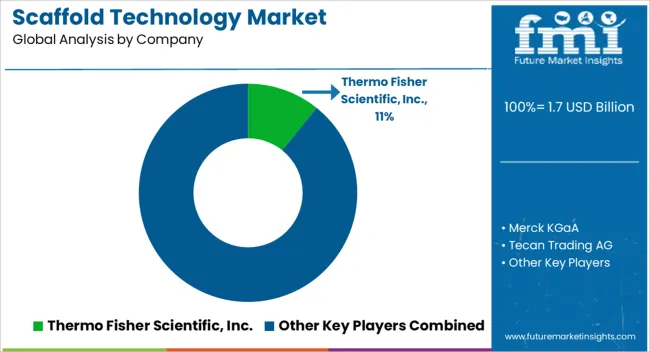
The key players such as Thermo Fisher Scientific, Inc., Merck KGaA, Tecan Trading AG, REPROCELL Inc., 3D Biotek LLC, Becton, Dickinson, and Company, Medtronic, Xanofi, Molecular Matrix, Inc., Matricel GmbH, Pelobiotech, 4titude, Corning Incorporated, Akron Biotech, Bioquote Ltd., Avacta Life Sciences Limited, Nanofiber Solutions, Vericel Corporation, NuVasive, Inc., and Allergan.

Some of the recent developments of key Scaffold Technology providers are as follows:

  • In January 2021, researchers developed a bioactive scaffold based on immobilized nerve growth factor and polycaprolactone chitosan nanofibers for assisting nerve regeneration. This scaffolding will enhance cell adhesion and nerve cell proliferation.
  • In December 2020, eNuvio, a Canadian firm, launched a reusable 3D cell culture microplate. The microplate's unusual geometry facilitated the development of high reproducibility and allows for high-quality optical observation.
  • In April 2020, Ligandal developed a peptide scaffold as a potential antidote and vaccination for COVID-19.

Similarly, recent developments related to companies offering Scaffold Technology have been tracked by the team at Future Market Insights, which are available in the full report.

Market Segments Covered in Scaffold Technology Industry Analysis

By Product Type:

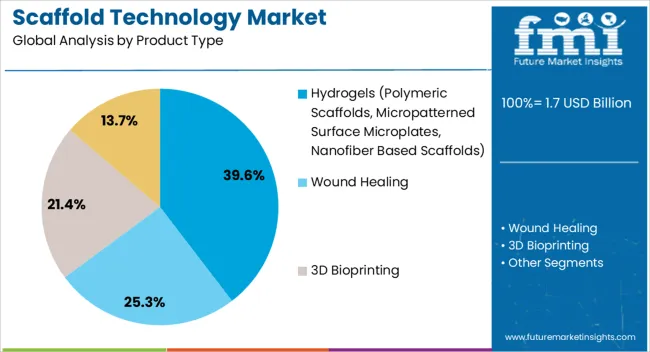
  • Hydrogels
    • Polymeric Scaffolds
    • Micropatterned Surface Microplates
    • Nanofiber Based Scaffolds
  • Wound Healing
  • 3D Bioprinting
  • Immunomodulation

By Application:

  • Stem Cell Therapy, Regenerative Medicine, & Tissue Engineering
  • Drug Discovery
  • Other Applications

By Disease Type:

  • Orthopedics, Musculoskeletal, & Spine
  • Cancer
  • Skin & Integumentary
  • Dental
  • Cardiology & Vascular
  • Neurology
  • Urology
  • GI, Gynecology
  • Other Disease Types

By End-use:

  • Biotechnology and Pharmaceutical Industries
  • Research Laboratories and Institutes
  • Hospitals and Diagnostic Centers
  • Other End-uses

Frequently Asked Questions

How much is the current worth of the Scaffold Technology market?

The global Scaffold Technology market is worth more than US$ 1 Billion at present.

What is the sales forecast for Scaffold Technology?

The value of Scaffold Technology is projected to increase at a CAGR of around 11.3% from 2022 to 2032.

What was the last 5 year’s market CAGR?

The value of Scaffold Technology increased at a CAGR of around 9.6% from 2017 to 2021.

What is driving revenue for Scaffold Technology?

Increasing adoption for 3D cellular models in translational research, rising demand for body reconstruction surgeries and tissue engineering, and technological advancements in scaffold technology are all propelling the scaffold technology market forward.

What are the top five players in the Scaffold Technology market?

The top five players in the Scaffold Technology market include Merck KGaA, Thermo Fisher Scientific Inc., Becton, Dickinson And Company, 3D Biotek LLC, and Molecular Matrix Inc.

Which are the top 5 countries driving demand for Scaffold Technology?

The top 5 countries driving demand for Scaffold Technology are the USA, United Kingdom, China, Japan, and South Korea

What is the outlook for the market in North America?

North America accounted for over 40% of global Scaffold Technology demand in 2021.

At what percentage is sales of Scaffold Technology going to register growth in UK?

The United Kingdom market for Scaffold Technology is projected to expand at a CAGR of around 11% from 2022 to 2032.

Table of Content

1. Executive Summary | Scaffold Technology Market

    1.1. Global Market Outlook

    1.2. Demand-side Trends

    1.3. Supply-side Trends

    1.4. Technology Roadmap Analysis

    1.5. Analysis and Recommendations

2. Market Overview

    2.1. Market Coverage / Taxonomy

    2.2. Market Definition / Scope / Limitations

3. Market Background

    3.1. Market Dynamics

        3.1.1. Drivers

        3.1.2. Restraints

        3.1.3. Opportunity

        3.1.4. Trends

    3.2. Scenario Forecast

        3.2.1. Demand in Optimistic Scenario

        3.2.2. Demand in Likely Scenario

        3.2.3. Demand in Conservative Scenario

    3.3. Opportunity Map Analysis

    3.4. Investment Feasibility Matrix

    3.5. Value Chain Analysis

        3.5.1. Profit Margin Analysis

        3.5.2. Service Providers

    3.6. PESTLE and Porter’s Analysis

    3.7. Regulatory Landscape

        3.7.1. By Key Regions

        3.7.2. By Key Countries

    3.8. Regional Parent Market Outlook

4. Global Market Analysis 2017 to 2021 and Forecast, 2022 to 2032

    4.1. Historical Market Size Value (US$ billion) Analysis, 2017 to 2021

    4.2. Current and Future Market Size Value (US$ billion) Projections, 2022 to 2032

        4.2.1. Y-o-Y Growth Trend Analysis

        4.2.2. Absolute $ Opportunity Analysis

5. Global Market Analysis 2017 to 2021 and Forecast 2022 to 2032, By Product Type

    5.1. Introduction / Key Findings

    5.2. Historical Market Size Value (US$ billion) Analysis By Product Type, 2017 to 2021

    5.3. Current and Future Market Size Value (US$ billion) Analysis and Forecast By Product Type, 2022 to 2032

        5.3.1. Hydrogels

            5.3.1.1. Polymeric Scaffolds

            5.3.1.2. Micropatterned Surface Microplates

            5.3.1.3. Nanofiber Based Scaffolds

        5.3.2. Wound Healing

        5.3.3. 3D Bioprinting

        5.3.4. Immunomodulation

    5.4. Y-o-Y Growth Trend Analysis By Product Type, 2017 to 2021

    5.5. Absolute $ Opportunity Analysis By Product Type, 2022 to 2032

6. Global Market Analysis 2017 to 2021 and Forecast 2022 to 2032, By Application

    6.1. Introduction / Key Findings

    6.2. Historical Market Size Value (US$ billion) Analysis By Application, 2017 to 2021

    6.3. Current and Future Market Size Value (US$ billion) Analysis and Forecast By Application, 2022 to 2032

        6.3.1. Stem Cell Therapy, Regenerative Medicine, & Tissue Engineering

        6.3.2. Drug Discovery

        6.3.3. Other Applications

    6.4. Y-o-Y Growth Trend Analysis By Application, 2017 to 2021

    6.5. Absolute $ Opportunity Analysis By Application, 2022 to 2032

7. Global Market Analysis 2017 to 2021 and Forecast 2022 to 2032, By Disease Type

    7.1. Introduction / Key Findings

    7.2. Historical Market Size Value (US$ billion) Analysis By Disease Type, 2017 to 2021

    7.3. Current and Future Market Size Value (US$ billion) Analysis and Forecast By Disease Type, 2022 to 2032

        7.3.1. Orthopedics, Musculoskeletal, & Spine

        7.3.2. Cancer

        7.3.3. Skin & Integumentary

        7.3.4. Dental

        7.3.5. Cardiology & Vascular

        7.3.6. Neurology

        7.3.7. Urology

        7.3.8. GI, Gynecology

        7.3.9. Other Disease Types

    7.4. Y-o-Y Growth Trend Analysis By Disease Type, 2017 to 2021

    7.5. Absolute $ Opportunity Analysis By Disease Type, 2022 to 2032

8. Global Market Analysis 2017 to 2021 and Forecast 2022 to 2032, By End-use

    8.1. Introduction / Key Findings

    8.2. Historical Market Size Value (US$ billion) Analysis By End-use, 2017 to 2021

    8.3. Current and Future Market Size Value (US$ billion) Analysis and Forecast By End-use, 2022 to 2032

        8.3.1. Biotechnology and Pharmaceutical Industries

        8.3.2. Research Laboratories and Institutes

        8.3.3. Hospitals and Diagnostic Centers

        8.3.4. Other End-uses

    8.4. Y-o-Y Growth Trend Analysis By End-use, 2017 to 2021

    8.5. Absolute $ Opportunity Analysis By End-use, 2022 to 2032

9. Global Market Analysis 2017 to 2021 and Forecast 2022 to 2032, By Region

    9.1. Introduction

    9.2. Historical Market Size Value (US$ billion) Analysis By Region, 2017 to 2021

    9.3. Current Market Size Value (US$ billion) Analysis and Forecast By Region, 2022 to 2032

        9.3.1. North America

        9.3.2. Latin America

        9.3.3. Europe

        9.3.4. Asia Pacific

        9.3.5. Middle East and Africa (MEA)

    9.4. Market Attractiveness Analysis By Region

10. North America Market Analysis 2017 to 2021 and Forecast 2022 to 2032, By Country

    10.1. Historical Market Size Value (US$ billion) Trend Analysis By Market Taxonomy, 2017 to 2021

    10.2. Market Size Value (US$ billion) Forecast By Market Taxonomy, 2022 to 2032

        10.2.1. By Country

            10.2.1.1. Value (US$ billion)ed States

            10.2.1.2. Canada

        10.2.2. By Product Type

        10.2.3. By Application

        10.2.4. By Disease Type

        10.2.5. By End-use

    10.3. Market Attractiveness Analysis

        10.3.1. By Country

        10.3.2. By Product Type

        10.3.3. By Application

        10.3.4. By Disease Type

        10.3.5. By End-use

    10.4. Key Takeaways

11. Latin America Market Analysis 2017 to 2021 and Forecast 2022 to 2032, By Country

    11.1. Historical Market Size Value (US$ billion) Trend Analysis By Market Taxonomy, 2017 to 2021

    11.2. Market Size Value (US$ billion) Forecast By Market Taxonomy, 2022 to 2032

        11.2.1. By Country

            11.2.1.1. Brazil

            11.2.1.2. Mexico

            11.2.1.3. Rest of Latin America

        11.2.2. By Product Type

        11.2.3. By Application

        11.2.4. By Disease Type

        11.2.5. By End-use

    11.3. Market Attractiveness Analysis

        11.3.1. By Country

        11.3.2. By Product Type

        11.3.3. By Application

        11.3.4. By Disease Type

        11.3.5. By End-use

    11.4. Key Takeaways

12. Europe Market Analysis 2017 to 2021 and Forecast 2022 to 2032, By Country

    12.1. Historical Market Size Value (US$ billion) Trend Analysis By Market Taxonomy, 2017 to 2021

    12.2. Market Size Value (US$ billion) Forecast By Market Taxonomy, 2022 to 2032

        12.2.1. By Country

            12.2.1.1. Germany

            12.2.1.2. The United Kingdom

            12.2.1.3. France

            12.2.1.4. Spain

            12.2.1.5. Italy

            12.2.1.6. Russia

            12.2.1.7. Rest of Europe

        12.2.2. By Product Type

        12.2.3. By Application

        12.2.4. By Disease Type

        12.2.5. By End-use

    12.3. Market Attractiveness Analysis

        12.3.1. By Country

        12.3.2. By Product Type

        12.3.3. By Application

        12.3.4. By Disease Type

        12.3.5. By End-use

    12.4. Key Takeaways

13. Asia Pacific Market Analysis 2017 to 2021 and Forecast 2022 to 2032, By Country

    13.1. Historical Market Size Value (US$ billion) Trend Analysis By Market Taxonomy, 2017 to 2021

    13.2. Market Size Value (US$ billion) Forecast By Market Taxonomy, 2022 to 2032

        13.2.1. By Country

            13.2.1.1. China

            13.2.1.2. Japan

            13.2.1.3. India

            13.2.1.4. South Korea

            13.2.1.5. Australia

            13.2.1.6. Rest of APAC

        13.2.2. By Product Type

        13.2.3. By Application

        13.2.4. By Disease Type

        13.2.5. By End-use

    13.3. Market Attractiveness Analysis

        13.3.1. By Country

        13.3.2. By Product Type

        13.3.3. By Application

        13.3.4. By Disease Type

        13.3.5. By End-use

    13.4. Key Takeaways

14. MEA Market Analysis 2017 to 2021 and Forecast 2022 to 2032, By Country

    14.1. Historical Market Size Value (US$ billion) Trend Analysis By Market Taxonomy, 2017 to 2021

    14.2. Market Size Value (US$ billion) Forecast By Market Taxonomy, 2022 to 2032

        14.2.1. By Country

            14.2.1.1. South Africa

            14.2.1.2. Saudi Arabia

            14.2.1.3. UAE

            14.2.1.4. Israel

            14.2.1.5. Rest of Middle East and Africa (MEA)

        14.2.2. By Product Type

        14.2.3. By Application

        14.2.4. By Disease Type

        14.2.5. By End-use

    14.3. Market Attractiveness Analysis

        14.3.1. By Country

        14.3.2. By Product Type

        14.3.3. By Application

        14.3.4. By Disease Type

        14.3.5. By End-use

    14.4. Key Takeaways

15. Key Countries Market Analysis

    15.1. Value (US$ billion)ed States

        15.1.1. Pricing Analysis

        15.1.2. Market Share Analysis, 2021

            15.1.2.1. By Product Type

            15.1.2.2. By Application

            15.1.2.3. By Disease Type

            15.1.2.4. By End-use

    15.2. Canada

        15.2.1. Pricing Analysis

        15.2.2. Market Share Analysis, 2021

            15.2.2.1. By Product Type

            15.2.2.2. By Application

            15.2.2.3. By Disease Type

            15.2.2.4. By End-use

    15.3. Brazil

        15.3.1. Pricing Analysis

        15.3.2. Market Share Analysis, 2021

            15.3.2.1. By Product Type

            15.3.2.2. By Application

            15.3.2.3. By Disease Type

            15.3.2.4. By End-use

    15.4. Mexico

        15.4.1. Pricing Analysis

        15.4.2. Market Share Analysis, 2021

            15.4.2.1. By Product Type

            15.4.2.2. By Application

            15.4.2.3. By Disease Type

            15.4.2.4. By End-use

    15.5. Germany

        15.5.1. Pricing Analysis

        15.5.2. Market Share Analysis, 2021

            15.5.2.1. By Product Type

            15.5.2.2. By Application

            15.5.2.3. By Disease Type

            15.5.2.4. By End-use

    15.6. United Kingdom

        15.6.1. Pricing Analysis

        15.6.2. Market Share Analysis, 2021

            15.6.2.1. By Product Type

            15.6.2.2. By Application

            15.6.2.3. By Disease Type

            15.6.2.4. By End-use

    15.7. France

        15.7.1. Pricing Analysis

        15.7.2. Market Share Analysis, 2021

            15.7.2.1. By Product Type

            15.7.2.2. By Application

            15.7.2.3. By Disease Type

            15.7.2.4. By End-use

    15.8. Spain

        15.8.1. Pricing Analysis

        15.8.2. Market Share Analysis, 2021

            15.8.2.1. By Product Type

            15.8.2.2. By Application

            15.8.2.3. By Disease Type

            15.8.2.4. By End-use

    15.9. Italy

        15.9.1. Pricing Analysis

        15.9.2. Market Share Analysis, 2021

            15.9.2.1. By Product Type

            15.9.2.2. By Application

            15.9.2.3. By Disease Type

            15.9.2.4. By End-use

    15.10. Russia

        15.10.1. Pricing Analysis

        15.10.2. Market Share Analysis, 2021

            15.10.2.1. By Product Type

            15.10.2.2. By Application

            15.10.2.3. By Disease Type

            15.10.2.4. By End-use

    15.11. China

        15.11.1. Pricing Analysis

        15.11.2. Market Share Analysis, 2021

            15.11.2.1. By Product Type

            15.11.2.2. By Application

            15.11.2.3. By Disease Type

            15.11.2.4. By End-use

    15.12. Japan

        15.12.1. Pricing Analysis

        15.12.2. Market Share Analysis, 2021

            15.12.2.1. By Product Type

            15.12.2.2. By Application

            15.12.2.3. By Disease Type

            15.12.2.4. By End-use

    15.13. India

        15.13.1. Pricing Analysis

        15.13.2. Market Share Analysis, 2021

            15.13.2.1. By Product Type

            15.13.2.2. By Application

            15.13.2.3. By Disease Type

            15.13.2.4. By End-use

    15.14. South Korea

        15.14.1. Pricing Analysis

        15.14.2. Market Share Analysis, 2021

            15.14.2.1. By Product Type

            15.14.2.2. By Application

            15.14.2.3. By Disease Type

            15.14.2.4. By End-use

    15.15. Australia

        15.15.1. Pricing Analysis

        15.15.2. Market Share Analysis, 2021

            15.15.2.1. By Product Type

            15.15.2.2. By Application

            15.15.2.3. By Disease Type

            15.15.2.4. By End-use

    15.16. South Africa

        15.16.1. Pricing Analysis

        15.16.2. Market Share Analysis, 2021

            15.16.2.1. By Product Type

            15.16.2.2. By Application

            15.16.2.3. By Disease Type

            15.16.2.4. By End-use

    15.17. Saudi Arabia

        15.17.1. Pricing Analysis

        15.17.2. Market Share Analysis, 2021

            15.17.2.1. By Product Type

            15.17.2.2. By Application

            15.17.2.3. By Disease Type

            15.17.2.4. By End-use

    15.18. UAE

        15.18.1. Pricing Analysis

        15.18.2. Market Share Analysis, 2021

            15.18.2.1. By Product Type

            15.18.2.2. By Application

            15.18.2.3. By Disease Type

            15.18.2.4. By End-use

    15.19. Israel

        15.19.1. Pricing Analysis

        15.19.2. Market Share Analysis, 2021

            15.19.2.1. By Product Type

            15.19.2.2. By Application

            15.19.2.3. By Disease Type

            15.19.2.4. By End-use

16. Market Structure Analysis

    16.1. Competition Dashboard

    16.2. Competition Benchmarking

    16.3. Market Share Analysis of Top Players

        16.3.1. By Regional

        16.3.2. By Product Type

        16.3.3. By Application

        16.3.4. By Disease Type

        16.3.5. By End-use

17. Competition Analysis

    17.1. Competition Deep Dive

        17.1.1. Merck KGaA

            17.1.1.1. Overview

            17.1.1.2. Product Portfolio

            17.1.1.3. Profitability by Market Segments

            17.1.1.4. Sales Footprint

            17.1.1.5. Strategy Overview

                17.1.1.5.1. Marketing Strategy

                17.1.1.5.2. Product Strategy

                17.1.1.5.3. Channel Strategy

        17.1.2. Thermo Fisher Scientific, Inc.

            17.1.2.1. Overview

            17.1.2.2. Product Portfolio

            17.1.2.3. Profitability by Market Segments

            17.1.2.4. Sales Footprint

            17.1.2.5. Strategy Overview

                17.1.2.5.1. Marketing Strategy

                17.1.2.5.2. Product Strategy

                17.1.2.5.3. Channel Strategy

        17.1.3. Becton, Dickinson And Company

            17.1.3.1. Overview

            17.1.3.2. Product Portfolio

            17.1.3.3. Profitability by Market Segments

            17.1.3.4. Sales Footprint

            17.1.3.5. Strategy Overview

                17.1.3.5.1. Marketing Strategy

                17.1.3.5.2. Product Strategy

                17.1.3.5.3. Channel Strategy

        17.1.4. 3D Biotek LLC

            17.1.4.1. Overview

            17.1.4.2. Product Portfolio

            17.1.4.3. Profitability by Market Segments

            17.1.4.4. Sales Footprint

            17.1.4.5. Strategy Overview

                17.1.4.5.1. Marketing Strategy

                17.1.4.5.2. Product Strategy

                17.1.4.5.3. Channel Strategy

        17.1.5. Molecular Matrix, Inc.

            17.1.5.1. Overview

            17.1.5.2. Product Portfolio

            17.1.5.3. Profitability by Market Segments

            17.1.5.4. Sales Footprint

            17.1.5.5. Strategy Overview

                17.1.5.5.1. Marketing Strategy

                17.1.5.5.2. Product Strategy

                17.1.5.5.3. Channel Strategy

        17.1.6. REPROCELL, Inc.

            17.1.6.1. Overview

            17.1.6.2. Product Portfolio

            17.1.6.3. Profitability by Market Segments

            17.1.6.4. Sales Footprint

            17.1.6.5. Strategy Overview

                17.1.6.5.1. Marketing Strategy

                17.1.6.5.2. Product Strategy

                17.1.6.5.3. Channel Strategy

        17.1.7. Xanofi

            17.1.7.1. Overview

            17.1.7.2. Product Portfolio

            17.1.7.3. Profitability by Market Segments

            17.1.7.4. Sales Footprint

            17.1.7.5. Strategy Overview

                17.1.7.5.1. Marketing Strategy

                17.1.7.5.2. Product Strategy

                17.1.7.5.3. Channel Strategy

        17.1.8. Tecan Trading AG

            17.1.8.1. Overview

            17.1.8.2. Product Portfolio

            17.1.8.3. Profitability by Market Segments

            17.1.8.4. Sales Footprint

            17.1.8.5. Strategy Overview

                17.1.8.5.1. Marketing Strategy

                17.1.8.5.2. Product Strategy

                17.1.8.5.3. Channel Strategy

        17.1.9. Matricel GmbH

            17.1.9.1. Overview

            17.1.9.2. Product Portfolio

            17.1.9.3. Profitability by Market Segments

            17.1.9.4. Sales Footprint

            17.1.9.5. Strategy Overview

                17.1.9.5.1. Marketing Strategy

                17.1.9.5.2. Product Strategy

                17.1.9.5.3. Channel Strategy

        17.1.10. Pelobiotech

            17.1.10.1. Overview

            17.1.10.2. Product Portfolio

            17.1.10.3. Profitability by Market Segments

            17.1.10.4. Sales Footprint

            17.1.10.5. Strategy Overview

                17.1.10.5.1. Marketing Strategy

                17.1.10.5.2. Product Strategy

                17.1.10.5.3. Channel Strategy

        17.1.11. Corning Incorporated

            17.1.11.1. Overview

            17.1.11.2. Product Portfolio

            17.1.11.3. Profitability by Market Segments

            17.1.11.4. Sales Footprint

            17.1.11.5. Strategy Overview

                17.1.11.5.1. Marketing Strategy

                17.1.11.5.2. Product Strategy

                17.1.11.5.3. Channel Strategy

        17.1.12. Akron Biotech

            17.1.12.1. Overview

            17.1.12.2. Product Portfolio

            17.1.12.3. Profitability by Market Segments

            17.1.12.4. Sales Footprint

            17.1.12.5. Strategy Overview

                17.1.12.5.1. Marketing Strategy

                17.1.12.5.2. Product Strategy

                17.1.12.5.3. Channel Strategy

        17.1.13. Azenta Life Sciences

            17.1.13.1. Overview

            17.1.13.2. Product Portfolio

            17.1.13.3. Profitability by Market Segments

            17.1.13.4. Sales Footprint

            17.1.13.5. Strategy Overview

                17.1.13.5.1. Marketing Strategy

                17.1.13.5.2. Product Strategy

                17.1.13.5.3. Channel Strategy

        17.1.14. Nanofiber Solutions

            17.1.14.1. Overview

            17.1.14.2. Product Portfolio

            17.1.14.3. Profitability by Market Segments

            17.1.14.4. Sales Footprint

            17.1.14.5. Strategy Overview

                17.1.14.5.1. Marketing Strategy

                17.1.14.5.2. Product Strategy

                17.1.14.5.3. Channel Strategy

        17.1.15. NuVasive, Inc.

            17.1.15.1. Overview

            17.1.15.2. Product Portfolio

            17.1.15.3. Profitability by Market Segments

            17.1.15.4. Sales Footprint

            17.1.15.5. Strategy Overview

                17.1.15.5.1. Marketing Strategy

                17.1.15.5.2. Product Strategy

                17.1.15.5.3. Channel Strategy

        17.1.16. Avacta Life Sciences Limited

            17.1.16.1. Overview

            17.1.16.2. Product Portfolio

            17.1.16.3. Profitability by Market Segments

            17.1.16.4. Sales Footprint

            17.1.16.5. Strategy Overview

                17.1.16.5.1. Marketing Strategy

                17.1.16.5.2. Product Strategy

                17.1.16.5.3. Channel Strategy

        17.1.17. Medtronic

            17.1.17.1. Overview

            17.1.17.2. Product Portfolio

            17.1.17.3. Profitability by Market Segments

            17.1.17.4. Sales Footprint

            17.1.17.5. Strategy Overview

                17.1.17.5.1. Marketing Strategy

                17.1.17.5.2. Product Strategy

                17.1.17.5.3. Channel Strategy

        17.1.18. Allergan

            17.1.18.1. Overview

            17.1.18.2. Product Portfolio

            17.1.18.3. Profitability by Market Segments

            17.1.18.4. Sales Footprint

            17.1.18.5. Strategy Overview

                17.1.18.5.1. Marketing Strategy

                17.1.18.5.2. Product Strategy

                17.1.18.5.3. Channel Strategy

        17.1.19. Vericel Corporation

            17.1.19.1. Overview

            17.1.19.2. Product Portfolio

            17.1.19.3. Profitability by Market Segments

            17.1.19.4. Sales Footprint

            17.1.19.5. Strategy Overview

                17.1.19.5.1. Marketing Strategy

                17.1.19.5.2. Product Strategy

                17.1.19.5.3. Channel Strategy

18. Assumptions & Acronyms Used

19. Research Methodology

List of Tables

Table 1: Global Market Value (US$ billion) Forecast by Region, 2017 to 2032

Table 2: Global Market Value (US$ billion) Forecast by Product Type, 2017 to 2032

Table 3: Global Market Value (US$ billion) Forecast by Application, 2017 to 2032

Table 4: Global Market Value (US$ billion) Forecast by Disease Type, 2017 to 2032

Table 5: Global Market Value (US$ billion) Forecast by End-use, 2017 to 2032

Table 6: North America Market Value (US$ billion) Forecast by Country, 2017 to 2032

Table 7: North America Market Value (US$ billion) Forecast by Product Type, 2017 to 2032

Table 8: North America Market Value (US$ billion) Forecast by Application, 2017 to 2032

Table 9: North America Market Value (US$ billion) Forecast by Disease Type, 2017 to 2032

Table 10: North America Market Value (US$ billion) Forecast by End-use, 2017 to 2032

Table 11: Latin America Market Value (US$ billion) Forecast by Country, 2017 to 2032

Table 12: Latin America Market Value (US$ billion) Forecast by Product Type, 2017 to 2032

Table 13: Latin America Market Value (US$ billion) Forecast by Application, 2017 to 2032

Table 14: Latin America Market Value (US$ billion) Forecast by Disease Type, 2017 to 2032

Table 15: Latin America Market Value (US$ billion) Forecast by End-use, 2017 to 2032

Table 16: Europe Market Value (US$ billion) Forecast by Country, 2017 to 2032

Table 17: Europe Market Value (US$ billion) Forecast by Product Type, 2017 to 2032

Table 18: Europe Market Value (US$ billion) Forecast by Application, 2017 to 2032

Table 19: Europe Market Value (US$ billion) Forecast by Disease Type, 2017 to 2032

Table 20: Europe Market Value (US$ billion) Forecast by End-use, 2017 to 2032

Table 21: Asia Pacific Market Value (US$ billion) Forecast by Country, 2017 to 2032

Table 22: Asia Pacific Market Value (US$ billion) Forecast by Product Type, 2017 to 2032

Table 23: Asia Pacific Market Value (US$ billion) Forecast by Application, 2017 to 2032

Table 24: Asia Pacific Market Value (US$ billion) Forecast by Disease Type, 2017 to 2032

Table 25: Asia Pacific Market Value (US$ billion) Forecast by End-use, 2017 to 2032

Table 26: MEA Market Value (US$ billion) Forecast by Country, 2017 to 2032

Table 27: MEA Market Value (US$ billion) Forecast by Product Type, 2017 to 2032

Table 28: MEA Market Value (US$ billion) Forecast by Application, 2017 to 2032

Table 29: MEA Market Value (US$ billion) Forecast by Disease Type, 2017 to 2032

Table 30: MEA Market Value (US$ billion) Forecast by End-use, 2017 to 2032

List of Charts

Figure 1: Global Market Value (US$ billion) by Product Type, 2022 to 2032

Figure 2: Global Market Value (US$ billion) by Application, 2022 to 2032

Figure 3: Global Market Value (US$ billion) by Disease Type, 2022 to 2032

Figure 4: Global Market Value (US$ billion) by End-use, 2022 to 2032

Figure 5: Global Market Value (US$ billion) by Region, 2022 to 2032

Figure 6: Global Market Value (US$ billion) Analysis by Region, 2017 to 2032

Figure 7: Global Market Value Share (%) and BPS Analysis by Region, 2022 to 2032

Figure 8: Global Market Y-o-Y Growth (%) Projections by Region, 2022 to 2032

Figure 9: Global Market Value (US$ billion) Analysis by Product Type, 2017 to 2032

Figure 10: Global Market Value Share (%) and BPS Analysis by Product Type, 2022 to 2032

Figure 11: Global Market Y-o-Y Growth (%) Projections by Product Type, 2022 to 2032

Figure 12: Global Market Value (US$ billion) Analysis by Application, 2017 to 2032

Figure 13: Global Market Value Share (%) and BPS Analysis by Application, 2022 to 2032

Figure 14: Global Market Y-o-Y Growth (%) Projections by Application, 2022 to 2032

Figure 15: Global Market Value (US$ billion) Analysis by Disease Type, 2017 to 2032

Figure 16: Global Market Value Share (%) and BPS Analysis by Disease Type, 2022 to 2032

Figure 17: Global Market Y-o-Y Growth (%) Projections by Disease Type, 2022 to 2032

Figure 18: Global Market Value (US$ billion) Analysis by End-use, 2017 to 2032

Figure 19: Global Market Value Share (%) and BPS Analysis by End-use, 2022 to 2032

Figure 20: Global Market Y-o-Y Growth (%) Projections by End-use, 2022 to 2032

Figure 21: Global Market Attractiveness by Product Type, 2022 to 2032

Figure 22: Global Market Attractiveness by Application, 2022 to 2032

Figure 23: Global Market Attractiveness by Disease Type, 2022 to 2032

Figure 24: Global Market Attractiveness by End-use, 2022 to 2032

Figure 25: Global Market Attractiveness by Region, 2022 to 2032

Figure 26: North America Market Value (US$ billion) by Product Type, 2022 to 2032

Figure 27: North America Market Value (US$ billion) by Application, 2022 to 2032

Figure 28: North America Market Value (US$ billion) by Disease Type, 2022 to 2032

Figure 29: North America Market Value (US$ billion) by End-use, 2022 to 2032

Figure 30: North America Market Value (US$ billion) by Country, 2022 to 2032

Figure 31: North America Market Value (US$ billion) Analysis by Country, 2017 to 2032

Figure 32: North America Market Value Share (%) and BPS Analysis by Country, 2022 to 2032

Figure 33: North America Market Y-o-Y Growth (%) Projections by Country, 2022 to 2032

Figure 34: North America Market Value (US$ billion) Analysis by Product Type, 2017 to 2032

Figure 35: North America Market Value Share (%) and BPS Analysis by Product Type, 2022 to 2032

Figure 36: North America Market Y-o-Y Growth (%) Projections by Product Type, 2022 to 2032

Figure 37: North America Market Value (US$ billion) Analysis by Application, 2017 to 2032

Figure 38: North America Market Value Share (%) and BPS Analysis by Application, 2022 to 2032

Figure 39: North America Market Y-o-Y Growth (%) Projections by Application, 2022 to 2032

Figure 40: North America Market Value (US$ billion) Analysis by Disease Type, 2017 to 2032

Figure 41: North America Market Value Share (%) and BPS Analysis by Disease Type, 2022 to 2032

Figure 42: North America Market Y-o-Y Growth (%) Projections by Disease Type, 2022 to 2032

Figure 43: North America Market Value (US$ billion) Analysis by End-use, 2017 to 2032

Figure 44: North America Market Value Share (%) and BPS Analysis by End-use, 2022 to 2032

Figure 45: North America Market Y-o-Y Growth (%) Projections by End-use, 2022 to 2032

Figure 46: North America Market Attractiveness by Product Type, 2022 to 2032

Figure 47: North America Market Attractiveness by Application, 2022 to 2032

Figure 48: North America Market Attractiveness by Disease Type, 2022 to 2032

Figure 49: North America Market Attractiveness by End-use, 2022 to 2032

Figure 50: North America Market Attractiveness by Country, 2022 to 2032

Figure 51: Latin America Market Value (US$ billion) by Product Type, 2022 to 2032

Figure 52: Latin America Market Value (US$ billion) by Application, 2022 to 2032

Figure 53: Latin America Market Value (US$ billion) by Disease Type, 2022 to 2032

Figure 54: Latin America Market Value (US$ billion) by End-use, 2022 to 2032

Figure 55: Latin America Market Value (US$ billion) by Country, 2022 to 2032

Figure 56: Latin America Market Value (US$ billion) Analysis by Country, 2017 to 2032

Figure 57: Latin America Market Value Share (%) and BPS Analysis by Country, 2022 to 2032

Figure 58: Latin America Market Y-o-Y Growth (%) Projections by Country, 2022 to 2032

Figure 59: Latin America Market Value (US$ billion) Analysis by Product Type, 2017 to 2032

Figure 60: Latin America Market Value Share (%) and BPS Analysis by Product Type, 2022 to 2032

Figure 61: Latin America Market Y-o-Y Growth (%) Projections by Product Type, 2022 to 2032

Figure 62: Latin America Market Value (US$ billion) Analysis by Application, 2017 to 2032

Figure 63: Latin America Market Value Share (%) and BPS Analysis by Application, 2022 to 2032

Figure 64: Latin America Market Y-o-Y Growth (%) Projections by Application, 2022 to 2032

Figure 65: Latin America Market Value (US$ billion) Analysis by Disease Type, 2017 to 2032

Figure 66: Latin America Market Value Share (%) and BPS Analysis by Disease Type, 2022 to 2032

Figure 67: Latin America Market Y-o-Y Growth (%) Projections by Disease Type, 2022 to 2032

Figure 68: Latin America Market Value (US$ billion) Analysis by End-use, 2017 to 2032

Figure 69: Latin America Market Value Share (%) and BPS Analysis by End-use, 2022 to 2032

Figure 70: Latin America Market Y-o-Y Growth (%) Projections by End-use, 2022 to 2032

Figure 71: Latin America Market Attractiveness by Product Type, 2022 to 2032

Figure 72: Latin America Market Attractiveness by Application, 2022 to 2032

Figure 73: Latin America Market Attractiveness by Disease Type, 2022 to 2032

Figure 74: Latin America Market Attractiveness by End-use, 2022 to 2032

Figure 75: Latin America Market Attractiveness by Country, 2022 to 2032

Figure 76: Europe Market Value (US$ billion) by Product Type, 2022 to 2032

Figure 77: Europe Market Value (US$ billion) by Application, 2022 to 2032

Figure 78: Europe Market Value (US$ billion) by Disease Type, 2022 to 2032

Figure 79: Europe Market Value (US$ billion) by End-use, 2022 to 2032

Figure 80: Europe Market Value (US$ billion) by Country, 2022 to 2032

Figure 81: Europe Market Value (US$ billion) Analysis by Country, 2017 to 2032

Figure 82: Europe Market Value Share (%) and BPS Analysis by Country, 2022 to 2032

Figure 83: Europe Market Y-o-Y Growth (%) Projections by Country, 2022 to 2032

Figure 84: Europe Market Value (US$ billion) Analysis by Product Type, 2017 to 2032

Figure 85: Europe Market Value Share (%) and BPS Analysis by Product Type, 2022 to 2032

Figure 86: Europe Market Y-o-Y Growth (%) Projections by Product Type, 2022 to 2032

Figure 87: Europe Market Value (US$ billion) Analysis by Application, 2017 to 2032

Figure 88: Europe Market Value Share (%) and BPS Analysis by Application, 2022 to 2032

Figure 89: Europe Market Y-o-Y Growth (%) Projections by Application, 2022 to 2032

Figure 90: Europe Market Value (US$ billion) Analysis by Disease Type, 2017 to 2032

Figure 91: Europe Market Value Share (%) and BPS Analysis by Disease Type, 2022 to 2032

Figure 92: Europe Market Y-o-Y Growth (%) Projections by Disease Type, 2022 to 2032

Figure 93: Europe Market Value (US$ billion) Analysis by End-use, 2017 to 2032

Figure 94: Europe Market Value Share (%) and BPS Analysis by End-use, 2022 to 2032

Figure 95: Europe Market Y-o-Y Growth (%) Projections by End-use, 2022 to 2032

Figure 96: Europe Market Attractiveness by Product Type, 2022 to 2032

Figure 97: Europe Market Attractiveness by Application, 2022 to 2032

Figure 98: Europe Market Attractiveness by Disease Type, 2022 to 2032

Figure 99: Europe Market Attractiveness by End-use, 2022 to 2032

Figure 100: Europe Market Attractiveness by Country, 2022 to 2032

Figure 101: Asia Pacific Market Value (US$ billion) by Product Type, 2022 to 2032

Figure 102: Asia Pacific Market Value (US$ billion) by Application, 2022 to 2032

Figure 103: Asia Pacific Market Value (US$ billion) by Disease Type, 2022 to 2032

Figure 104: Asia Pacific Market Value (US$ billion) by End-use, 2022 to 2032

Figure 105: Asia Pacific Market Value (US$ billion) by Country, 2022 to 2032

Figure 106: Asia Pacific Market Value (US$ billion) Analysis by Country, 2017 to 2032

Figure 107: Asia Pacific Market Value Share (%) and BPS Analysis by Country, 2022 to 2032

Figure 108: Asia Pacific Market Y-o-Y Growth (%) Projections by Country, 2022 to 2032

Figure 109: Asia Pacific Market Value (US$ billion) Analysis by Product Type, 2017 to 2032

Figure 110: Asia Pacific Market Value Share (%) and BPS Analysis by Product Type, 2022 to 2032

Figure 111: Asia Pacific Market Y-o-Y Growth (%) Projections by Product Type, 2022 to 2032

Figure 112: Asia Pacific Market Value (US$ billion) Analysis by Application, 2017 to 2032

Figure 113: Asia Pacific Market Value Share (%) and BPS Analysis by Application, 2022 to 2032

Figure 114: Asia Pacific Market Y-o-Y Growth (%) Projections by Application, 2022 to 2032

Figure 115: Asia Pacific Market Value (US$ billion) Analysis by Disease Type, 2017 to 2032

Figure 116: Asia Pacific Market Value Share (%) and BPS Analysis by Disease Type, 2022 to 2032

Figure 117: Asia Pacific Market Y-o-Y Growth (%) Projections by Disease Type, 2022 to 2032

Figure 118: Asia Pacific Market Value (US$ billion) Analysis by End-use, 2017 to 2032

Figure 119: Asia Pacific Market Value Share (%) and BPS Analysis by End-use, 2022 to 2032

Figure 120: Asia Pacific Market Y-o-Y Growth (%) Projections by End-use, 2022 to 2032

Figure 121: Asia Pacific Market Attractiveness by Product Type, 2022 to 2032

Figure 122: Asia Pacific Market Attractiveness by Application, 2022 to 2032

Figure 123: Asia Pacific Market Attractiveness by Disease Type, 2022 to 2032

Figure 124: Asia Pacific Market Attractiveness by End-use, 2022 to 2032

Figure 125: Asia Pacific Market Attractiveness by Country, 2022 to 2032

Figure 126: MEA Market Value (US$ billion) by Product Type, 2022 to 2032

Figure 127: MEA Market Value (US$ billion) by Application, 2022 to 2032

Figure 128: MEA Market Value (US$ billion) by Disease Type, 2022 to 2032

Figure 129: MEA Market Value (US$ billion) by End-use, 2022 to 2032

Figure 130: MEA Market Value (US$ billion) by Country, 2022 to 2032

Figure 131: MEA Market Value (US$ billion) Analysis by Country, 2017 to 2032

Figure 132: MEA Market Value Share (%) and BPS Analysis by Country, 2022 to 2032

Figure 133: MEA Market Y-o-Y Growth (%) Projections by Country, 2022 to 2032

Figure 134: MEA Market Value (US$ billion) Analysis by Product Type, 2017 to 2032

Figure 135: MEA Market Value Share (%) and BPS Analysis by Product Type, 2022 to 2032

Figure 136: MEA Market Y-o-Y Growth (%) Projections by Product Type, 2022 to 2032

Figure 137: MEA Market Value (US$ billion) Analysis by Application, 2017 to 2032

Figure 138: MEA Market Value Share (%) and BPS Analysis by Application, 2022 to 2032

Figure 139: MEA Market Y-o-Y Growth (%) Projections by Application, 2022 to 2032

Figure 140: MEA Market Value (US$ billion) Analysis by Disease Type, 2017 to 2032

Figure 141: MEA Market Value Share (%) and BPS Analysis by Disease Type, 2022 to 2032

Figure 142: MEA Market Y-o-Y Growth (%) Projections by Disease Type, 2022 to 2032

Figure 143: MEA Market Value (US$ billion) Analysis by End-use, 2017 to 2032

Figure 144: MEA Market Value Share (%) and BPS Analysis by End-use, 2022 to 2032

Figure 145: MEA Market Y-o-Y Growth (%) Projections by End-use, 2022 to 2032

Figure 146: MEA Market Attractiveness by Product Type, 2022 to 2032

Figure 147: MEA Market Attractiveness by Application, 2022 to 2032

Figure 148: MEA Market Attractiveness by Disease Type, 2022 to 2032

Figure 149: MEA Market Attractiveness by End-use, 2022 to 2032

Figure 150: MEA Market Attractiveness by Country, 2022 to 2032

Recommendations

Healthcare

Allogeneic T Cell Therapies Market

Published : March 2023

Explore Healthcare Insights

View Reports

Scaffold Technology Market