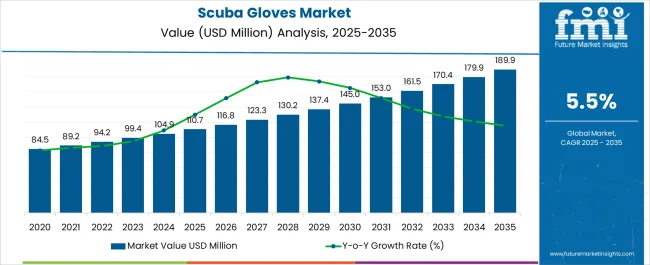
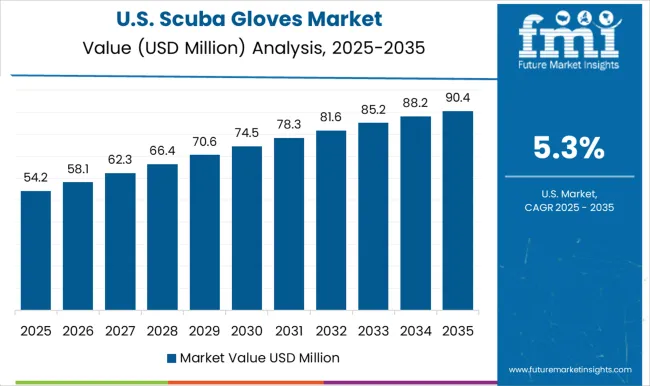
The scuba gloves market is set for significant expansion, with an anticipated valuation of USD 98.9 million by 2023. The market displays a significant trend, featuring a CAGR of 5.8%, which is expected to endure until 2033. The consistent growth forecasts indicate that the global scuba gloves market is poised to achieve an impressive valuation of USD 173.8 million by 2033.
Key Market Trends and Highlights
Attributes | Key Insights |
---|---|
Market Estimated Size in 2023 | USD 98.9 million |
Projected Market Size in 2033 | USD 173.8 million |
Value-based CAGR from 2023 to 2033 | 5.8% |
The scuba gloves industry has steadily grown, with the market value reaching USD 93.5 million in 2022. The achievement indicates the industry resilience and ability to cater to the growing demand for specialized gear in water sports, particularly scuba diving.
Attributes | Details |
---|---|
Market Value in 2022 | USD 93.5 million |
Market Value in 2023 | USD 98.9 million |
The historical trajectory reflects an upward trend, driven by factors such as the increasing popularity of water sports and government efforts to promote tourism through aquatic activities. Looking ahead to 2023 to 2033, the scuba gloves industry is poised for substantial expansion. Projections indicate a robust growth trajectory, with the market value expected to experience significant appreciation.
Factors contributing to this optimistic forecast include the continuous rise in water sports enthusiasts, the increasing emphasis on safety standards in diving, and ongoing innovations in scuba gear technology. As the industry responds to evolving consumer needs and incorporates advanced features in scuba gloves, the market is anticipated to witness sustained momentum.
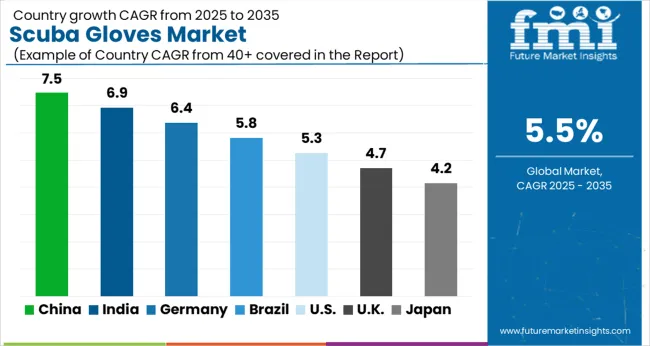
The below table showcases CAGRs in terms of the five countries spearheaded by the United States, China, the United Kingdom, Germany, and Japan.
CAGRs from 2023 to 2033
The United States | 6.3% |
---|---|
The United Kingdom | 6.5% |
Germany | 5.5% |
Japan | 4.5% |
China | 7% |
The United States is a prominent player in the scuba gloves market, boasting a substantial CAGR of 6.3%. This reflects the country robust scuba diving culture, consumer engagement in water sports, and a mature need for scuba gear.
A combination of enthusiastic participation in scuba diving activities and a demand for advanced, high-quality scuba gloves propels the growth in the United States.
The United Kingdom holds a firm position in the global scuba gloves market, registering a CAGR of 6.5%. The British market is characterized by a strong interest in water sports and recreational diving, contributing to the consistent demand for scuba gloves. Avid divers seeking specialized equipment for enhanced underwater experiences also influence the market growth.
With a CAGR of 5.5%, Germany showcases diverse market dynamics in the scuba gloves industry. The German market benefits from a combination of a growing interest in water-based activities, advancements in scuba gear technology, and the presence of reputable manufacturers. A discerning consumer base seeking quality and innovation in scuba gloves drives the market moderate growth.
Japan contributes to the global scuba gloves market, exhibiting a CAGR of 4.5%. The Japanese market is characterized by a steady interest in scuba diving and water sports, with consumers seeking reliable and technologically advanced gloves. While the market share is comparatively lower, Japan contribution adds to the overall global growth of the scuba gloves industry.
China emerges as a frontrunner in the scuba gloves market, expanding at a CAGR of 7%. The Chinese market is marked by a growing trend of water sports participation, increasing awareness about scuba diving, and a rising demand for quality scuba gear. China’s elevated growth underscores its pivotal role in shaping the global landscape of the scuba gloves industry.
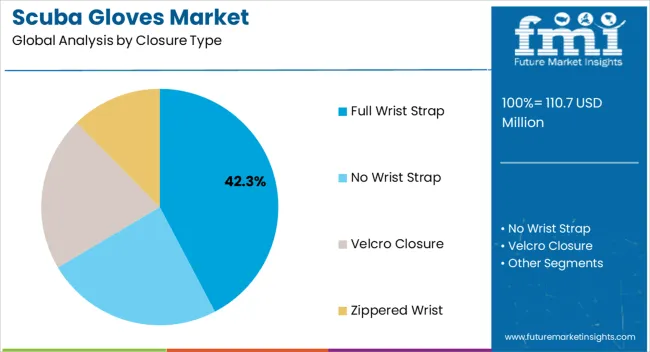
The table below highlights how velcro is projected to lead the closure-type market, expanding at a market share of 28.7% in 2023. The table further details how females are anticipated to lead consumer orientation and witness a market share of 48.6% in 2023.
Category | Market Share in 2023 |
---|---|
Velcro | 28.7% |
Female | 48.6% |
The closure-type market is poised for significant developments, with Velcro projected to lead the way, capturing an expansive market share of 28.7% in 2023. Velcro, known for its ease of use and versatility, emerges as a favored choice among consumers for various applications.
This dominance signifies the widespread adoption and preference for velcro closures in diverse product categories, showcasing its market prominence and consumer acceptance.
Based on consumer orientation, females are anticipated to play a pivotal role, leading the market with a substantial share of 48.6% in 2023. This statistic underscores the influence and purchasing power of the female consumer demographic in the closure-type market.
The market dynamics reflect a consumer landscape where females actively drive preferences and choices, influencing the design and functionality of products featuring closures. This female-centric orientation is indicative of the evolving market trends and the emphasis on meeting the specific needs and preferences of this consumer segment.
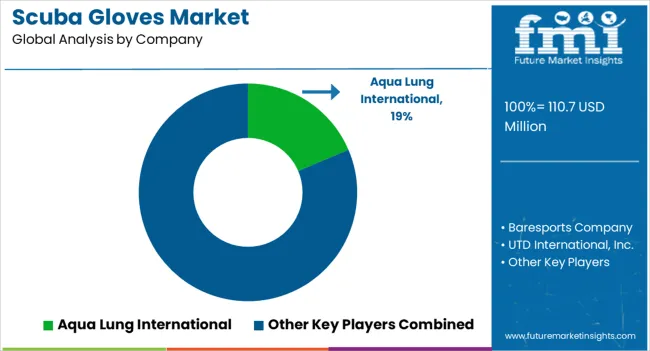
Many key scuba gloves manufacturers are inclined to invest significantly in innovation, research, and development practices to uncover increased applications of scuba glovess. With technology, players also focus on ensuring safety, quality, and customer satisfaction to captivate an increased customer base. Some of the latest developments include
Attributes | Details |
---|---|
Estimated Market Size in 2023 | USD 98.9 million |
Projected Market Valuation in 2033 | USD 173.8 million |
CAGR Share from 2023 to 2033 | 5.8% |
Forecast Period | 2023 to 2033 |
Historical Data Available for | 2018 to 2022 |
Market Analysis | Value in USD million |
Key Regions Covered | North America; Latin America; Western Europe; Eastern Europe; South Asia and Pacific; East Asia; The Middle East & Africa |
Key Market Segments Covered | Closure Type, Size, Thickness, Gender, Region |
Key Countries Profiled | The United States, Canada, Brazil, Mexico, Germany, The United Kingdom, France, Spain, Italy, Russia, Poland, Czech Republic, Romania, India, Bangladesh, Australia, New Zealand, China, Japan, South Korea, GCC countries, South Africa, Israel |
Key Companies Profiled | Aqua Lung International; Baresports Company; UTD International, Inc.; Waterproof USA; Henderson Aquatics Inc.; AKONA |
Table 1: Global Market Value (US$ Million) Forecast by Region, 2018 to 2033
Table 2: Global Market Volume (Units) Forecast by Region, 2018 to 2033
Table 3: Global Market Value (US$ Million) Forecast by Closure Type, 2018 to 2033
Table 4: Global Market Volume (Units) Forecast by Closure Type, 2018 to 2033
Table 5: Global Market Value (US$ Million) Forecast by Size, 2018 to 2033
Table 6: Global Market Volume (Units) Forecast by Size, 2018 to 2033
Table 7: Global Market Value (US$ Million) Forecast by Thickness, 2018 to 2033
Table 8: Global Market Volume (Units) Forecast by Thickness, 2018 to 2033
Table 9: Global Market Value (US$ Million) Forecast by Gender, 2018 to 2033
Table 10: Global Market Volume (Units) Forecast by Gender, 2018 to 2033
Table 11: North America Market Value (US$ Million) Forecast by Country, 2018 to 2033
Table 12: North America Market Volume (Units) Forecast by Country, 2018 to 2033
Table 13: North America Market Value (US$ Million) Forecast by Closure Type, 2018 to 2033
Table 14: North America Market Volume (Units) Forecast by Closure Type, 2018 to 2033
Table 15: North America Market Value (US$ Million) Forecast by Size, 2018 to 2033
Table 16: North America Market Volume (Units) Forecast by Size, 2018 to 2033
Table 17: North America Market Value (US$ Million) Forecast by Thickness, 2018 to 2033
Table 18: North America Market Volume (Units) Forecast by Thickness, 2018 to 2033
Table 19: North America Market Value (US$ Million) Forecast by Gender, 2018 to 2033
Table 20: North America Market Volume (Units) Forecast by Gender, 2018 to 2033
Table 21: Latin America Market Value (US$ Million) Forecast by Country, 2018 to 2033
Table 22: Latin America Market Volume (Units) Forecast by Country, 2018 to 2033
Table 23: Latin America Market Value (US$ Million) Forecast by Closure Type, 2018 to 2033
Table 24: Latin America Market Volume (Units) Forecast by Closure Type, 2018 to 2033
Table 25: Latin America Market Value (US$ Million) Forecast by Size, 2018 to 2033
Table 26: Latin America Market Volume (Units) Forecast by Size, 2018 to 2033
Table 27: Latin America Market Value (US$ Million) Forecast by Thickness, 2018 to 2033
Table 28: Latin America Market Volume (Units) Forecast by Thickness, 2018 to 2033
Table 29: Latin America Market Value (US$ Million) Forecast by Gender, 2018 to 2033
Table 30: Latin America Market Volume (Units) Forecast by Gender, 2018 to 2033
Table 31: Western Europe Market Value (US$ Million) Forecast by Country, 2018 to 2033
Table 32: Western Europe Market Volume (Units) Forecast by Country, 2018 to 2033
Table 33: Western Europe Market Value (US$ Million) Forecast by Closure Type, 2018 to 2033
Table 34: Western Europe Market Volume (Units) Forecast by Closure Type, 2018 to 2033
Table 35: Western Europe Market Value (US$ Million) Forecast by Size, 2018 to 2033
Table 36: Western Europe Market Volume (Units) Forecast by Size, 2018 to 2033
Table 37: Western Europe Market Value (US$ Million) Forecast by Thickness, 2018 to 2033
Table 38: Western Europe Market Volume (Units) Forecast by Thickness, 2018 to 2033
Table 39: Western Europe Market Value (US$ Million) Forecast by Gender, 2018 to 2033
Table 40: Western Europe Market Volume (Units) Forecast by Gender, 2018 to 2033
Table 41: Eastern Europe Market Value (US$ Million) Forecast by Country, 2018 to 2033
Table 42: Eastern Europe Market Volume (Units) Forecast by Country, 2018 to 2033
Table 43: Eastern Europe Market Value (US$ Million) Forecast by Closure Type, 2018 to 2033
Table 44: Eastern Europe Market Volume (Units) Forecast by Closure Type, 2018 to 2033
Table 45: Eastern Europe Market Value (US$ Million) Forecast by Size, 2018 to 2033
Table 46: Eastern Europe Market Volume (Units) Forecast by Size, 2018 to 2033
Table 47: Eastern Europe Market Value (US$ Million) Forecast by Thickness, 2018 to 2033
Table 48: Eastern Europe Market Volume (Units) Forecast by Thickness, 2018 to 2033
Table 49: Eastern Europe Market Value (US$ Million) Forecast by Gender, 2018 to 2033
Table 50: Eastern Europe Market Volume (Units) Forecast by Gender, 2018 to 2033
Table 51: South Asia and Pacific Market Value (US$ Million) Forecast by Country, 2018 to 2033
Table 52: South Asia and Pacific Market Volume (Units) Forecast by Country, 2018 to 2033
Table 53: South Asia and Pacific Market Value (US$ Million) Forecast by Closure Type, 2018 to 2033
Table 54: South Asia and Pacific Market Volume (Units) Forecast by Closure Type, 2018 to 2033
Table 55: South Asia and Pacific Market Value (US$ Million) Forecast by Size, 2018 to 2033
Table 56: South Asia and Pacific Market Volume (Units) Forecast by Size, 2018 to 2033
Table 57: South Asia and Pacific Market Value (US$ Million) Forecast by Thickness, 2018 to 2033
Table 58: South Asia and Pacific Market Volume (Units) Forecast by Thickness, 2018 to 2033
Table 59: South Asia and Pacific Market Value (US$ Million) Forecast by Gender, 2018 to 2033
Table 60: South Asia and Pacific Market Volume (Units) Forecast by Gender, 2018 to 2033
Table 61: East Asia Market Value (US$ Million) Forecast by Country, 2018 to 2033
Table 62: East Asia Market Volume (Units) Forecast by Country, 2018 to 2033
Table 63: East Asia Market Value (US$ Million) Forecast by Closure Type, 2018 to 2033
Table 64: East Asia Market Volume (Units) Forecast by Closure Type, 2018 to 2033
Table 65: East Asia Market Value (US$ Million) Forecast by Size, 2018 to 2033
Table 66: East Asia Market Volume (Units) Forecast by Size, 2018 to 2033
Table 67: East Asia Market Value (US$ Million) Forecast by Thickness, 2018 to 2033
Table 68: East Asia Market Volume (Units) Forecast by Thickness, 2018 to 2033
Table 69: East Asia Market Value (US$ Million) Forecast by Gender, 2018 to 2033
Table 70: East Asia Market Volume (Units) Forecast by Gender, 2018 to 2033
Table 71: Middle East and Africa Market Value (US$ Million) Forecast by Country, 2018 to 2033
Table 72: Middle East and Africa Market Volume (Units) Forecast by Country, 2018 to 2033
Table 73: Middle East and Africa Market Value (US$ Million) Forecast by Closure Type, 2018 to 2033
Table 74: Middle East and Africa Market Volume (Units) Forecast by Closure Type, 2018 to 2033
Table 75: Middle East and Africa Market Value (US$ Million) Forecast by Size, 2018 to 2033
Table 76: Middle East and Africa Market Volume (Units) Forecast by Size, 2018 to 2033
Table 77: Middle East and Africa Market Value (US$ Million) Forecast by Thickness, 2018 to 2033
Table 78: Middle East and Africa Market Volume (Units) Forecast by Thickness, 2018 to 2033
Table 79: Middle East and Africa Market Value (US$ Million) Forecast by Gender, 2018 to 2033
Table 80: Middle East and Africa Market Volume (Units) Forecast by Gender, 2018 to 2033
Figure 1: Global Market Value (US$ Million) by Closure Type, 2023 to 2033
Figure 2: Global Market Value (US$ Million) by Size, 2023 to 2033
Figure 3: Global Market Value (US$ Million) by Thickness, 2023 to 2033
Figure 4: Global Market Value (US$ Million) by Gender, 2023 to 2033
Figure 5: Global Market Value (US$ Million) by Region, 2023 to 2033
Figure 6: Global Market Value (US$ Million) Analysis by Region, 2018 to 2033
Figure 7: Global Market Volume (Units) Analysis by Region, 2018 to 2033
Figure 8: Global Market Value Share (%) and BPS Analysis by Region, 2023 to 2033
Figure 9: Global Market Y-o-Y Growth (%) Projections by Region, 2023 to 2033
Figure 10: Global Market Value (US$ Million) Analysis by Closure Type, 2018 to 2033
Figure 11: Global Market Volume (Units) Analysis by Closure Type, 2018 to 2033
Figure 12: Global Market Value Share (%) and BPS Analysis by Closure Type, 2023 to 2033
Figure 13: Global Market Y-o-Y Growth (%) Projections by Closure Type, 2023 to 2033
Figure 14: Global Market Value (US$ Million) Analysis by Size, 2018 to 2033
Figure 15: Global Market Volume (Units) Analysis by Size, 2018 to 2033
Figure 16: Global Market Value Share (%) and BPS Analysis by Size, 2023 to 2033
Figure 17: Global Market Y-o-Y Growth (%) Projections by Size, 2023 to 2033
Figure 18: Global Market Value (US$ Million) Analysis by Thickness, 2018 to 2033
Figure 19: Global Market Volume (Units) Analysis by Thickness, 2018 to 2033
Figure 20: Global Market Value Share (%) and BPS Analysis by Thickness, 2023 to 2033
Figure 21: Global Market Y-o-Y Growth (%) Projections by Thickness, 2023 to 2033
Figure 22: Global Market Value (US$ Million) Analysis by Gender, 2018 to 2033
Figure 23: Global Market Volume (Units) Analysis by Gender, 2018 to 2033
Figure 24: Global Market Value Share (%) and BPS Analysis by Gender, 2023 to 2033
Figure 25: Global Market Y-o-Y Growth (%) Projections by Gender, 2023 to 2033
Figure 26: Global Market Attractiveness by Closure Type, 2023 to 2033
Figure 27: Global Market Attractiveness by Size, 2023 to 2033
Figure 28: Global Market Attractiveness by Thickness, 2023 to 2033
Figure 29: Global Market Attractiveness by Gender, 2023 to 2033
Figure 30: Global Market Attractiveness by Region, 2023 to 2033
Figure 31: North America Market Value (US$ Million) by Closure Type, 2023 to 2033
Figure 32: North America Market Value (US$ Million) by Size, 2023 to 2033
Figure 33: North America Market Value (US$ Million) by Thickness, 2023 to 2033
Figure 34: North America Market Value (US$ Million) by Gender, 2023 to 2033
Figure 35: North America Market Value (US$ Million) by Country, 2023 to 2033
Figure 36: North America Market Value (US$ Million) Analysis by Country, 2018 to 2033
Figure 37: North America Market Volume (Units) Analysis by Country, 2018 to 2033
Figure 38: North America Market Value Share (%) and BPS Analysis by Country, 2023 to 2033
Figure 39: North America Market Y-o-Y Growth (%) Projections by Country, 2023 to 2033
Figure 40: North America Market Value (US$ Million) Analysis by Closure Type, 2018 to 2033
Figure 41: North America Market Volume (Units) Analysis by Closure Type, 2018 to 2033
Figure 42: North America Market Value Share (%) and BPS Analysis by Closure Type, 2023 to 2033
Figure 43: North America Market Y-o-Y Growth (%) Projections by Closure Type, 2023 to 2033
Figure 44: North America Market Value (US$ Million) Analysis by Size, 2018 to 2033
Figure 45: North America Market Volume (Units) Analysis by Size, 2018 to 2033
Figure 46: North America Market Value Share (%) and BPS Analysis by Size, 2023 to 2033
Figure 47: North America Market Y-o-Y Growth (%) Projections by Size, 2023 to 2033
Figure 48: North America Market Value (US$ Million) Analysis by Thickness, 2018 to 2033
Figure 49: North America Market Volume (Units) Analysis by Thickness, 2018 to 2033
Figure 50: North America Market Value Share (%) and BPS Analysis by Thickness, 2023 to 2033
Figure 51: North America Market Y-o-Y Growth (%) Projections by Thickness, 2023 to 2033
Figure 52: North America Market Value (US$ Million) Analysis by Gender, 2018 to 2033
Figure 53: North America Market Volume (Units) Analysis by Gender, 2018 to 2033
Figure 54: North America Market Value Share (%) and BPS Analysis by Gender, 2023 to 2033
Figure 55: North America Market Y-o-Y Growth (%) Projections by Gender, 2023 to 2033
Figure 56: North America Market Attractiveness by Closure Type, 2023 to 2033
Figure 57: North America Market Attractiveness by Size, 2023 to 2033
Figure 58: North America Market Attractiveness by Thickness, 2023 to 2033
Figure 59: North America Market Attractiveness by Gender, 2023 to 2033
Figure 60: North America Market Attractiveness by Country, 2023 to 2033
Figure 61: Latin America Market Value (US$ Million) by Closure Type, 2023 to 2033
Figure 62: Latin America Market Value (US$ Million) by Size, 2023 to 2033
Figure 63: Latin America Market Value (US$ Million) by Thickness, 2023 to 2033
Figure 64: Latin America Market Value (US$ Million) by Gender, 2023 to 2033
Figure 65: Latin America Market Value (US$ Million) by Country, 2023 to 2033
Figure 66: Latin America Market Value (US$ Million) Analysis by Country, 2018 to 2033
Figure 67: Latin America Market Volume (Units) Analysis by Country, 2018 to 2033
Figure 68: Latin America Market Value Share (%) and BPS Analysis by Country, 2023 to 2033
Figure 69: Latin America Market Y-o-Y Growth (%) Projections by Country, 2023 to 2033
Figure 70: Latin America Market Value (US$ Million) Analysis by Closure Type, 2018 to 2033
Figure 71: Latin America Market Volume (Units) Analysis by Closure Type, 2018 to 2033
Figure 72: Latin America Market Value Share (%) and BPS Analysis by Closure Type, 2023 to 2033
Figure 73: Latin America Market Y-o-Y Growth (%) Projections by Closure Type, 2023 to 2033
Figure 74: Latin America Market Value (US$ Million) Analysis by Size, 2018 to 2033
Figure 75: Latin America Market Volume (Units) Analysis by Size, 2018 to 2033
Figure 76: Latin America Market Value Share (%) and BPS Analysis by Size, 2023 to 2033
Figure 77: Latin America Market Y-o-Y Growth (%) Projections by Size, 2023 to 2033
Figure 78: Latin America Market Value (US$ Million) Analysis by Thickness, 2018 to 2033
Figure 79: Latin America Market Volume (Units) Analysis by Thickness, 2018 to 2033
Figure 80: Latin America Market Value Share (%) and BPS Analysis by Thickness, 2023 to 2033
Figure 81: Latin America Market Y-o-Y Growth (%) Projections by Thickness, 2023 to 2033
Figure 82: Latin America Market Value (US$ Million) Analysis by Gender, 2018 to 2033
Figure 83: Latin America Market Volume (Units) Analysis by Gender, 2018 to 2033
Figure 84: Latin America Market Value Share (%) and BPS Analysis by Gender, 2023 to 2033
Figure 85: Latin America Market Y-o-Y Growth (%) Projections by Gender, 2023 to 2033
Figure 86: Latin America Market Attractiveness by Closure Type, 2023 to 2033
Figure 87: Latin America Market Attractiveness by Size, 2023 to 2033
Figure 88: Latin America Market Attractiveness by Thickness, 2023 to 2033
Figure 89: Latin America Market Attractiveness by Gender, 2023 to 2033
Figure 90: Latin America Market Attractiveness by Country, 2023 to 2033
Figure 91: Western Europe Market Value (US$ Million) by Closure Type, 2023 to 2033
Figure 92: Western Europe Market Value (US$ Million) by Size, 2023 to 2033
Figure 93: Western Europe Market Value (US$ Million) by Thickness, 2023 to 2033
Figure 94: Western Europe Market Value (US$ Million) by Gender, 2023 to 2033
Figure 95: Western Europe Market Value (US$ Million) by Country, 2023 to 2033
Figure 96: Western Europe Market Value (US$ Million) Analysis by Country, 2018 to 2033
Figure 97: Western Europe Market Volume (Units) Analysis by Country, 2018 to 2033
Figure 98: Western Europe Market Value Share (%) and BPS Analysis by Country, 2023 to 2033
Figure 99: Western Europe Market Y-o-Y Growth (%) Projections by Country, 2023 to 2033
Figure 100: Western Europe Market Value (US$ Million) Analysis by Closure Type, 2018 to 2033
Figure 101: Western Europe Market Volume (Units) Analysis by Closure Type, 2018 to 2033
Figure 102: Western Europe Market Value Share (%) and BPS Analysis by Closure Type, 2023 to 2033
Figure 103: Western Europe Market Y-o-Y Growth (%) Projections by Closure Type, 2023 to 2033
Figure 104: Western Europe Market Value (US$ Million) Analysis by Size, 2018 to 2033
Figure 105: Western Europe Market Volume (Units) Analysis by Size, 2018 to 2033
Figure 106: Western Europe Market Value Share (%) and BPS Analysis by Size, 2023 to 2033
Figure 107: Western Europe Market Y-o-Y Growth (%) Projections by Size, 2023 to 2033
Figure 108: Western Europe Market Value (US$ Million) Analysis by Thickness, 2018 to 2033
Figure 109: Western Europe Market Volume (Units) Analysis by Thickness, 2018 to 2033
Figure 110: Western Europe Market Value Share (%) and BPS Analysis by Thickness, 2023 to 2033
Figure 111: Western Europe Market Y-o-Y Growth (%) Projections by Thickness, 2023 to 2033
Figure 112: Western Europe Market Value (US$ Million) Analysis by Gender, 2018 to 2033
Figure 113: Western Europe Market Volume (Units) Analysis by Gender, 2018 to 2033
Figure 114: Western Europe Market Value Share (%) and BPS Analysis by Gender, 2023 to 2033
Figure 115: Western Europe Market Y-o-Y Growth (%) Projections by Gender, 2023 to 2033
Figure 116: Western Europe Market Attractiveness by Closure Type, 2023 to 2033
Figure 117: Western Europe Market Attractiveness by Size, 2023 to 2033
Figure 118: Western Europe Market Attractiveness by Thickness, 2023 to 2033
Figure 119: Western Europe Market Attractiveness by Gender, 2023 to 2033
Figure 120: Western Europe Market Attractiveness by Country, 2023 to 2033
Figure 121: Eastern Europe Market Value (US$ Million) by Closure Type, 2023 to 2033
Figure 122: Eastern Europe Market Value (US$ Million) by Size, 2023 to 2033
Figure 123: Eastern Europe Market Value (US$ Million) by Thickness, 2023 to 2033
Figure 124: Eastern Europe Market Value (US$ Million) by Gender, 2023 to 2033
Figure 125: Eastern Europe Market Value (US$ Million) by Country, 2023 to 2033
Figure 126: Eastern Europe Market Value (US$ Million) Analysis by Country, 2018 to 2033
Figure 127: Eastern Europe Market Volume (Units) Analysis by Country, 2018 to 2033
Figure 128: Eastern Europe Market Value Share (%) and BPS Analysis by Country, 2023 to 2033
Figure 129: Eastern Europe Market Y-o-Y Growth (%) Projections by Country, 2023 to 2033
Figure 130: Eastern Europe Market Value (US$ Million) Analysis by Closure Type, 2018 to 2033
Figure 131: Eastern Europe Market Volume (Units) Analysis by Closure Type, 2018 to 2033
Figure 132: Eastern Europe Market Value Share (%) and BPS Analysis by Closure Type, 2023 to 2033
Figure 133: Eastern Europe Market Y-o-Y Growth (%) Projections by Closure Type, 2023 to 2033
Figure 134: Eastern Europe Market Value (US$ Million) Analysis by Size, 2018 to 2033
Figure 135: Eastern Europe Market Volume (Units) Analysis by Size, 2018 to 2033
Figure 136: Eastern Europe Market Value Share (%) and BPS Analysis by Size, 2023 to 2033
Figure 137: Eastern Europe Market Y-o-Y Growth (%) Projections by Size, 2023 to 2033
Figure 138: Eastern Europe Market Value (US$ Million) Analysis by Thickness, 2018 to 2033
Figure 139: Eastern Europe Market Volume (Units) Analysis by Thickness, 2018 to 2033
Figure 140: Eastern Europe Market Value Share (%) and BPS Analysis by Thickness, 2023 to 2033
Figure 141: Eastern Europe Market Y-o-Y Growth (%) Projections by Thickness, 2023 to 2033
Figure 142: Eastern Europe Market Value (US$ Million) Analysis by Gender, 2018 to 2033
Figure 143: Eastern Europe Market Volume (Units) Analysis by Gender, 2018 to 2033
Figure 144: Eastern Europe Market Value Share (%) and BPS Analysis by Gender, 2023 to 2033
Figure 145: Eastern Europe Market Y-o-Y Growth (%) Projections by Gender, 2023 to 2033
Figure 146: Eastern Europe Market Attractiveness by Closure Type, 2023 to 2033
Figure 147: Eastern Europe Market Attractiveness by Size, 2023 to 2033
Figure 148: Eastern Europe Market Attractiveness by Thickness, 2023 to 2033
Figure 149: Eastern Europe Market Attractiveness by Gender, 2023 to 2033
Figure 150: Eastern Europe Market Attractiveness by Country, 2023 to 2033
Figure 151: South Asia and Pacific Market Value (US$ Million) by Closure Type, 2023 to 2033
Figure 152: South Asia and Pacific Market Value (US$ Million) by Size, 2023 to 2033
Figure 153: South Asia and Pacific Market Value (US$ Million) by Thickness, 2023 to 2033
Figure 154: South Asia and Pacific Market Value (US$ Million) by Gender, 2023 to 2033
Figure 155: South Asia and Pacific Market Value (US$ Million) by Country, 2023 to 2033
Figure 156: South Asia and Pacific Market Value (US$ Million) Analysis by Country, 2018 to 2033
Figure 157: South Asia and Pacific Market Volume (Units) Analysis by Country, 2018 to 2033
Figure 158: South Asia and Pacific Market Value Share (%) and BPS Analysis by Country, 2023 to 2033
Figure 159: South Asia and Pacific Market Y-o-Y Growth (%) Projections by Country, 2023 to 2033
Figure 160: South Asia and Pacific Market Value (US$ Million) Analysis by Closure Type, 2018 to 2033
Figure 161: South Asia and Pacific Market Volume (Units) Analysis by Closure Type, 2018 to 2033
Figure 162: South Asia and Pacific Market Value Share (%) and BPS Analysis by Closure Type, 2023 to 2033
Figure 163: South Asia and Pacific Market Y-o-Y Growth (%) Projections by Closure Type, 2023 to 2033
Figure 164: South Asia and Pacific Market Value (US$ Million) Analysis by Size, 2018 to 2033
Figure 165: South Asia and Pacific Market Volume (Units) Analysis by Size, 2018 to 2033
Figure 166: South Asia and Pacific Market Value Share (%) and BPS Analysis by Size, 2023 to 2033
Figure 167: South Asia and Pacific Market Y-o-Y Growth (%) Projections by Size, 2023 to 2033
Figure 168: South Asia and Pacific Market Value (US$ Million) Analysis by Thickness, 2018 to 2033
Figure 169: South Asia and Pacific Market Volume (Units) Analysis by Thickness, 2018 to 2033
Figure 170: South Asia and Pacific Market Value Share (%) and BPS Analysis by Thickness, 2023 to 2033
Figure 171: South Asia and Pacific Market Y-o-Y Growth (%) Projections by Thickness, 2023 to 2033
Figure 172: South Asia and Pacific Market Value (US$ Million) Analysis by Gender, 2018 to 2033
Figure 173: South Asia and Pacific Market Volume (Units) Analysis by Gender, 2018 to 2033
Figure 174: South Asia and Pacific Market Value Share (%) and BPS Analysis by Gender, 2023 to 2033
Figure 175: South Asia and Pacific Market Y-o-Y Growth (%) Projections by Gender, 2023 to 2033
Figure 176: South Asia and Pacific Market Attractiveness by Closure Type, 2023 to 2033
Figure 177: South Asia and Pacific Market Attractiveness by Size, 2023 to 2033
Figure 178: South Asia and Pacific Market Attractiveness by Thickness, 2023 to 2033
Figure 179: South Asia and Pacific Market Attractiveness by Gender, 2023 to 2033
Figure 180: South Asia and Pacific Market Attractiveness by Country, 2023 to 2033
Figure 181: East Asia Market Value (US$ Million) by Closure Type, 2023 to 2033
Figure 182: East Asia Market Value (US$ Million) by Size, 2023 to 2033
Figure 183: East Asia Market Value (US$ Million) by Thickness, 2023 to 2033
Figure 184: East Asia Market Value (US$ Million) by Gender, 2023 to 2033
Figure 185: East Asia Market Value (US$ Million) by Country, 2023 to 2033
Figure 186: East Asia Market Value (US$ Million) Analysis by Country, 2018 to 2033
Figure 187: East Asia Market Volume (Units) Analysis by Country, 2018 to 2033
Figure 188: East Asia Market Value Share (%) and BPS Analysis by Country, 2023 to 2033
Figure 189: East Asia Market Y-o-Y Growth (%) Projections by Country, 2023 to 2033
Figure 190: East Asia Market Value (US$ Million) Analysis by Closure Type, 2018 to 2033
Figure 191: East Asia Market Volume (Units) Analysis by Closure Type, 2018 to 2033
Figure 192: East Asia Market Value Share (%) and BPS Analysis by Closure Type, 2023 to 2033
Figure 193: East Asia Market Y-o-Y Growth (%) Projections by Closure Type, 2023 to 2033
Figure 194: East Asia Market Value (US$ Million) Analysis by Size, 2018 to 2033
Figure 195: East Asia Market Volume (Units) Analysis by Size, 2018 to 2033
Figure 196: East Asia Market Value Share (%) and BPS Analysis by Size, 2023 to 2033
Figure 197: East Asia Market Y-o-Y Growth (%) Projections by Size, 2023 to 2033
Figure 198: East Asia Market Value (US$ Million) Analysis by Thickness, 2018 to 2033
Figure 199: East Asia Market Volume (Units) Analysis by Thickness, 2018 to 2033
Figure 200: East Asia Market Value Share (%) and BPS Analysis by Thickness, 2023 to 2033
Figure 201: East Asia Market Y-o-Y Growth (%) Projections by Thickness, 2023 to 2033
Figure 202: East Asia Market Value (US$ Million) Analysis by Gender, 2018 to 2033
Figure 203: East Asia Market Volume (Units) Analysis by Gender, 2018 to 2033
Figure 204: East Asia Market Value Share (%) and BPS Analysis by Gender, 2023 to 2033
Figure 205: East Asia Market Y-o-Y Growth (%) Projections by Gender, 2023 to 2033
Figure 206: East Asia Market Attractiveness by Closure Type, 2023 to 2033
Figure 207: East Asia Market Attractiveness by Size, 2023 to 2033
Figure 208: East Asia Market Attractiveness by Thickness, 2023 to 2033
Figure 209: East Asia Market Attractiveness by Gender, 2023 to 2033
Figure 210: East Asia Market Attractiveness by Country, 2023 to 2033
Figure 211: Middle East and Africa Market Value (US$ Million) by Closure Type, 2023 to 2033
Figure 212: Middle East and Africa Market Value (US$ Million) by Size, 2023 to 2033
Figure 213: Middle East and Africa Market Value (US$ Million) by Thickness, 2023 to 2033
Figure 214: Middle East and Africa Market Value (US$ Million) by Gender, 2023 to 2033
Figure 215: Middle East and Africa Market Value (US$ Million) by Country, 2023 to 2033
Figure 216: Middle East and Africa Market Value (US$ Million) Analysis by Country, 2018 to 2033
Figure 217: Middle East and Africa Market Volume (Units) Analysis by Country, 2018 to 2033
Figure 218: Middle East and Africa Market Value Share (%) and BPS Analysis by Country, 2023 to 2033
Figure 219: Middle East and Africa Market Y-o-Y Growth (%) Projections by Country, 2023 to 2033
Figure 220: Middle East and Africa Market Value (US$ Million) Analysis by Closure Type, 2018 to 2033
Figure 221: Middle East and Africa Market Volume (Units) Analysis by Closure Type, 2018 to 2033
Figure 222: Middle East and Africa Market Value Share (%) and BPS Analysis by Closure Type, 2023 to 2033
Figure 223: Middle East and Africa Market Y-o-Y Growth (%) Projections by Closure Type, 2023 to 2033
Figure 224: Middle East and Africa Market Value (US$ Million) Analysis by Size, 2018 to 2033
Figure 225: Middle East and Africa Market Volume (Units) Analysis by Size, 2018 to 2033
Figure 226: Middle East and Africa Market Value Share (%) and BPS Analysis by Size, 2023 to 2033
Figure 227: Middle East and Africa Market Y-o-Y Growth (%) Projections by Size, 2023 to 2033
Figure 228: Middle East and Africa Market Value (US$ Million) Analysis by Thickness, 2018 to 2033
Figure 229: Middle East and Africa Market Volume (Units) Analysis by Thickness, 2018 to 2033
Figure 230: Middle East and Africa Market Value Share (%) and BPS Analysis by Thickness, 2023 to 2033
Figure 231: Middle East and Africa Market Y-o-Y Growth (%) Projections by Thickness, 2023 to 2033
Figure 232: Middle East and Africa Market Value (US$ Million) Analysis by Gender, 2018 to 2033
Figure 233: Middle East and Africa Market Volume (Units) Analysis by Gender, 2018 to 2033
Figure 234: Middle East and Africa Market Value Share (%) and BPS Analysis by Gender, 2023 to 2033
Figure 235: Middle East and Africa Market Y-o-Y Growth (%) Projections by Gender, 2023 to 2033
Figure 236: Middle East and Africa Market Attractiveness by Closure Type, 2023 to 2033
Figure 237: Middle East and Africa Market Attractiveness by Size, 2023 to 2033
Figure 238: Middle East and Africa Market Attractiveness by Thickness, 2023 to 2033
Figure 239: Middle East and Africa Market Attractiveness by Gender, 2023 to 2033
Figure 240: Middle East and Africa Market Attractiveness by Country, 2023 to 2033
The market for scuba gloves is estimated to reach USD 173.8 million by 2033.
The rapid growth of the global tourism industry, especially in scuba diving destinations fosters increased demand for scuba gloves.
The steady growth and aggressive marketing campaigns targeting the young population promote water sports activities.
Diverse dynamics and a steadfast commitment to quality, driving continuous advancement in the industry.
Aqua Lung International, Baresports Company, and UTD International, Inc. are the market players.
Explore Sports & Recreation Insights
Thank you!
You will receive an email from our Business Development Manager. Please be sure to check your SPAM/JUNK folder too.