
- Market Size (2026)
- USD 468.0 Mn
- Forecast (2036)
- USD 1214.0 Mn
- CAGR (2026 to 2036)
- 10.0%
How big is the Sea Buckthorn Market in 2026?
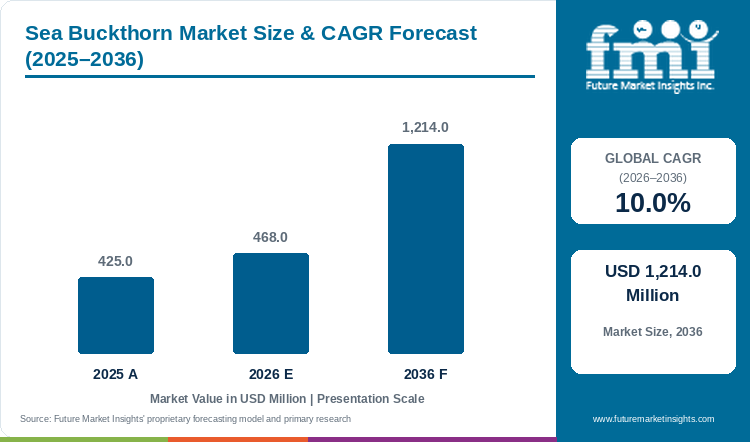
The Sea Buckthorn Market is projected to reach USD 1,214.0 million by 2036, growing at a 10.0% CAGR from 2026 to 2036. FMI estimates the market at USD 468.0 million in 2026, after USD 425.0 million in 2025. Pulp goes mainly to juice, and the seeds yield highly valued oil for supplements and functional foods [5]. Commercial products are usually fruit powders, oil capsules and cosmetics based on pulp oil or seed oil [2].
A 2023 review put world area at 2.33 million hectares in December 2020, wild and planted combined [2]. China held 2.07 million of those hectares, which makes supply highly concentrated [2]. Germany harvested only 466 tonnes of sea buckthorn in 2025 [17]. Plantings take about three years to bear fruit [4]. Ladakh in India harvested 666 tonnes in 2024, and an August 2026 report says buyers struggle to find berries [4]. Xinjiang alone has nearly 70,000 hectares of large-fruited plantings, according to a June 2026 report [1]. Demand in the United States stays broad, with 60.2% of adults taking a dietary supplement in a month [9].
Key Market Trends & Insights
- Juice holds 45.0% of the 2026 market by form and is well established in Scandinavia, China, Germany and Finland [5]. Hybrid cultivars bred for juice give 80.0% to 90.0% juice, against 50.0% to 60.0% for the rhamnoides subspecies [2].
- Processors are moving closer to the harvest, because the berry cannot wait after picking. A food unit in Tirith, Ladakh, holds mobile aseptic processing capacity [20]. In Xinjiang, one grower developed more than ten products, including seed oil and capsules [1].
- Commercial products, including cosmetics for sensitive skin, are usually based on dried fruit or fruit and seed oils [2]. Supplement products are made as fruit powders, oil capsules or vitamin C tablets [2].
Regional Highlights
- In Asia Pacific, beyond China, Mongolia reported 20,000 hectares and Pakistan 5,700 hectares in December 2020 [2]. India has about 13,000 hectares, and 70.0% of that lies in Ladakh [4].
- In Europe, Romania reported 15,000 hectares in December 2020 [2], and Germany farmed 519 hectares in 2025 [17]. In North America, Canada reports more than 250,000 mature fruit-bearing plants on its prairies [5].
Sea Buckthorn Market Size and Forecast
Table 1: Sea Buckthorn Market Size and Forecast
| Market size and forecast | Value |
|---|---|
| Market size in 2025 | USD 425.0 million |
| Estimated market size in 2026 | USD 468.0 million |
| Projected market size by 2036 | USD 1,214.0 million |
| CAGR from 2026 to 2036 | 10.0% |
Source: Future Market Insights analysis of the sea buckthorn market, 2026.
Analyst Perspective
“Sea buckthorn is a niche crop with strong Asian demand and a growing Western supplement and skincare following, and its value rises with processing, since juice, oil and extracts sell at far higher prices than raw berries. Suppliers need traceable sourcing and careful claims, because marketing health benefits beyond what regulators allow risks removal from shelves.”
- Nandini Roy Choudhury, Principal Analyst at Future Market Insights
How is the Sea Buckthorn Market segmented?
- By form: Juice, Oil, Powder, Others.
- By application: Dietary Supplements, Cosmetics and Personal Care, Food and Beverages, Pharmaceuticals, Others.
- By sales channel: Retail, Direct to Business and Industrial Buyers.
- By region: North America, Latin America, Europe, East Asia, South Asia, Oceania, Middle East and Africa.
Why does Juice lead by Form in the Sea Buckthorn Market in 2026?
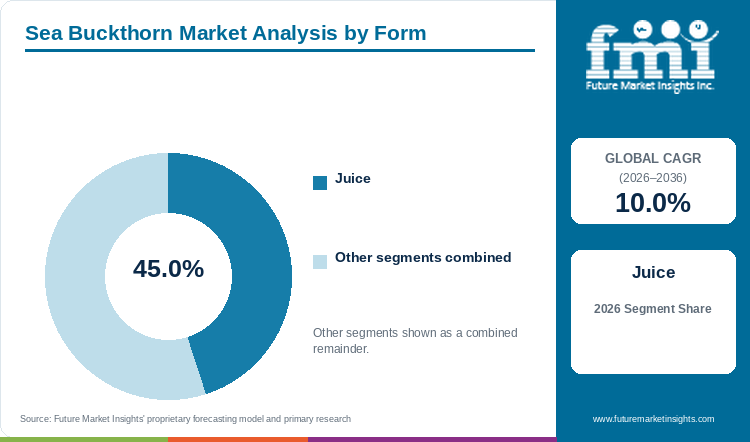
Juice holds 45.0% of the Sea Buckthorn Market by form in 2026.
The berries taste tart and often need considerable sweetening to balance the flavor [2]. Pulp is mainly processed into juice, and the seeds are used to extract highly valued oil [5]. The other forms, oil and powder among them, hold the remaining 55.0%.
Table 2: Form, 2026 Share
| Leading Share | 2026 market share |
|---|---|
| Juice | 45.0% |
| All Other Segments Combined Share | 55.0% |
Source: Future Market Insights analysis of the sea buckthorn market, 2026.
Why do Dietary Supplements lead by Application in the Sea Buckthorn Market in 2026?
Dietary supplements hold 26.0% of the Sea Buckthorn Market by application in 2026.
Within the dietary supplements market, sea buckthorn sells as oil capsules, fruit powders and vitamin C tablets [2]. Seed oil holds a prominent place in health supplement formulations [5]. Cosmetics and personal care, food and beverages, pharmaceuticals and other uses hold the remaining 74.0% combined. Pharmaceutical use is recognised in China, where sea buckthorn has been part of the national Pharmacopoeia since 1977 [5].
Table 3: Application, 2026 Share
| Leading Share | 2026 market share |
|---|---|
| Dietary Supplements | 26.0% |
| All Other Segments Combined Share | 74.0% |
Source: Future Market Insights analysis of the sea buckthorn market, 2026.
Why does Retail lead by Sales Channel in the Sea Buckthorn Market in 2026?
Retail holds 58.0% of the Sea Buckthorn Market by sales channel in 2026.
Retail covers shelf formats such as juice, oil capsules and skin care. In Germany, drugstore chains grew organic sales by 14.4% in 2025 and are well placed in shelf-stable health lines [7]. Direct sales to business and industrial buyers hold the remaining 42.0%. These buyers take pulp, oil and powder in bulk, since pulp goes to juice and seeds go to oil [5].
Table 4: Sales Channel, 2026 Share
| Leading Share | 2026 market share |
|---|---|
| Retail | 58.0% |
| All Other Segments Combined Share | 42.0% |
Source: Future Market Insights analysis of the sea buckthorn market, 2026.
What are the key drivers, restraints and opportunities?
Driver
Demand from supplements and skin care. Makers of skin care and supplement products buy fruit pulp oil and seed oil [2]. In the United States, 60.2% of adults used a dietary supplement in the past 30 days [9]. Among US adults, 38.7% took two or more [9].
Strong planting base in Asia. Large-fruited plantings in Xinjiang have reached nearly 70,000 hectares over two decades [1]. The 23,150 mu planted since 2019 in one Emin County township reached full fruiting in 2026 [22].
Restraint
Pests limit commercial supply. The sea buckthorn fruit fly can cause total loss of a harvest [2]. It has damaged orchards in the Baltic countries, Poland, Romania and Germany [2]. In China, a 2025 model finds 61.95% of suitable land exposed to at least one of two pests [6].
Narrow production base. China held 2.07 million of the world's 2.33 million hectares in December 2020 [2]. Germany harvested only 466 tonnes in 2025 [17]. FMI expects buyers outside Asia to depend on imports, which exposes them to harvest and trade shocks.
Opportunity
Oil and extracts for supplements and skin care. Oil and extracts overlap with the sea buckthorn berry extract market and add value [5]. The seeds yield highly valued oil [5]. In October 2026 one Ukrainian craft producer reported 150 milliliters of oil from 10 kilograms of fresh berries [23].
Cultivation in new regions. Ladakh's administration said on 18 September 2026 that it will promote curated cultivation to raise harvest recovery [18]. A Canadian program begun in 1995 produced Harvest Moon, a cultivar suited to the northern Great Plains [2].
Sea Buckthorn Market by Country (2026 to 2036)
Table 5: Sea Buckthorn Market Country Growth Forecast
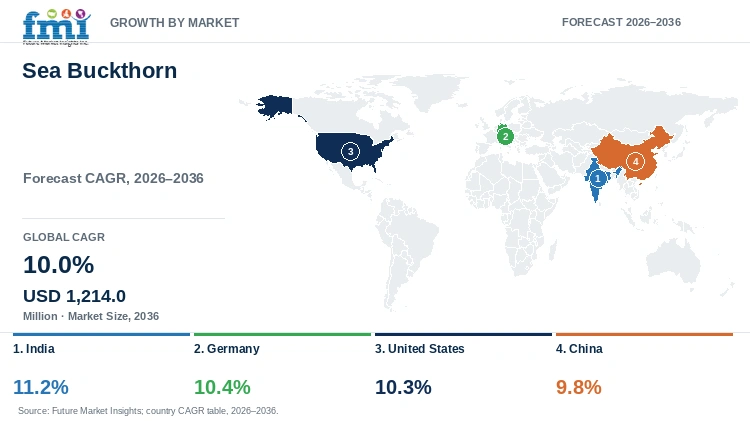
| Country | CAGR, 2026 to 2036 |
|---|---|
| India | 11.2% |
| Germany | 10.4% |
| United States | 10.3% |
| China | 9.8% |
Source: Future Market Insights analysis of the sea buckthorn market, 2026.
India
The country has about 13,000 hectares under sea buckthorn, and 70.0% of that lies in Ladakh [4]. Ladakh's harvest rose from 315 tonnes in 2023 to 666 tonnes in 2024 [4]. The administration says almost 85.0% of the annual crop goes unused because the wild bushes are dense and thorny [18]. India's projected CAGR of 11.2% for 2026 to 2036 is the fastest among the profiled countries.
Wild harvest sets Indian supply. Wild stands yield 750 to 1,500 kilograms of berries per hectare, while orchards can reach 10 tonnes [5]. Picking is hard because the bushes are thorny and the fruit bruises and spoils fast [4]. New plantings need about three years to bear fruit [4]. On 18 September 2026 the Lieutenant Governor announced a minimum procurement price of Rs 300 per kilogram [18]. The price a year earlier was Rs 150 [18].
Domestic demand now pulls the crop. One Ladakh processor reports exports down almost 60.0% on tariffs, yet Indian buyers struggle to source enough berries [4]. Another processor receives requests for 200 to 300 tonnes but produces 100 to 110 tonnes in a season [4]. Invest India estimates that Ladakh sea buckthorn could generate Rs 500 crore a year by 2030 [4]. A 3 June 2026 ministerial column says Leh has an approved common incubation centre for sea buckthorn processing [20]. Harvest runs from late August through September, so buyers that want volume need contracts in place before picking starts [4].
Germany
Commercial orchards and processing plants operate in Germany [2]. Juice is among the most popular sea buckthorn products there [5]. Cultivars such as Askola and Dorana were released in Berlin from 1979, based on selection in wild stands [2]. The sea buckthorn fruit fly has caused severe damage in German orchards [2]. A 10.4% CAGR is projected for Germany over 2026 to 2036.
Domestic supply is small and mostly organic. Official statistics show 176 hectares harvested in 2025 and a further 343 hectares not harvested [17]. The harvest of 466 tonnes equals 2.65 tonnes per harvested hectare, against up to 10 tonnes cited for orchards [17][5]. The 466 tonnes compare with 45,747 tonnes for all shrub berries, or about 1.0% [17]. Fully organic holdings farmed 480 hectares in 2025 [3]. Organic sea buckthorn area fell 9.4% from 530 hectares in 2024, while total organic berry area fell 2.6% [3][8].
Demand follows organic retail, which grew 6.7% to EUR 18.2 billion in 2025 [7]. Organic products held 6.5% of German food and drink sales [7]. Organic shares at online grocery services reach up to 28.0% of sales [7]. Drugstore chains grew organic sales 14.4% and are strongly placed in shelf-stable health and lifestyle lines [7]. Supplements and oils are shelf-stable formats, so FMI expects drugstores to gain share in them. With domestic organic area shrinking, FMI expects imported pulp and oil to supply the growth.
United States
A 2023 review lists the USA among countries where sea buckthorn has been introduced [2]. In October 2026 Unibar announced ElaQuin, which pairs sea buckthorn oil with thymoquinone for women's healthy aging [24]. Supplement demand leads a projected 10.3% CAGR for the United States from 2026 to 2036.
Adoption in the United States is already broad, so growth depends on ingredient choice among current users. Between August 2021 and August 2023, 60.2% of adults reported using at least one supplement over the prior month [9]. Use reaches 66.1% among women and 75.9% among adults aged 60 and older [9]. Adults taking any supplement rose from 53.8% in 2013 and 2014 to 60.2% in the 2021 to 2023 survey [9]. Adults taking two or more supplements reached 38.7%, up from 30.9% in 2013 and 2014 [9]. Multi-product users add ingredients to an existing routine, so FMI expects trial to come mainly from current users.
Local supply is limited, since the species reached the United States by introduction [2]. An Indian e-commerce firm reports export enquiries from Australia, the United States and Europe [4]. SeabuckWonders says it uses USDA organic Himalayan berries and has access to its own crop [10]. Erbology sells juice in the United States from berries sourced from small farmers in Eastern Europe [12]. FMI expects import access to matter more than local harvest for US growth, so brands should secure certified imported supply.
China
A 2025 study cites official statistics of more than 1.27 million hectares in 2021, with 55.0% planted [6]. The 2023 review gives 2.07 million hectares for December 2020, so estimates differ by source [2]. In Xinjiang, the planting area of large-fruited sea buckthorn has reached nearly 70,000 hectares over two decades [1]. For China the 2026 to 2036 projection is a 9.8% CAGR.
Ecological programs shape Chinese supply as much as market demand does. A 2025 study describes sea buckthorn as a shrub used to restore degraded areas and support regional economies [6]. Official statistics cited in that study show annual output value above RMB 24.0 billion as of 2021 [6]. Direct fruit income per hectare exceeded RMB 3,100 a year [6]. In Emin County, Xinjiang, growers receive RMB 3.5 to 4.0 per kilogram of fruit [22]. Fruit sales alone give growers a limited return, so FMI expects planting to follow ecological programs and processing demand.
Pests set a second limit on supply. A 2025 model finds 61.95% of suitable land in China exposed to at least one of two pests [6]. Severe infestation is likely in northern Xinjiang, Ningxia and parts of Gansu, Shaanxi and Shanxi [6]. Pest-free suitable land lies mainly in western and central Xinjiang and northern Gansu [6]. FMI expects new commercial plantings to prefer those zones, which limits area growth elsewhere. Buyers should ask Chinese suppliers which planting zone supplies their fruit, because pest exposure differs by province [6].
Who are the notable companies in the Sea Buckthorn Market?
Notable companies in the Sea Buckthorn Market include SeabuckWonders, SIBU, Erbology, Natures Aid and Leh Berry.
Access to berries and an extraction step separate sea buckthorn suppliers. Pulp goes to juice and seeds go to oil, so suppliers need a berry source and an extraction step [5]. SeabuckWonders says it has its own organic Himalayan crop and a cGMP certified facility [10]. W.S. Badger Company makes organic skin care in New Hampshire, and its Radiant Glow Beauty Oil contains sea buckthorn [14].
SIBU sources wild-grown Himalayan berries and says it processes them within hours of harvest [11]. Its fruit and seed oils are CO2 extracted [11]. Natures Aid, a UK brand, sells a vegan oil softgel and offers private label manufacturing [15]. Each two-capsule dose gives 300 milligrams of omega-7 palmitoleic acid [15]. Buyers qualifying supplement suppliers should request records of origin and extraction method.
Erbology sources organic berries from small farmers in Eastern Europe [12]. It makes juice by washing, grinding, extruding and pasteurising the pulp [13]. Leh Berry is a juice brand that uses technology developed by India's Defence Research and Development Organisation [16]. In Ladakh the harvest window is short, so processors there pulp and pack berries close to the harvest [20].
Key Developments in the Sea Buckthorn Market
- On 21 August 2026 the Indian Council of Agricultural Research formed a committee on a sea buckthorn research centre [19]. The proposed National Sanjeevani Research Centre would sit in Nubra Valley, Ladakh [19]. The committee began field work on 24 August 2026 and was asked to report within 45 days [19].
- By 30 October 2026 all four phase-one buildings of Shanxi Xingyu Biotechnology's sea buckthorn plant were topped out [21]. Phase one covers an extraction workshop, a packaging store and an aseptic filling workshop [21]. Equipment is due to start arriving in December 2026 [21].
- In 2026 the 23,150 mu planted since 2019 in Lamazhao township, Emin County, reached full fruiting [22]. That is about 1,543 hectares in Xinjiang, with an expected harvest of 4,600 tonnes [22]. The township plans a 2,000 square meter cold store and sought RMB 12.0 million of project funding [22].
Key Players in the Sea Buckthorn Market
- SeabuckWonders
- SIBU
- Erbology Ltd
- W.S. Badger Company, Inc.
- Natures Aid Ltd
- Leh Berry
Sea Buckthorn Market Report Scope
Table 6: Sea Buckthorn Market Report Scope
| Coverage field | Report scope |
|---|---|
| Market definition | Sea buckthorn berries and products made from them, including juice, oil, powder and extracts, sold for dietary supplements, cosmetics and personal care, food and beverages, and pharmaceutical use, valued at manufacturer selling prices. Plants and landscaping uses are excluded. |
| Form | Juice; Oil; Powder; Others |
| Application | Dietary Supplements; Cosmetics and Personal Care; Food and Beverages; Pharmaceuticals; Others |
| Sales Channel | Retail; Direct to Business and Industrial Buyers |
| Regions and profiled countries | North America, Latin America, Europe, East Asia, South Asia, Oceania, Middle East and Africa. Profiled countries: India, Germany, United States, China |
| Companies covered | SeabuckWonders; SIBU; Erbology Ltd; W.S. Badger Company, Inc.; Natures Aid Ltd; Leh Berry |
| Quantitative Units | USD million |
Sea Buckthorn Market by Segments
Sea Buckthorn Market segmented by Form:
- Juice
- Oil
- Powder
- Others
Sea Buckthorn Market segmented by Application:
- Dietary Supplements
- Cosmetics and Personal Care
- Food and Beverages
- Pharmaceuticals
- Others
Sea Buckthorn Market segmented by Sales Channel:
- Retail
- Direct to Business and Industrial Buyers
Sea Buckthorn Market by Region
- North America
- Latin America
- Europe
- East Asia
- South Asia
- Oceania
- Middle East
- Africa
- India
- Germany
- United States
- China
Research Sources and Bibliography
- [1] CGTN. (2026, June 2). Sea buckthorn's win-win results in northwest China. https://news.cgtn.com/news/2026-06-02/Sea-buckthorn-s-win-win-results-in-northwest-China-1NEgQFuaiiI/p.html
- [2] Nybom, H. et al. (2023). The Systematics, Reproductive Biology, Biochemistry, and Breeding of Sea Buckthorn: A Review. Genes. https://www.mdpi.com/2073-4425/14/12/2120
- [3] Statistisches Bundesamt (Destatis). (2026, February 10). Strauchbeerenernte 2025 um gut 23 % gestiegen (Pressemitteilung Nr. 045). https://www.destatis.de/DE/Presse/Pressemitteilungen/2026/02/PD26_045_412.html
- [4] ThePrint. (2026, August 6). Ladakh's sea buckthorn gold rush. Entrepreneurs are minting crores from 'Sanjeevani booti'. https://theprint.in/ground-reports/ladakhs-sea-buckthorn-gold-rush-entrepreneurs-are-minting-crores-from-sanjeevani-booti/3006776/
- [5] Thapliyal, V. et al. (2025, October 7). Seabuckthorn Hippophae rhamnoides: A Miracle Shrub to Combat Environmental Shift. Defence Life Science Journal. https://publicationsdrdo.in/index.php/dlsj/article/download/21475/8668
- [6] Nie, Y. et al. (2025). Optimal Planting Areas of Sea Buckthorn (Hippophae rhamnoides) Under the Influences of Climate Change and Pests Using the MaxEnt Model. Agronomy. https://www.mdpi.com/2073-4395/15/12/2777
- [7] Oekolandbau.de, Arbeitskreis Biomarkt (AMI). (2026, February 10). Der Bio-Markt wächst auch 2025 deutlich. https://www.oekolandbau.de/aktuelles/bio-marktinformationen/der-bio-markt-waechst-auch-2025-deutlich/
- [8] Statistisches Bundesamt (Destatis). (2025, February 7). Strauchbeerenernte 2024 um knapp 11 % gesunken (Pressemitteilung Nr. 051). https://www.destatis.de/DE/Presse/Pressemitteilungen/2025/02/PD25_051_412.html
- [9] National Center for Health Statistics. (2026, May 21). Dietary Supplement Use: United States, August 2021 to August 2023 (NCHS Data Brief No. 561). https://www.cdc.gov/nchs/products/databriefs/db561.htm
- [10] SeabuckWonders. (n.d.). About SeabuckWonders: The Original Sea Buckthorn Company. https://www.seabuckwonders.com/pages/company-overview
- [11] SIBU. (n.d.). Sea Buckthorn: The Himalayan hero ingredient. https://www.sibu.com/pages/sea-buckthorn-berry
- [12] Erbology. (n.d.). Sea buckthorn: sourced straight from small farmers in Eastern Europe. https://erbology.co/us/product-ingredients/sea-buckthorn/
- [13] Erbology. (n.d.). How do you make your sea buckthorn juice? https://erbology.co/help/how-do-you-make-your-sea-buckthorn-juice/
- [14] W.S. Badger Company. (n.d.). Radiant Glow Beauty Oil. https://www.badgerbalm.com/products/organic-seabuckthorn-face-oil
- [15] Natures Aid. (n.d.). Natures Aid Sea Buckthorn Oil 500mg. https://www.naturesaid.co.uk/vegan-c16/sea-buckthorn-oil-500mg-p52
- [16] Seabuckthorn Beverages (Leh Berry). (2020, June 23). Company Profile. https://golehberry.com/company/
- [17] Statistisches Bundesamt (Destatis). (2026, February 10). Strauchbeerenanbau 2025 (table). https://www.destatis.de/DE/Themen/Branchen-Unternehmen/Landwirtschaft-Forstwirtschaft-Fischerei/Obst-Gemuese-Gartenbau/Tabellen/strauchbeerenanbau.html
- [18] Daily Excelsior. (2026, September 18). LG Saxena inaugurates two-day International Sea Buckthorn Conclave in Ladakh. https://www.dailyexcelsior.com/lg-saxena-inaugurates-two-day-international-sea-buckthorn-conclave-in-ladakh/
- [19] ET Bureau, The Economic Times. (2026, August 25). Boost for Ladakh: High-level panel to plan national sea buckthorn research hub. https://economictimes.indiatimes.com/news/india/boost-for-ladakh-high-level-panel-to-plan-national-sea-buckthorn-research-hub/articleshow/133492879.cms
- [20] Paswan, C. (2026, June 3). From Ladakh, a sea buckthorn parable about enterprise. The Indian Express. https://indianexpress.com/article/opinion/columns/chirag-paswan-writes-from-ladakh-a-sea-buckthorn-parable-about-enterprise-10721053/
- [21] Taiyuan Daily. (2026, November 1). Xingyu sea buckthorn deep-processing project: all four phase-one buildings topped out (in Chinese). https://www.sohu.com/a/1095576357_121186586
- [22] Xinjiang Daily, via Guangming Online. (2026, September 28). One sea buckthorn seedling grows into a chain (in Chinese). https://difang.gmw.cn/xj/2026-09/28/content_39025380.htm
- [23] AgroNews. (2026, October 17). Ukrainian craft brand launches production of sea buckthorn oil. https://agronews.ua/en/news/ukrainian-craft-brand-launches-production-of-sea-buckthorn-oil/
- [24] Nutritional Outlook. (2026, October 28). The Reason Behind Pairing Sea Buckthorn Oil and Thymoquinone. https://www.nutritionaloutlook.com/view/reason-pairing-sea-buckthorn-oil-thymoquinone
Table of Content
Table of Content
- Key Takeaways
- Market Size and CAGR
- Top Growth Driver
- Fastest Growing Segment
- Leading Region
- Key Companies
- Emerging Opportunities
- Executive Summary
- Global Market Outlook
- Demand-side Trends
- Supply-side Trends
- Technology Roadmap Analysis
- Analysis and Recommendations
- Analyst Perspective (What is happening? Why now? What should investors know?)
- Key Questions Answered
- How large is the market?
- What is the CAGR?
- What are key trends?
- Which region dominates?
- Who are the leaders?
Read More...
- Market Overview
- Market Coverage / Taxonomy
- Market Definition / Scope / Limitations
- Research Methodology
- Chapter Orientation
- Analytical Lens and Working Hypotheses
- Market Structure, Signals, and Trend Drivers
- Benchmarking and Cross-market Comparability
- Market Sizing, Forecasting, and Opportunity Mapping
- Research Design and Evidence Framework
- Desk Research Programme (Secondary Evidence)
- Expert Input and Fieldwork (Primary Evidence)
- Tooling, Models, and Reference Databases
- Data Engineering and Model Build
- Quality Assurance and Audit Trail
- Market Background
- Market Dynamics (Drivers, Restraints, Opportunity, Trends)
- Scenario Forecast (Optimistic, Likely, Conservative)
- Impact Analysis
- AI Impact
- Sustainability Impact
- Regulatory Impact
- Technology Impact
- Consumer / Buyer Analysis
- Purchase Drivers
- Adoption Barriers
- Buyer Journey
- Opportunity Map Analysis
- Product Life Cycle Analysis
- Supply Chain Analysis
- Investment Feasibility Matrix
- Value Chain Analysis
- PESTLE and Porter's Analysis
- Regulatory Landscape
- Regional Parent Market Outlook
- Production and Consumption Statistics
- Import and Export Statistics
- Global Market Analysis and Forecast, 2021 to 2036
- Historical Market Size Value (USD Million) Analysis, 2021 to 2025
- Current and Future Market Size Value (USD Million) Projections, 2026 to 2036
- Y-o-Y Growth Trend Analysis
- Absolute $ Opportunity Analysis
- Global Market Pricing Analysis, 2021 to 2036
- Global Market Analysis and Forecast, By Form, 2021 to 2036
- Introduction / Key Findings
- Historical Market Size Value (USD Million) Analysis By Form, 2021 to 2025
- Current and Future Market Size Value (USD Million) Analysis and Forecast By Form, 2026 to 2036
- Juice
- Oil
- Powder
- Others
- Y-o-Y Growth Trend Analysis By Form, 2021 to 2025
- Absolute $ Opportunity Analysis By Form, 2026 to 2036
- Global Market Analysis and Forecast, By Application, 2021 to 2036
- Introduction / Key Findings
- Historical Market Size Value (USD Million) Analysis By Application, 2021 to 2025
- Current and Future Market Size Value (USD Million) Analysis and Forecast By Application, 2026 to 2036
- Dietary Supplements
- Cosmetics and Personal Care
- Food and Beverages
- Pharmaceuticals
- Others
- Y-o-Y Growth Trend Analysis By Application, 2021 to 2025
- Absolute $ Opportunity Analysis By Application, 2026 to 2036
- Global Market Analysis and Forecast, By Sales Channel, 2021 to 2036
- Introduction / Key Findings
- Historical Market Size Value (USD Million) Analysis By Sales Channel, 2021 to 2025
- Current and Future Market Size Value (USD Million) Analysis and Forecast By Sales Channel, 2026 to 2036
- Retail
- Direct to Business and Industrial Buyers
- Y-o-Y Growth Trend Analysis By Sales Channel, 2021 to 2025
- Absolute $ Opportunity Analysis By Sales Channel, 2026 to 2036
- Global Market Analysis and Forecast, By Region, 2021 to 2036
- Introduction
- Historical Market Size Value (USD Million) Analysis By Region, 2021 to 2025
- Current Market Size Value (USD Million) Analysis and Forecast By Region, 2026 to 2036
- North America
- Latin America
- Europe
- East Asia
- South Asia
- Oceania
- Middle East
- Africa
- Market Attractiveness Analysis By Region
- North America Market Analysis and Forecast, By Country, 2021 to 2036
- Historical Market Size Value (USD Million) Trend Analysis By Market Taxonomy, 2021 to 2025
- Market Size Value (USD Million) Forecast By Market Taxonomy, 2026 to 2036
- By Country
- By Form
- By Application
- By Sales Channel
- Market Attractiveness Analysis
- By Country
- By Form
- By Application
- By Sales Channel
- Key Takeaways
- Latin America Market Analysis and Forecast, By Country
- Historical Market Size Value (USD Million) Trend Analysis By Market Taxonomy, 2021 to 2025
- Market Size Value (USD Million) Forecast By Market Taxonomy, 2026 to 2036
- By Country
- By Form
- By Application
- By Sales Channel
- Market Attractiveness Analysis
- By Country
- By Form
- By Application
- By Sales Channel
- Key Takeaways
- Europe Market Analysis and Forecast, By Country
- Historical Market Size Value (USD Million) Trend Analysis By Market Taxonomy, 2021 to 2025
- Market Size Value (USD Million) Forecast By Market Taxonomy, 2026 to 2036
- By Country
- By Form
- By Application
- By Sales Channel
- Market Attractiveness Analysis
- By Country
- By Form
- By Application
- By Sales Channel
- Key Takeaways
- East Asia Market Analysis and Forecast, By Country
- Historical Market Size Value (USD Million) Trend Analysis By Market Taxonomy, 2021 to 2025
- Market Size Value (USD Million) Forecast By Market Taxonomy, 2026 to 2036
- By Country
- By Form
- By Application
- By Sales Channel
- Market Attractiveness Analysis
- By Country
- By Form
- By Application
- By Sales Channel
- Key Takeaways
- South Asia Market Analysis and Forecast, By Country
- Historical Market Size Value (USD Million) Trend Analysis By Market Taxonomy, 2021 to 2025
- Market Size Value (USD Million) Forecast By Market Taxonomy, 2026 to 2036
- By Country
- By Form
- By Application
- By Sales Channel
- Market Attractiveness Analysis
- By Country
- By Form
- By Application
- By Sales Channel
- Key Takeaways
- Oceania Market Analysis and Forecast, By Country
- Historical Market Size Value (USD Million) Trend Analysis By Market Taxonomy, 2021 to 2025
- Market Size Value (USD Million) Forecast By Market Taxonomy, 2026 to 2036
- By Country
- By Form
- By Application
- By Sales Channel
- Market Attractiveness Analysis
- By Country
- By Form
- By Application
- By Sales Channel
- Key Takeaways
- Middle East Market Analysis and Forecast, By Country
- Historical Market Size Value (USD Million) Trend Analysis By Market Taxonomy, 2021 to 2025
- Market Size Value (USD Million) Forecast By Market Taxonomy, 2026 to 2036
- By Country
- By Form
- By Application
- By Sales Channel
- Market Attractiveness Analysis
- By Country
- By Form
- By Application
- By Sales Channel
- Key Takeaways
- Africa Market Analysis and Forecast, By Country
- Historical Market Size Value (USD Million) Trend Analysis By Market Taxonomy, 2021 to 2025
- Market Size Value (USD Million) Forecast By Market Taxonomy, 2026 to 2036
- By Country
- India
- Germany
- United States
- China
- By Form
- By Application
- By Sales Channel
- By Country
- Market Attractiveness Analysis
- By Country
- By Form
- By Application
- By Sales Channel
- Key Takeaways
- Key Countries Market Analysis
- United States
- Pricing Analysis
- Market Share Analysis, 2025
- By Form
- By Application
- By Sales Channel
- Germany
- Pricing Analysis
- Market Share Analysis, 2025
- By Form
- By Application
- By Sales Channel
- India
- Pricing Analysis
- Market Share Analysis, 2025
- By Form
- By Application
- By Sales Channel
- China
- Pricing Analysis
- Market Share Analysis, 2025
- By Form
- By Application
- By Sales Channel
- United States
- Market Structure Analysis
- Competition Dashboard
- Competition Benchmarking
- Market Share Analysis of Top Players
- By Regional
- By Form
- By Application
- By Sales Channel
- Emerging Startups
- Innovation Benchmarking
- Competition Analysis
- Competition Deep Dive
- SeabuckWonders
- Overview
- Product Portfolio
- Profitability by Market Segments
- Sales Footprint
- Strategy Overview
- Marketing Strategy
- Product Strategy
- Channel Strategy
- SIBU
- Erbology Ltd
- W.S. Badger Company, Inc.
- Natures Aid Ltd
- Leh Berry
- SeabuckWonders
- Case Studies
- Success Stories
- Recent Developments
- Competition Deep Dive
- Assumptions & Acronyms Used
List of Tables
- Table 1: Global Market Value (USD Million) Forecast by Region, 2021 to 2036
- Table 2: Global Market Value (USD Million) Forecast by Form, 2021 to 2036
- Table 3: Global Market Value (USD Million) Forecast by Application, 2021 to 2036
- Table 4: Global Market Value (USD Million) Forecast by Sales Channel, 2021 to 2036
- Table 5: North America Market Value (USD Million) Forecast by Country, 2021 to 2036
- Table 6: North America Market Value (USD Million) Forecast by Form, 2021 to 2036
- Table 7: North America Market Value (USD Million) Forecast by Application, 2021 to 2036
- Table 8: North America Market Value (USD Million) Forecast by Sales Channel, 2021 to 2036
- Table 9: Latin America Market Value (USD Million) Forecast by Country, 2021 to 2036
- Table 10: Latin America Market Value (USD Million) Forecast by Form, 2021 to 2036
- Table 11: Latin America Market Value (USD Million) Forecast by Application, 2021 to 2036
- Table 12: Latin America Market Value (USD Million) Forecast by Sales Channel, 2021 to 2036
- Table 13: Europe Market Value (USD Million) Forecast by Country, 2021 to 2036
- Table 14: Europe Market Value (USD Million) Forecast by Form, 2021 to 2036
- Table 15: Europe Market Value (USD Million) Forecast by Application, 2021 to 2036
- Table 16: Europe Market Value (USD Million) Forecast by Sales Channel, 2021 to 2036
- Table 17: East Asia Market Value (USD Million) Forecast by Country, 2021 to 2036
- Table 18: East Asia Market Value (USD Million) Forecast by Form, 2021 to 2036
- Table 19: East Asia Market Value (USD Million) Forecast by Application, 2021 to 2036
- Table 20: East Asia Market Value (USD Million) Forecast by Sales Channel, 2021 to 2036
- Table 21: South Asia Market Value (USD Million) Forecast by Country, 2021 to 2036
- Table 22: South Asia Market Value (USD Million) Forecast by Form, 2021 to 2036
- Table 23: South Asia Market Value (USD Million) Forecast by Application, 2021 to 2036
- Table 24: South Asia Market Value (USD Million) Forecast by Sales Channel, 2021 to 2036
- Table 25: Oceania Market Value (USD Million) Forecast by Country, 2021 to 2036
- Table 26: Oceania Market Value (USD Million) Forecast by Form, 2021 to 2036
- Table 27: Oceania Market Value (USD Million) Forecast by Application, 2021 to 2036
- Table 28: Oceania Market Value (USD Million) Forecast by Sales Channel, 2021 to 2036
- Table 29: Middle East Market Value (USD Million) Forecast by Country, 2021 to 2036
- Table 30: Middle East Market Value (USD Million) Forecast by Form, 2021 to 2036
- Table 31: Middle East Market Value (USD Million) Forecast by Application, 2021 to 2036
- Table 32: Middle East Market Value (USD Million) Forecast by Sales Channel, 2021 to 2036
- Table 33: Africa Market Value (USD Million) Forecast by Country, 2021 to 2036
- Table 34: Africa Market Value (USD Million) Forecast by Form, 2021 to 2036
- Table 35: Africa Market Value (USD Million) Forecast by Application, 2021 to 2036
- Table 36: Africa Market Value (USD Million) Forecast by Sales Channel, 2021 to 2036
List of Figures
- Figure 1: Global Market Pricing Analysis
- Figure 2: Global Market Value (USD Million) Forecast 2021-2036
- Figure 3: Global Market Value Share and BPS Analysis by Form, 2026 and 2036
- Figure 4: Global Market Y-o-Y Growth Comparison by Form, 2026-2036
- Figure 5: Global Market Attractiveness Analysis by Form
- Figure 6: Global Market Value Share and BPS Analysis by Application, 2026 and 2036
- Figure 7: Global Market Y-o-Y Growth Comparison by Application, 2026-2036
- Figure 8: Global Market Attractiveness Analysis by Application
- Figure 9: Global Market Value Share and BPS Analysis by Sales Channel, 2026 and 2036
- Figure 10: Global Market Y-o-Y Growth Comparison by Sales Channel, 2026-2036
- Figure 11: Global Market Attractiveness Analysis by Sales Channel
- Figure 12: Global Market Value (USD Million) Share and BPS Analysis by Region, 2026 and 2036
- Figure 13: Global Market Y-o-Y Growth Comparison by Region, 2026-2036
- Figure 14: Global Market Attractiveness Analysis by Region
- Figure 15: North America Market Incremental Dollar Opportunity, 2026-2036
- Figure 16: Latin America Market Incremental Dollar Opportunity, 2026-2036
- Figure 17: Europe Market Incremental Dollar Opportunity, 2026-2036
- Figure 18: East Asia Market Incremental Dollar Opportunity, 2026-2036
- Figure 19: South Asia Market Incremental Dollar Opportunity, 2026-2036
- Figure 20: Oceania Market Incremental Dollar Opportunity, 2026-2036
- Figure 21: Middle East Market Incremental Dollar Opportunity, 2026-2036
- Figure 22: Africa Market Incremental Dollar Opportunity, 2026-2036
- Figure 23: North America Market Value Share and BPS Analysis by Country, 2026 and 2036
- Figure 24: North America Market Value Share and BPS Analysis by Form, 2026 and 2036
- Figure 25: North America Market Y-o-Y Growth Comparison by Form, 2026-2036
- Figure 26: North America Market Attractiveness Analysis by Form
- Figure 27: North America Market Value Share and BPS Analysis by Application, 2026 and 2036
- Figure 28: North America Market Y-o-Y Growth Comparison by Application, 2026-2036
- Figure 29: North America Market Attractiveness Analysis by Application
- Figure 30: North America Market Value Share and BPS Analysis by Sales Channel, 2026 and 2036
- Figure 31: North America Market Y-o-Y Growth Comparison by Sales Channel, 2026-2036
- Figure 32: North America Market Attractiveness Analysis by Sales Channel
- Figure 33: Latin America Market Value Share and BPS Analysis by Country, 2026 and 2036
- Figure 34: Latin America Market Value Share and BPS Analysis by Form, 2026 and 2036
- Figure 35: Latin America Market Y-o-Y Growth Comparison by Form, 2026-2036
- Figure 36: Latin America Market Attractiveness Analysis by Form
- Figure 37: Latin America Market Value Share and BPS Analysis by Application, 2026 and 2036
- Figure 38: Latin America Market Y-o-Y Growth Comparison by Application, 2026-2036
- Figure 39: Latin America Market Attractiveness Analysis by Application
- Figure 40: Latin America Market Value Share and BPS Analysis by Sales Channel, 2026 and 2036
- Figure 41: Latin America Market Y-o-Y Growth Comparison by Sales Channel, 2026-2036
- Figure 42: Latin America Market Attractiveness Analysis by Sales Channel
- Figure 43: Europe Market Value Share and BPS Analysis by Country, 2026 and 2036
- Figure 44: Europe Market Value Share and BPS Analysis by Form, 2026 and 2036
- Figure 45: Europe Market Y-o-Y Growth Comparison by Form, 2026-2036
- Figure 46: Europe Market Attractiveness Analysis by Form
- Figure 47: Europe Market Value Share and BPS Analysis by Application, 2026 and 2036
- Figure 48: Europe Market Y-o-Y Growth Comparison by Application, 2026-2036
- Figure 49: Europe Market Attractiveness Analysis by Application
- Figure 50: Europe Market Value Share and BPS Analysis by Sales Channel, 2026 and 2036
- Figure 51: Europe Market Y-o-Y Growth Comparison by Sales Channel, 2026-2036
- Figure 52: Europe Market Attractiveness Analysis by Sales Channel
- Figure 53: East Asia Market Value Share and BPS Analysis by Country, 2026 and 2036
- Figure 54: East Asia Market Value Share and BPS Analysis by Form, 2026 and 2036
- Figure 55: East Asia Market Y-o-Y Growth Comparison by Form, 2026-2036
- Figure 56: East Asia Market Attractiveness Analysis by Form
- Figure 57: East Asia Market Value Share and BPS Analysis by Application, 2026 and 2036
- Figure 58: East Asia Market Y-o-Y Growth Comparison by Application, 2026-2036
- Figure 59: East Asia Market Attractiveness Analysis by Application
- Figure 60: East Asia Market Value Share and BPS Analysis by Sales Channel, 2026 and 2036
- Figure 61: East Asia Market Y-o-Y Growth Comparison by Sales Channel, 2026-2036
- Figure 62: East Asia Market Attractiveness Analysis by Sales Channel
- Figure 63: South Asia Market Value Share and BPS Analysis by Country, 2026 and 2036
- Figure 64: South Asia Market Value Share and BPS Analysis by Form, 2026 and 2036
- Figure 65: South Asia Market Y-o-Y Growth Comparison by Form, 2026-2036
- Figure 66: South Asia Market Attractiveness Analysis by Form
- Figure 67: South Asia Market Value Share and BPS Analysis by Application, 2026 and 2036
- Figure 68: South Asia Market Y-o-Y Growth Comparison by Application, 2026-2036
- Figure 69: South Asia Market Attractiveness Analysis by Application
- Figure 70: South Asia Market Value Share and BPS Analysis by Sales Channel, 2026 and 2036
- Figure 71: South Asia Market Y-o-Y Growth Comparison by Sales Channel, 2026-2036
- Figure 72: South Asia Market Attractiveness Analysis by Sales Channel
- Figure 73: Oceania Market Value Share and BPS Analysis by Country, 2026 and 2036
- Figure 74: Oceania Market Value Share and BPS Analysis by Form, 2026 and 2036
- Figure 75: Oceania Market Y-o-Y Growth Comparison by Form, 2026-2036
- Figure 76: Oceania Market Attractiveness Analysis by Form
- Figure 77: Oceania Market Value Share and BPS Analysis by Application, 2026 and 2036
- Figure 78: Oceania Market Y-o-Y Growth Comparison by Application, 2026-2036
- Figure 79: Oceania Market Attractiveness Analysis by Application
- Figure 80: Oceania Market Value Share and BPS Analysis by Sales Channel, 2026 and 2036
- Figure 81: Oceania Market Y-o-Y Growth Comparison by Sales Channel, 2026-2036
- Figure 82: Oceania Market Attractiveness Analysis by Sales Channel
- Figure 83: Middle East Market Value Share and BPS Analysis by Country, 2026 and 2036
- Figure 84: Middle East Market Value Share and BPS Analysis by Form, 2026 and 2036
- Figure 85: Middle East Market Y-o-Y Growth Comparison by Form, 2026-2036
- Figure 86: Middle East Market Attractiveness Analysis by Form
- Figure 87: Middle East Market Value Share and BPS Analysis by Application, 2026 and 2036
- Figure 88: Middle East Market Y-o-Y Growth Comparison by Application, 2026-2036
- Figure 89: Middle East Market Attractiveness Analysis by Application
- Figure 90: Middle East Market Value Share and BPS Analysis by Sales Channel, 2026 and 2036
- Figure 91: Middle East Market Y-o-Y Growth Comparison by Sales Channel, 2026-2036
- Figure 92: Middle East Market Attractiveness Analysis by Sales Channel
- Figure 93: Africa Market Value Share and BPS Analysis by Country, 2026 and 2036
- Figure 94: Africa Market Value Share and BPS Analysis by Form, 2026 and 2036
- Figure 95: Africa Market Y-o-Y Growth Comparison by Form, 2026-2036
- Figure 96: Africa Market Attractiveness Analysis by Form
- Figure 97: Africa Market Value Share and BPS Analysis by Application, 2026 and 2036
- Figure 98: Africa Market Y-o-Y Growth Comparison by Application, 2026-2036
- Figure 99: Africa Market Attractiveness Analysis by Application
- Figure 100: Africa Market Value Share and BPS Analysis by Sales Channel, 2026 and 2036
- Figure 101: Africa Market Y-o-Y Growth Comparison by Sales Channel, 2026-2036
- Figure 102: Africa Market Attractiveness Analysis by Sales Channel
- Figure 103: Global Market - Tier Structure Analysis
- Figure 104: Global Market - Company Share Analysis
Frequently Asked Questions
How big is the sea buckthorn market in 2026?
FMI estimates the market at USD 468.0 million in 2026, up from USD 425.0 million in 2025. It is forecast to reach USD 1,214.0 million by 2036 at a 10.0% CAGR.
Which form leads the market?
Juice leads by form with 45.0% in 2026. Oil, powder and other forms together hold 55.0%.
Which application leads?
Dietary supplements lead by application with 26.0% in 2026.
Which country is forecast to grow fastest through 2036?
India has the highest forecast CAGR among the profiled countries at 11.2% during 2026 to 2036, followed by Germany at 10.4%.
Is sea buckthorn used as a medicine?
China has listed sea buckthorn in its national Pharmacopoeia since 1977 [5]. Commercial products are usually fruit powders, oil capsules, vitamin C tablets and cosmetics [2].
Where is sea buckthorn grown?
China held 2.07 million of the world's 2.33 million hectares in December 2020 [2]. Commercial orchards also operate in Mongolia, India, Romania and Germany [2]. The species has been introduced to Canada and the United States [2].
Preview the report firsthand - request a free sample
Get SampleGet the brochure for pricing and purchase details.
Get PDF
