Reports

- Global Locations -

Headquarters

Future Market Insights, Inc.

Christiana Corporate, 200
Continental Drive, Suite 401,
Newark, Delaware - 19713,
United States

T: +1-845-579-5705

Americas

Future Market Insights, Inc.

616 Corporate Way, Suite 2-9018,
Valley Cottage, NY 10989, United States

T: +1-347-918-3531

MEA

Future Market Insights

1602-6 Jumeirah Bay X2 Tower, Plot No: JLT-PH2-X2A,
Jumeirah Lakes Towers, Dubai,
United Arab Emirates

Europe

Future Market Insights

3rd Floor, 207 Regent Street,
W1B 3HH London
United Kingdom

T: + 44 (0) 20 8123 9659
D: +44 (0) 20 3287 4268

Asia Pacific

Future Market Insights

IndiaLand Global Tech Park, Unit UG-1, Behind Grand HighStreet, Phase 1, Hinjawadi, MH, Pune – 411057, India

Analytical Study of Singapore Tourism Industry from 2024 to 2034

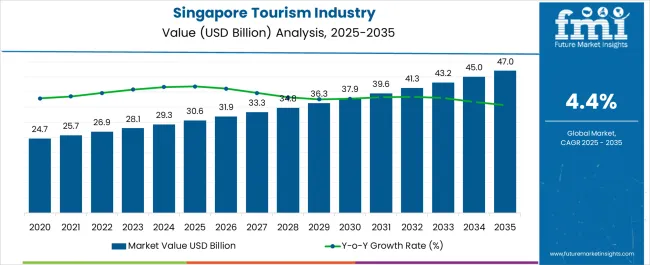
After the detailed analysis on global tourism market, FMI has recently published a new report on Singapore tourism industry. The outlook suggests tourism industry in Singapore to hit a mark of US$ 29,288 million in 2024.

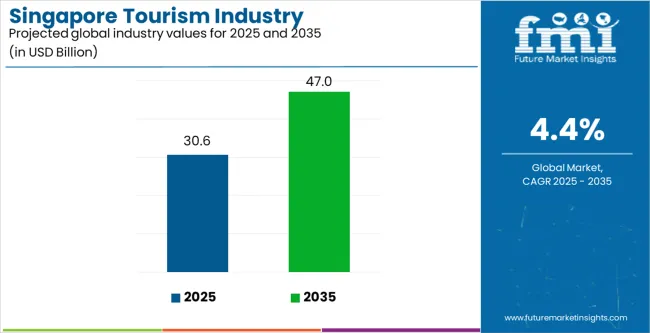
The hotels and accommodation providers in Singapore have reacted by offering personalized packs, loyalty rewards programs, and integration with online bookings in their effort to get the tourists. While the momentum is sustained at a CAGR of 4.40% by 2034, the overall industry worth could eventually reach US$ 45,050 million.

Attributes Details
Singapore Tourism Industry Size in 2024 US$ 29,288 million
Expected Singapore Tourism Industry Size by 2034 US$ 45,050 million
Forecasted CAGR between 2024 to 2034 4.40%

Don't pay for what you don't need

Customize your report by selecting specific countries or regions and save 30%!

Investment Opportunities in the Singapore Tourism Industry

  • Investment in hotels or platforms offering curated staycation experiences.
  • Funding eco-friendly ventures like green hotels or responsible tourism tours.
  • Back travel startups developing innovative booking systems or personalized travel apps.
  • Invest in businesses catering to medical tourism, luxury travel, or specific interest tours.

Historical vs Future Outlook for Singapore’s Tourism Industry

The period from 2019 to 2023 was characterized by somewhat moderate growth of Singapore’s tourism industry. The market value amounted to US$ 28,188.60 million, and the CAGR was 3.8%.

This moderate pace can be attributed to a decrease in global tourism industry, other destinations becoming more popular, and the organization’s inability to attract tourists for the second time successfully.

Category Historical Period from 2019 to 2023
Market Valuation at the End of the Period US$ 28,188.60 million
CAGR 3.80%
Key Trends Sustainable tourism focus
Growth factors Digital tech adoption

The future predictions for 2034 seem more positive, as the CAGR is pegged to be at 4.4%. This period is likely to secure significant demand with developing niche markets. Also, advances in digital tools for optimizing the experience of tourists, increased attention to Eco practices could lead the market valuation to US$ 45,050 million by 2034.

Category Forecast Period from 2024 to 2034
Market Valuation at the End of the Period US$ 45,050 million
CAGR 4.40%
Key Trends AI-driven personalized experiences
Growth factors Wellness tourism demand
Ronak Shah
Ronak Shah

Principal Consultant

Talk to Analyst

Find your sweet spots for generating winning opportunities in this market.

Key Highlights

Role of the Singapore Tourism Board (STB)

Singapore Tourism Board (STB) works actively to promote the country via targeted campaigns and develop new tourism products and experiences. They specialize in unique industries such as deluxe tourism, medical tourism, and sustainable tourism to meet the needs of visitors of different types.

Travel agencies and tour operators are developing personal itineraries, adopting online booking and virtual tours through technology, and focusing on niche sectors such as culture and ecotourism.

The Singapore tourism industry is taking on this digital wave with open arms!

Online tourism booking sites, mobile applications, and contactless payment systems are making travel arrangements, booking, and in-destination experiences more convenient and effective. Technology is also being used by retail and F&B outlets through digital menus and online ordering, which are aimed at the same.

Theme parks, museums, and cultural attractions are never stagnant. They are always introducing something new. The goal is to create immersive and interactive experiences that are a perfect match for the digital generation.

Trends Influencing Singapore Tourism Industry Growth

Medical Tourism Central

First class health care facilities and highly specialized medical procedures make Singapore a leading destination for medical tourism. There are sophisticated hospitals, top ranked medical professionals and the name is familiar around the world in regard to healthcare services, which means that Singapore has become irresistible to those people who come from different parts of the world seeking the best treatment and operations.

MICE Tourism Boom

Singapore continues to be one of the leading MICE (Meetings, Incentives, Conferences and Exhibitions) destinations in Asia attracting business travelers and event organizers from all over the world.

The city-state boasts of first-rate conference centers with modern amenities as well as an investor-friendly environment making it a perfect venue for global conferences, corporate meetings, and exhibitions.

Culinary Tourism Transition

It is no longer about famous street food or hawker fare but rather food tourism based on new ways differing from old ones. The rise of food-related events, food festivals and culinary experiences that emphasize multicultural gastronomy as well as contemporary dining scene have been observed in Singapore presently.

Singapore’s gastronomic journey ranges from Michelin-starred restaurants to local neighborhood hidden gems that offer an experience of the taste buds of those tourists who want a gastronomic tour.

Get the data you need at a Fraction of the cost

Personalize your report by choosing insights you need
and save 40%!

Comparative View of the Adjacent Singapore Tourism Industry

The objective of this section is to present a comparison between the tourism industry of Singapore, the USA and Canada tourism industry and the Asia Pacific tourism industry. It indicates the forecasted CAGR of each sector from 2024 to 2034 and contains the main trends and opportunities for each sector.

Singapore Tourism industry:

Attributes Singapore Tourism industry
Forecast CAGR between 2024 to 2034 4.40%
Key Trends Leveraging digital innovation and technology in order to deliver better visitor experiences and to improve tourism operations.
Key Opportunities Implementing sustainable approaches in the tourism industry that ensure the attraction of eco-aware travelers and the promotion of environmental consciousness.

USA and Canada Tourism Industry:

Attributes USA and Canada Tourism Industry
Forecast CAGR between 2024 to 2034 3.9%
Key Trends Growing demand for indigenous traveling as travelers prefer to stick to local destinations and tour regions, thus encouraging the growth of regional tourism.
Key Opportunities Exploiting the emerging trend of experiential travel by offering memorable and engaging experiences that will be tailored to the needs of different types of travelers.

Asia Pacific Tourism Industry:

Attributes Asia Pacific Tourism Industry
Forecast CAGR between 2024 to 2034 11.6%
Key Trends Booming wellness tourism is due to travelers who put health and well-being as a top priority, hence the increasing number of wellness resorts, spas, and holistic wellness experiences in the region of Asia Pacific.
Key Opportunities Taking advantage of the area's cultural diversity and abundant history to showcase cultural tourism adventures and to build cross-cultural communication.

Category wise insights

The section offers an analysis of the dominant segments influencing the outlook for demand for tourism in Singapore.

Domestic Tourist Anticipated to Be Key Business Makers in the Industry

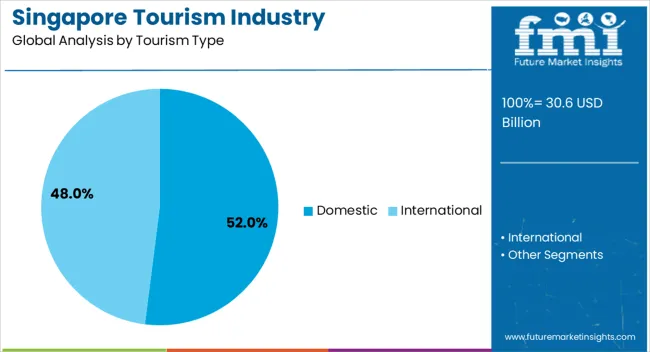
By Tourist Type Domestic
The share held by the Segment in 2024 52%

In 2024, the share of domestic tourism in the industry is expected to reach 52%. This surge can be attributed to several factors:

  • The Singapore residents are now choosing to go for staycations and local getaways more frequently which is mainly because of attractive offers and special deals.
  • While the growth of the country’s GDP leads to an upward trend in the population’s disposable income that assures more spending on recreational activities, including local trips.
  • Living in Singapore nowadays means exploring diverse activities, and the local tourism industry is adapting to this trend by providing various tours and activities within the city.
  • Domestic tourism campaigns like the Singapore Tourism Board's "Singapoliday" campaigns also support this segment thanks to government initiatives.

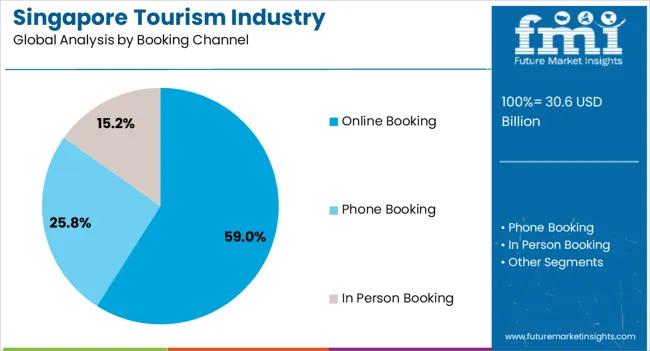
Online Booking Channel Records a Significant Push Forward with a Share of 59% in 2024

By Booking Channel Online Booking
Share held by the Segment in 2024 59%

Online booking platforms are anticipated to get a substantial chunk of the industry, up to 59% in 2024.

  • Digital platforms are created in such way to make it simple, quick, and available to the traveler to search, choose, and book his travel schedule including flights, hotels, and attractions.
  • Online booking portals often give customers a chance to grab great deals and discounts, thus making the trip more affordable.
  • The rise of mobile apps for travel booking is an indicator of the growing trend towards in trip booking and travel management.
  • These online portals promote a greater variety of travel choices and allow travelers to adapt their routes according to their specific needs.

Competitive Analysis of the Singapore Tourism Industry

The Tourism Industry of Singapore is powered by the coexistence of the established players and the new innovative entrants. Knowing their way of doing business is important to companies that want to become players in this thriving segment.

Recent Developments in the Singapore Tourism Sector

  • Chan Brothers Group has been successful in expanding its franchise outlets and opening new stores in Kuala Lumpur and Chengdu, as these cities are growing tourist centers.
  • The tourism sector of Singapore has shown a steady recovery in 2023, as the STB reported that international visitor arrivals hit 13.6 million, and tourism receipts are expected to hit US$ 24.5 million to US$ 26 million. Billion.
  • Marina Bay Sands received $750 million for the following phase of its makeover, that will concentrate on Tower 3, the hotel lobby, and Sands SkyPark.
  • Klook has widened its joint initiative with the STB, putting in a combined sum of about S$2 million to attract inbound tourism to Singapore.

Established Players

  • Singapore Tourism Board (STB)

This government organization is the driving force behind the transformation of Singapore into a world-class tourism destination. They use tailored marketing campaigns and create new tourism products, such as those that are luxury, medical, or sustainable, as well as work with industry partners. STB adopts data-driven marketing, demonstrates virtual reality experiences to attract tourism, and joins hands with influencers to engage new audiences.

  • Marina Bay Sands

A famous integrated resort that provides the finest in leisure accommodation, entertainment, conventions, and shopping. Marina Bay Sands extends its services by adding new attractions such as the ArtScience Museum extension and celebrity chef restaurants. Moreover, they use digital tools to develop guest experiences based on individuals.

  • Changi Airport Group

Managing Changi Airport, Singapore, which is consistently rated as one of the best in the world. Changi Airport is a combination of retail, entertainment, and leisure facilities, which include a butterfly garden, a movie theater, and a rooftop pool, among others. They also embed contactless technology for passengers to save time.

Emerging Players in the Industry

  • Trip.com

A leading and well-established online travel agency with a strong presence in Asia. Trip.com applies AI and big data to the personalization of travel recommendations and competitive pricing. They also pay much attention to mobile-oriented experiences and seek out their clients of a particular group of travelers, such as millennials.

  • Klook

A well-known travel online channel that provides tickets for tours, activities, and attractions. Klook has hand-picked the most unique and localized experiences, provides real-time booking options, and socializes marketing through social networks with the younger generation.

  • Byond Travel

The startup from Singapore gives people the opportunity to have tailored and eco-friendly traveling adventures. Beyond Travel brings together travelers and local specialists to create bespoke itineraries tailored to distinct interests and a travel approach centered on responsible tourism.

Key Strategies to Scale for Businesses Looking to Enter Singapore’s Tourism Industry

Embrace Targeted Niche Tourism! The throwing of pebbles won't yield any results. Singapore has a wide appeal to people with different tastes. Extensive research may lead to the identification of a particular niche for which a business can be a shining example - medical tourism, luxury trips, sustainable traveling, or specializing in families with young kids.

Understanding the ideal customer and fitting the offering to their individual needs is one of the most important factors. There is no doubt that partnership with local businesses and experts will be an essential means to create memorable and authentic experiences that are always of real value.

Through the concentration on a narrow segment, the business stands a chance to become the leader at this level and to get a devoted customer base.

Collaboration is Key! The tourism industry's success in Singapore is dependent on networking. After the implementation of the "Singapoliday" marketing strategy developed by the STB, businesses can easily get more customers by simply taking advantage of the exposure which is provided by promotional opportunities.

Partnering with business entities such as hotels, tourist sites, and local businesses is a crucial point to consider. Work together to create combined itineraries and at the same time advertise products that will ensure that travelers are not only provided with a variety of experiences but also a sense of uniqueness.

Local experts and guides collaboration will ensure that presentations are authentic, appropriate, and enriching in enabling the tourists to gain insight of the Singaporean culture.

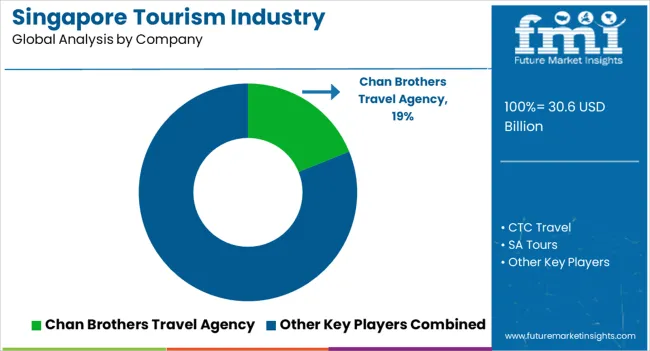
Key Players Offering Tourism Services in Singapore include

  • Chan Brothers Travel Agency
  • CTC Travel
  • SA Tours
  • Dynasty Travel
  • Marina Bay Sands
  • Trip.com
  • Klook
  • Indogusto
  • Singapore Airlines Holidays
  • Travel Clique
  • Eu Asia Holidays

Key Coverage in Singapore Tourism Industry Report

  • Singapore Tourism Statistics
  • Industry Analysis of Singapore Travel and Tourism
  • Singapore Tourism Outlook 2024
  • Hospitality Industry in Singapore
  • Singapore Tourism Statistics by Country

Key Segments

By Tourism Type:

  • Domestic
  • International

By Booking Channel:

  • Phone Booking
  • Online Booking
  • In Person Booking

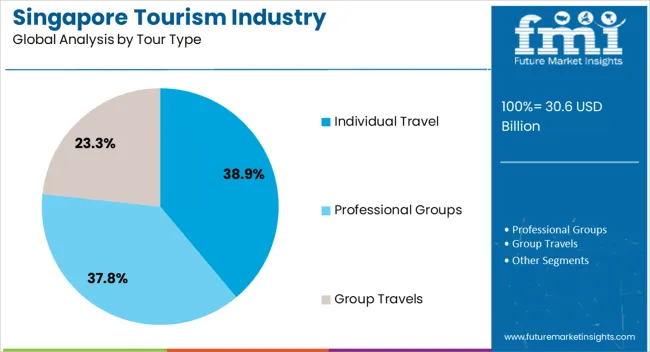
By Tour Type:

  • Individual travel
  • Professional Groups
  • Group travels

Frequently Asked Questions

What is the Industry Size for Tourism in Singapore?

The tourism industry in Singapore is poised to reach US$ 29,288 million by 2024.

What is the Future Outlook of Tourism Adoption in Singapore?

The industry is anticipated to surpass a valuation of US$ 45,050 million by 2034.

What is the Anticipated Growth Rate of Tourism in Singapore?

The demand for tourism in Singapore is expected to increase at the rate of 4.40% CAGR from 2024 to 2034.

Which Tourist Type is the Major Player in the Singapore Tourism Industry?

The domestic segment has had a monopoly over this sector since the year 2024.

How Booking Channel Gets the Biggest Share of the Market in 2024?

The online booking segment is expected to lead the industry in 2024.

Table of Content

1. Executive Summary

    1.1. Singapore Market Outlook

    1.2. Demand-side Trends

    1.3. Supply-side Trends

    1.4. Technology Roadmap Analysis

    1.5. Analysis and Recommendations

2. Market Overview

    2.1. Market Coverage / Taxonomy

    2.2. Market Definition / Scope / Limitations

3. Market Background

    3.1. Market Dynamics

        3.1.1. Drivers

        3.1.2. Restraints

        3.1.3. Opportunity

        3.1.4. Trends

    3.2. Scenario Forecast

        3.2.1. Demand in Optimistic Scenario

        3.2.2. Demand in Likely Scenario

        3.2.3. Demand in Conservative Scenario

    3.3. Opportunity Map Analysis

    3.4. Investment Feasibility Matrix

    3.5. PESTLE and Porter’s Analysis

    3.6. Regulatory Landscape

        3.6.1. By Key Regions

        3.6.2. By Key Countries

    3.7. Regional Parent Market Outlook

4. Market Analysis 2019 to 2023 and Forecast, 2024 to 2034

    4.1. Historical Market Size Value (US$ Million) Analysis, 2019 to 2023

    4.2. Current and Future Market Size Value (US$ Million) Projections, 2024 to 2034

        4.2.1. Y-o-Y Growth Trend Analysis

        4.2.2. Absolute $ Opportunity Analysis

5. Market Analysis 2019 to 2023 and Forecast 2024 to 2034, By Type

    5.1. Introduction / Key Findings

    5.2. Historical Market Size Value (US$ Million) Analysis By Type, 2019 to 2023

    5.3. Current and Future Market Size Value (US$ Million) Analysis and Forecast By Type, 2024 to 2034

        5.3.1. Budget

        5.3.2. Standard

        5.3.3. Premium

    5.4. Y-o-Y Growth Trend Analysis By Type, 2019 to 2023

    5.5. Absolute $ Opportunity Analysis By Type, 2024 to 2034

6. Market Analysis 2019 to 2023 and Forecast 2024 to 2034, By Service Type

    6.1. Introduction / Key Findings

    6.2. Historical Market Size Value (US$ Million) Analysis By Service Type, 2019 to 2023

    6.3. Current and Future Market Size Value (US$ Million) Analysis and Forecast By Service Type, 2024 to 2034

        6.3.1. Accommodation

        6.3.2. Food & Beverages

        6.3.3. Others

    6.4. Y-o-Y Growth Trend Analysis By Service Type, 2019 to 2023

    6.5. Absolute $ Opportunity Analysis By Service Type, 2024 to 2034

7. Market Analysis 2019 to 2023 and Forecast 2024 to 2034, By Occupants

    7.1. Introduction / Key Findings

    7.2. Historical Market Size Value (US$ Million) Analysis By Occupants, 2019 to 2023

    7.3. Current and Future Market Size Value (US$ Million) Analysis and Forecast By Occupants, 2024 to 2034

        7.3.1. Solo

        7.3.2. Group

    7.4. Y-o-Y Growth Trend Analysis By Occupants, 2019 to 2023

    7.5. Absolute $ Opportunity Analysis By Occupants, 2024 to 2034

8. Market Analysis 2019 to 2023 and Forecast 2024 to 2034, By Region

    8.1. Introduction

    8.2. Historical Market Size Value (US$ Million) Analysis By Region, 2019 to 2023

    8.3. Current Market Size Value (US$ Million) Analysis and Forecast By Region, 2024 to 2034

        8.3.1. Central Singapore

        8.3.2. East Singapore

        8.3.3. North Singapore

        8.3.4. North-East Singapore

        8.3.5. West Singapore

    8.4. Market Attractiveness Analysis By Region

9. Central Market Analysis 2019 to 2023 and Forecast 2024 to 2034

    9.1. Historical Market Size Value (US$ Million) Trend Analysis By Market Taxonomy, 2019 to 2023

    9.2. Market Size Value (US$ Million) Forecast By Market Taxonomy, 2024 to 2034

        9.2.1. By Type

        9.2.2. By Service Type

        9.2.3. By Occupants

    9.3. Market Attractiveness Analysis

        9.3.1. By Type

        9.3.2. By Service Type

        9.3.3. By Occupants

    9.4. Key Takeaways

10. East Market Analysis 2019 to 2023 and Forecast 2024 to 2034

    10.1. Historical Market Size Value (US$ Million) Trend Analysis By Market Taxonomy, 2019 to 2023

    10.2. Market Size Value (US$ Million) Forecast By Market Taxonomy, 2024 to 2034

        10.2.1. By Type

        10.2.2. By Service Type

        10.2.3. By Occupants

    10.3. Market Attractiveness Analysis

        10.3.1. By Type

        10.3.2. By Service Type

        10.3.3. By Occupants

    10.4. Key Takeaways

11. North Market Analysis 2019 to 2023 and Forecast 2024 to 2034

    11.1. Historical Market Size Value (US$ Million) Trend Analysis By Market Taxonomy, 2019 to 2023

    11.2. Market Size Value (US$ Million) Forecast By Market Taxonomy, 2024 to 2034

        11.2.1. By Type

        11.2.2. By Service Type

        11.2.3. By Occupants

    11.3. Market Attractiveness Analysis

        11.3.1. By Type

        11.3.2. By Service Type

        11.3.3. By Occupants

    11.4. Key Takeaways

12. North-East Market Analysis 2019 to 2023 and Forecast 2024 to 2034

    12.1. Historical Market Size Value (US$ Million) Trend Analysis By Market Taxonomy, 2019 to 2023

    12.2. Market Size Value (US$ Million) Forecast By Market Taxonomy, 2024 to 2034

        12.2.1. By Type

        12.2.2. By Service Type

        12.2.3. By Occupants

    12.3. Market Attractiveness Analysis

        12.3.1. By Type

        12.3.2. By Service Type

        12.3.3. By Occupants

    12.4. Key Takeaways

13. West Market Analysis 2019 to 2023 and Forecast 2024 to 2034

    13.1. Historical Market Size Value (US$ Million) Trend Analysis By Market Taxonomy, 2019 to 2023

    13.2. Market Size Value (US$ Million) Forecast By Market Taxonomy, 2024 to 2034

        13.2.1. By Type

        13.2.2. By Service Type

        13.2.3. By Occupants

    13.3. Market Attractiveness Analysis

        13.3.1. By Type

        13.3.2. By Service Type

        13.3.3. By Occupants

    13.4. Key Takeaways

14. Market Structure Analysis

    14.1. Competition Dashboard

    14.2. Competition Benchmarking

    14.3. Market Share Analysis of Top Players

        14.3.1. By Regional

        14.3.2. By Type

        14.3.3. By Service Type

        14.3.4. By Occupants

15. Competition Analysis

    15.1. Competition Deep Dive

        15.1.1. Chan Brothers Travel Agency

            15.1.1.1. Overview

            15.1.1.2. Product Portfolio

            15.1.1.3. Profitability by Market Segments

            15.1.1.4. Sales Footprint

            15.1.1.5. Strategy Overview

                15.1.1.5.1. Marketing Strategy

        15.1.2. CTC Travel

            15.1.2.1. Overview

            15.1.2.2. Product Portfolio

            15.1.2.3. Profitability by Market Segments

            15.1.2.4. Sales Footprint

            15.1.2.5. Strategy Overview

                15.1.2.5.1. Marketing Strategy

        15.1.3. SA Tours

            15.1.3.1. Overview

            15.1.3.2. Product Portfolio

            15.1.3.3. Profitability by Market Segments

            15.1.3.4. Sales Footprint

            15.1.3.5. Strategy Overview

                15.1.3.5.1. Marketing Strategy

        15.1.4. Dynasty Travel

            15.1.4.1. Overview

            15.1.4.2. Product Portfolio

            15.1.4.3. Profitability by Market Segments

            15.1.4.4. Sales Footprint

            15.1.4.5. Strategy Overview

                15.1.4.5.1. Marketing Strategy

        15.1.5. Accor S.A

            15.1.5.1. Overview

            15.1.5.2. Product Portfolio

            15.1.5.3. Profitability by Market Segments

            15.1.5.4. Sales Footprint

            15.1.5.5. Strategy Overview

                15.1.5.5.1. Marketing Strategy

        15.1.6. Four Seasons Hotels Ltd

            15.1.6.1. Overview

            15.1.6.2. Product Portfolio

            15.1.6.3. Profitability by Market Segments

            15.1.6.4. Sales Footprint

            15.1.6.5. Strategy Overview

                15.1.6.5.1. Marketing Strategy

        15.1.7. Hilton Worldwide Holdings

            15.1.7.1. Overview

            15.1.7.2. Product Portfolio

            15.1.7.3. Profitability by Market Segments

            15.1.7.4. Sales Footprint

            15.1.7.5. Strategy Overview

                15.1.7.5.1. Marketing Strategy

        15.1.8. Hyatt Hotels Corporation

            15.1.8.1. Overview

            15.1.8.2. Product Portfolio

            15.1.8.3. Profitability by Market Segments

            15.1.8.4. Sales Footprint

            15.1.8.5. Strategy Overview

                15.1.8.5.1. Marketing Strategy

        15.1.9. ITC Ltd

            15.1.9.1. Overview

            15.1.9.2. Product Portfolio

            15.1.9.3. Profitability by Market Segments

            15.1.9.4. Sales Footprint

            15.1.9.5. Strategy Overview

                15.1.9.5.1. Marketing Strategy

        15.1.10. Marriott International

            15.1.10.1. Overview

            15.1.10.2. Product Portfolio

            15.1.10.3. Profitability by Market Segments

            15.1.10.4. Sales Footprint

            15.1.10.5. Strategy Overview

                15.1.10.5.1. Marketing Strategy

16. Assumptions & Acronyms Used

17. Research Methodology

Don't pay for what you don't need

Customize your report by selecting specific countries or regions and save 30%!

List of Tables

Table 1: Market Value (US$ Million) Forecast by Region, 2019 to 2034

Table 2: Market Value (US$ Million) Forecast by Type, 2019 to 2034

Table 3: Market Value (US$ Million) Forecast by Service Type, 2019 to 2034

Table 4: Market Value (US$ Million) Forecast by Occupants, 2019 to 2034

Table 5: Central Market Value (US$ Million) Forecast by Type, 2019 to 2034

Table 6: Central Market Value (US$ Million) Forecast by Service Type, 2019 to 2034

Table 7: Central Market Value (US$ Million) Forecast by Occupants, 2019 to 2034

Table 8: East Market Value (US$ Million) Forecast by Type, 2019 to 2034

Table 9: East Market Value (US$ Million) Forecast by Service Type, 2019 to 2034

Table 10: East Market Value (US$ Million) Forecast by Occupants, 2019 to 2034

Table 11: North Market Value (US$ Million) Forecast by Type, 2019 to 2034

Table 12: North Market Value (US$ Million) Forecast by Service Type, 2019 to 2034

Table 13: North Market Value (US$ Million) Forecast by Occupants, 2019 to 2034

Table 14: North-East Market Value (US$ Million) Forecast by Type, 2019 to 2034

Table 15: North-East Market Value (US$ Million) Forecast by Service Type, 2019 to 2034

Table 16: North-East Market Value (US$ Million) Forecast by Occupants, 2019 to 2034

Table 17: West Market Value (US$ Million) Forecast by Type, 2019 to 2034

Table 18: West Market Value (US$ Million) Forecast by Service Type, 2019 to 2034

Table 19: West Market Value (US$ Million) Forecast by Occupants, 2019 to 2034
Ronak Shah
Ronak Shah

Principal Consultant

Talk to Analyst

Find your sweet spots for generating winning opportunities in this market.

List of Charts

Figure 1: Market Value (US$ Million) by Type, 2024 to 2034

Figure 2: Market Value (US$ Million) by Service Type, 2024 to 2034

Figure 3: Market Value (US$ Million) by Occupants, 2024 to 2034

Figure 4: Market Value (US$ Million) by Region, 2024 to 2034

Figure 5: Market Value (US$ Million) Analysis by Region, 2019 to 2034

Figure 6: Market Value Share (%) and BPS Analysis by Region, 2024 to 2034

Figure 7: Market Y-o-Y Growth (%) Projections by Region, 2024 to 2034

Figure 8: Market Value (US$ Million) Analysis by Type, 2019 to 2034

Figure 9: Market Value Share (%) and BPS Analysis by Type, 2024 to 2034

Figure 10: Market Y-o-Y Growth (%) Projections by Type, 2024 to 2034

Figure 11: Market Value (US$ Million) Analysis by Service Type, 2019 to 2034

Figure 12: Market Value Share (%) and BPS Analysis by Service Type, 2024 to 2034

Figure 13: Market Y-o-Y Growth (%) Projections by Service Type, 2024 to 2034

Figure 14: Market Value (US$ Million) Analysis by Occupants, 2019 to 2034

Figure 15: Market Value Share (%) and BPS Analysis by Occupants, 2024 to 2034

Figure 16: Market Y-o-Y Growth (%) Projections by Occupants, 2024 to 2034

Figure 17: Market Attractiveness by Type, 2024 to 2034

Figure 18: Market Attractiveness by Service Type, 2024 to 2034

Figure 19: Market Attractiveness by Occupants, 2024 to 2034

Figure 20: Market Attractiveness by Region, 2024 to 2034

Figure 21: Central Market Value (US$ Million) by Type, 2024 to 2034

Figure 22: Central Market Value (US$ Million) by Service Type, 2024 to 2034

Figure 23: Central Market Value (US$ Million) by Occupants, 2024 to 2034

Figure 24: Central Market Value (US$ Million) Analysis by Type, 2019 to 2034

Figure 25: Central Market Value Share (%) and BPS Analysis by Type, 2024 to 2034

Figure 26: Central Market Y-o-Y Growth (%) Projections by Type, 2024 to 2034

Figure 27: Central Market Value (US$ Million) Analysis by Service Type, 2019 to 2034

Figure 28: Central Market Value Share (%) and BPS Analysis by Service Type, 2024 to 2034

Figure 29: Central Market Y-o-Y Growth (%) Projections by Service Type, 2024 to 2034

Figure 30: Central Market Value (US$ Million) Analysis by Occupants, 2019 to 2034

Figure 31: Central Market Value Share (%) and BPS Analysis by Occupants, 2024 to 2034

Figure 32: Central Market Y-o-Y Growth (%) Projections by Occupants, 2024 to 2034

Figure 33: Central Market Attractiveness by Type, 2024 to 2034

Figure 34: Central Market Attractiveness by Service Type, 2024 to 2034

Figure 35: Central Market Attractiveness by Occupants, 2024 to 2034

Figure 36: East Market Value (US$ Million) by Type, 2024 to 2034

Figure 37: East Market Value (US$ Million) by Service Type, 2024 to 2034

Figure 38: East Market Value (US$ Million) by Occupants, 2024 to 2034

Figure 39: East Market Value (US$ Million) Analysis by Type, 2019 to 2034

Figure 40: East Market Value Share (%) and BPS Analysis by Type, 2024 to 2034

Figure 41: East Market Y-o-Y Growth (%) Projections by Type, 2024 to 2034

Figure 42: East Market Value (US$ Million) Analysis by Service Type, 2019 to 2034

Figure 43: East Market Value Share (%) and BPS Analysis by Service Type, 2024 to 2034

Figure 44: East Market Y-o-Y Growth (%) Projections by Service Type, 2024 to 2034

Figure 45: East Market Value (US$ Million) Analysis by Occupants, 2019 to 2034

Figure 46: East Market Value Share (%) and BPS Analysis by Occupants, 2024 to 2034

Figure 47: East Market Y-o-Y Growth (%) Projections by Occupants, 2024 to 2034

Figure 48: East Market Attractiveness by Type, 2024 to 2034

Figure 49: East Market Attractiveness by Service Type, 2024 to 2034

Figure 50: East Market Attractiveness by Occupants, 2024 to 2034

Figure 51: North Market Value (US$ Million) by Type, 2024 to 2034

Figure 52: North Market Value (US$ Million) by Service Type, 2024 to 2034

Figure 53: North Market Value (US$ Million) by Occupants, 2024 to 2034

Figure 54: North Market Value (US$ Million) Analysis by Type, 2019 to 2034

Figure 55: North Market Value Share (%) and BPS Analysis by Type, 2024 to 2034

Figure 56: North Market Y-o-Y Growth (%) Projections by Type, 2024 to 2034

Figure 57: North Market Value (US$ Million) Analysis by Service Type, 2019 to 2034

Figure 58: North Market Value Share (%) and BPS Analysis by Service Type, 2024 to 2034

Figure 59: North Market Y-o-Y Growth (%) Projections by Service Type, 2024 to 2034

Figure 60: North Market Value (US$ Million) Analysis by Occupants, 2019 to 2034

Figure 61: North Market Value Share (%) and BPS Analysis by Occupants, 2024 to 2034

Figure 62: North Market Y-o-Y Growth (%) Projections by Occupants, 2024 to 2034

Figure 63: North Market Attractiveness by Type, 2024 to 2034

Figure 64: North Market Attractiveness by Service Type, 2024 to 2034

Figure 65: North Market Attractiveness by Occupants, 2024 to 2034

Figure 66: North-East Market Value (US$ Million) by Type, 2024 to 2034

Figure 67: North-East Market Value (US$ Million) by Service Type, 2024 to 2034

Figure 68: North-East Market Value (US$ Million) by Occupants, 2024 to 2034

Figure 69: North-East Market Value (US$ Million) Analysis by Type, 2019 to 2034

Figure 70: North-East Market Value Share (%) and BPS Analysis by Type, 2024 to 2034

Figure 71: North-East Market Y-o-Y Growth (%) Projections by Type, 2024 to 2034

Figure 72: North-East Market Value (US$ Million) Analysis by Service Type, 2019 to 2034

Figure 73: North-East Market Value Share (%) and BPS Analysis by Service Type, 2024 to 2034

Figure 74: North-East Market Y-o-Y Growth (%) Projections by Service Type, 2024 to 2034

Figure 75: North-East Market Value (US$ Million) Analysis by Occupants, 2019 to 2034

Figure 76: North-East Market Value Share (%) and BPS Analysis by Occupants, 2024 to 2034

Figure 77: North-East Market Y-o-Y Growth (%) Projections by Occupants, 2024 to 2034

Figure 78: North-East Market Attractiveness by Type, 2024 to 2034

Figure 79: North-East Market Attractiveness by Service Type, 2024 to 2034

Figure 80: North-East Market Attractiveness by Occupants, 2024 to 2034

Figure 81: West Market Value (US$ Million) by Type, 2024 to 2034

Figure 82: West Market Value (US$ Million) by Service Type, 2024 to 2034

Figure 83: West Market Value (US$ Million) by Occupants, 2024 to 2034

Figure 84: West Market Value (US$ Million) Analysis by Type, 2019 to 2034

Figure 85: West Market Value Share (%) and BPS Analysis by Type, 2024 to 2034

Figure 86: West Market Y-o-Y Growth (%) Projections by Type, 2024 to 2034

Figure 87: West Market Value (US$ Million) Analysis by Service Type, 2019 to 2034

Figure 88: West Market Value Share (%) and BPS Analysis by Service Type, 2024 to 2034

Figure 89: West Market Y-o-Y Growth (%) Projections by Service Type, 2024 to 2034

Figure 90: West Market Value (US$ Million) Analysis by Occupants, 2019 to 2034

Figure 91: West Market Value Share (%) and BPS Analysis by Occupants, 2024 to 2034

Figure 92: West Market Y-o-Y Growth (%) Projections by Occupants, 2024 to 2034

Figure 93: West Market Attractiveness by Type, 2024 to 2034

Figure 94: West Market Attractiveness by Service Type, 2024 to 2034

Figure 95: West Market Attractiveness by Occupants, 2024 to 2034

Recommendations

Travel and Tourism

India Outbound Tourism Market

Published : March 2024

Travel and Tourism

Tourism Market

Published : November 2022

Explore Travel and Tourism Insights

View Reports

Singapore Tourism Industry