Smart Conveyor Packaging Systems Market Size and Share Forecast Outlook 2025 to 2035

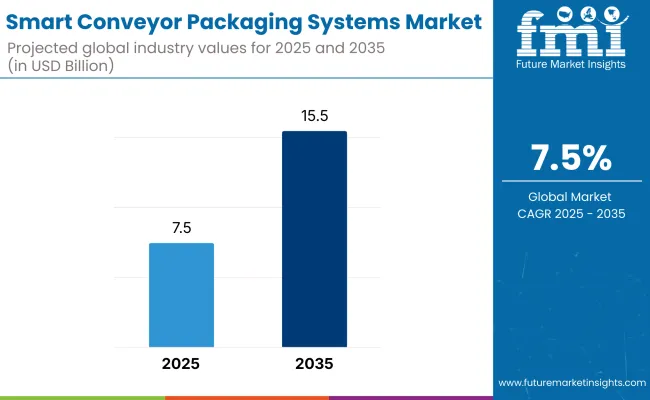
The smart conveyor packaging systems market is expected to grow from USD 7.5 billion in 2025 to USD 15.5 billion by 2035, resulting in a total increase of USD 8.0 billion over the forecast decade. This represents a 106.7% total expansion, with the market advancing at a compound annual growth rate (CAGR) of 7.5%. Over ten years, the market grows by a 2.1 multiple.
Quick Stats for Smart Conveyor Packaging Systems Market

  • Market Value (2025): USD 7.5 billion
  • Market Forecast Value (2035): USD 15.5 billion
  • Market Forecast CAGR: 7.5%
  • Leading Segment in 2025: Fully automated systems (46.2%)
  • Key Growth Regions: Asia-Pacific (India is the fastest-growing market with 10.8% CAGR)
  • Top Key Players: SmartMove, Dorner Mfg, Dematic, Biomass Engineering & Equipment (BE&E), Rockwell Automation, Bosch Rexroth Corporation, Bastian Solutions, LLC, SSI SCHAEFER, TGW Logistics, FlexLink.

Smart Conveyor Packaging System Market

Metric Value
Industry Size (2025E) USD 7.5 billion
Industry Value (2035F) USD 15.5 billion
CAGR (2025 to 2035) 7.5%

In the first five years (2025-2030), the market progresses from USD 7.5 billion to USD 10.7 billion, contributing USD 3.2 billion, or 40.0% of total decade growth. This phase is shaped by rising automation adoption in food, beverage, and e-commerce packaging lines. Demand is driven by the need for higher throughput, minimal downtime, and improved handling for diverse product types.

In the second half (2030-2035), the market grows from USD 10.7 billion to USD 15.5 billion, adding USD 4.8 billion, or 60.0% of the total growth. This acceleration is supported by AI-based predictive maintenance, IoT-enabled tracking, and modular conveyor designs. Sustainability goals, including energy-efficient motors and recyclable belt materials, further enhance adoption, positioning smart conveyor systems as central to next-generation packaging operations.

From 2020 to 2024, the smart conveyor packaging systems market grew from USD 6.1 billion to USD 7.2 billion, driven by automation in FMCG, food & beverage, and e-commerce fulfillment. Over 65% of revenue was held by OEMs integrating robotics, vision inspection, and variable-speed controls. Leaders such as Bosch Rexroth, Interroll, and Dorner focused on modularity, hygiene compliance, and energy efficiency.

Competitive differentiation hinged on sensor-enabled load balancing, predictive motor maintenance, and rapid changeover capabilities, while AI-powered optimization was often a secondary feature. Service-based monitoring contracts contributed under 18% of value as most clients invested in capital-intensive upgrades over OPEX-led models.

By 2035, the smart conveyor packaging systems market will reach USD 15.5 billion, growing at a CAGR of 7.50%, with over 40% of revenue from software analytics, predictive servicing, and adaptive automation platforms. Competition will intensify as solution providers offer integrated AI-driven quality control, cloud-based conveyor fleet management, and real-time production analytics.

Established players are shifting toward hybrid offerings combining hardware innovation with SaaS-based optimization tools. Emerging manufacturers such as FlexLink, Intralox, and SSI Schaefer are expanding share through zero-downtime modular designs, advanced safety compliance, and sustainable conveyor materials, targeting high-growth sectors in food safety and rapid e-commerce packaging.

Why the Smart Conveyor Packaging Systems Market is growing?

The rising demand for automated, high-speed, and precision-driven packaging operations is propelling growth in the smart conveyor packaging systems market. These systems optimize material flow, reduce labor dependency, and enhance product handling accuracy. Increasing adoption in food, beverage, pharmaceuticals, and e-commerce sectors is further driven by efficiency, safety, and traceability requirements.

Systems featuring IoT connectivity, AI-based quality control, and modular designs are gaining popularity for their ability to adapt to diverse packaging formats. Real-time monitoring, predictive maintenance, and energy-efficient motors improve operational uptime. Integration with smart sensors and data analytics enables enhanced throughput, aligning with sustainability goals and Industry 4.0 initiatives in modern manufacturing environments.

Segmental Analysis

The market is segmented by automation level, conveyor type, smart features, application, end-use industry, and region. Automation level segmentation includes semi-automated, fully automated, and AI-integrated systems, enhancing packaging efficiency and reducing manual intervention. Conveyor type covers belt, roller, chain, and magnetic conveyors, enabling tailored movement for diverse product sizes and weights. Smart features include IoT sensors, predictive maintenance, RFID integration, and vision systems, improving operational monitoring and predictive performance.

Applications span packaging line automation, warehousing, food handling, and pharmaceutical lines, ensuring streamlined processes across sectors. End-use industries include packaging, e-commerce, logistics, pharmaceuticals, and food & beverage. Regionally, the market is segmented into North America, Europe, Asia-Pacific, Latin America, and the Middle East & Africa.
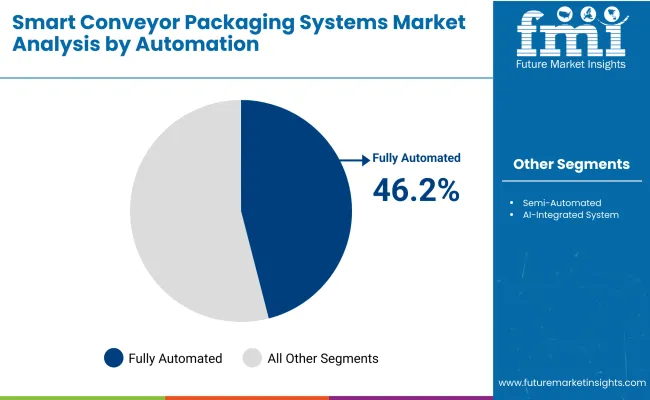
Fully Automated Systems Lead with Maximum Throughput and Labour Savings

Smart Conveyor Packaging System Market By Automation

Fully automated systems are forecast to command a 46.2% share in 2025, driven by their ability to execute packaging operations with minimal human intervention. These systems integrate robotics, PLC controls, and vision-guided alignment to ensure precise product handling and consistent output. The result is reduced labour dependency, lower operational errors, and improved packaging line efficiency.

Adoption is supported by rising labour costs and demand for high-speed, multi-shift operations in manufacturing plants. Fully automated conveyors enable seamless integration with upstream and downstream equipment, enhancing workflow continuity. With predictive maintenance features and adaptive control software, these systems deliver long-term productivity gains and cost optimization.
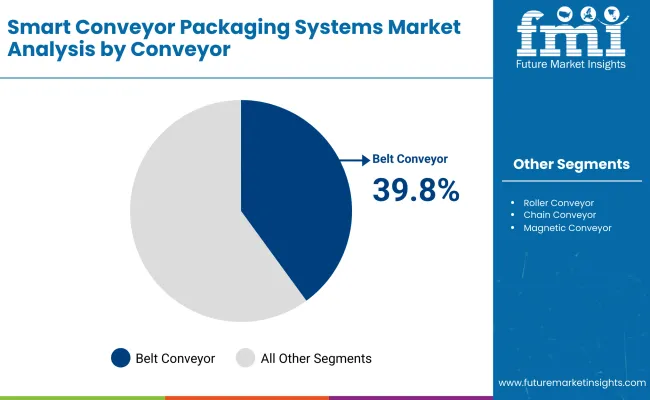
Belt Conveyors Dominate with Versatility and Gentle Product Handling

Smart Conveyor Packaging System Market By Conveyor

Belt conveyors are expected to account for 39.8% of the market in 2025, favoured for their adaptability to a wide range of product sizes and shapes. Their smooth, continuous surfaces ensure stable transport, reducing the risk of product damage in packaging lines. Modular designs enable easy cleaning and quick belt replacement.

They are widely used in food, beverage, and consumer goods packaging, where hygiene and product integrity are critical. Belt conveyors can be equipped with speed control, incline/decline configurations, and automated sorting to accommodate diverse packaging formats. Their flexibility supports rapid line reconfiguration for seasonal or custom product runs.

IoT Sensors Lead with Real-Time Monitoring and Predictive Maintenance

IoT sensor integration is projected to hold a 33.8% share in 2025, enabling continuous performance tracking and early fault detection in conveyor systems. Sensors monitor variables such as belt tension, motor temperature, and vibration levels, transmitting data to centralized platforms for analysis. This minimizes downtime and extends equipment lifespan.

Their role in predictive maintenance aligns with industry trends toward Industry 4.0-enabled operations. IoT-enabled conveyors provide actionable insights that optimize energy use, schedule service proactively, and improve operational transparency. Data connectivity also supports remote diagnostics, enhancing responsiveness in multi-facility packaging networks.
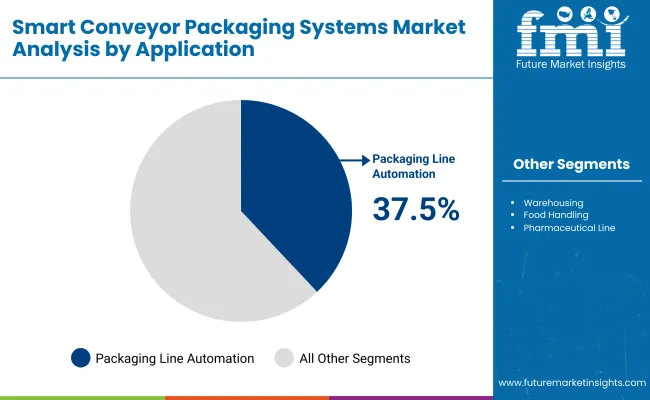
Packaging Line Automation Dominates with End-to-End Integration Benefits

Smart Conveyor Packaging System Market By Application

Packaging line automation is forecast to account for 37.5% of market share in 2025, streamlining processes from product infeed to final packing. Smart conveyors equipped with automated sorting, spacing, and merging functions synchronize seamlessly with labelling, sealing, and inspection units. This integrated approach increases throughput and reduces bottlenecks.

The capability to manage high-speed operations with minimal errors supports industries with complex, multi-SKU production schedules. Real-time monitoring ensures precise execution, while adaptive controls accommodate sudden changes in demand. Automation also enhances safety compliance by reducing manual handling of packaged goods.

Packaging Industry Leads with High Operational Demands and Product Variety

The packaging industry is expected to represent 31.4% of market demand in 2025, driven by the need for consistent, high-quality product presentation. Smart conveyor systems meet these demands by ensuring precise alignment, spacing, and product flow during packaging. This reduces defects and supports faster delivery cycles.

Manufacturers value their scalability for handling diverse packaging formats, from cartons to flexible pouches. Integration with inspection systems helps maintain brand standards and regulatory compliance. The industry’s push toward efficiency, sustainability, and automation will continue to drive investment in smart conveyor solutions.

What are the Drivers, Restraints, and Key Trends of the Smart Conveyor Packaging Systems Market?

The smart conveyor packaging systems market is expanding as manufacturers adopt automation to improve efficiency, reduce labour costs, and increase production flexibility. Rising demand for faster changeovers, precision handling, and integration with Industry 4.0 platforms is boosting adoption across food, beverage, pharmaceuticals, and e-commerce sectors. However, high capital investment and complex integration with existing lines remain key barriers. Innovations in IoT connectivity, AI-driven monitoring, and energy-efficient designs are expected to drive long-term growth.

Automation Efficiency, Flexibility, and Product Safety Driving Adoption

Smart conveyor packaging systems enhance throughput by enabling synchronized product movement, automated sorting, and precision positioning during packaging. Industries such as food and beverage benefit from hygienic designs that meet strict safety standards, while pharmaceuticals rely on these systems for tamper-evident and contamination-free handling.

Their modular configurations allow rapid changeovers between product SKUs, reducing downtime and accommodating varied packaging formats. Integration with vision systems, sensors, and robotics improves quality assurance, enabling real-time rejection of defective items. These capabilities position smart conveyors as essential tools for achieving high-speed, error-free packaging in competitive markets.

High Capital Costs, Integration Challenges, and Workforce Adaptation Barriers

Despite strong benefits, the high upfront cost of advanced conveyor systems, including smart sensors, servo drives, and software controls, limits adoption among smaller manufacturers. Integrating these systems into existing facilities can require significant layout redesigns, additional space, and complex synchronization with upstream and downstream equipment.

Workforce adaptation presents another hurdle, as operators and maintenance staff must be trained to manage automated controls and troubleshoot issues. Additionally, companies face ongoing costs for software updates, spare parts, and predictive maintenance tools, which can slow return on investment in cost-sensitive environments.

IoT Connectivity, AI Optimization, and Sustainability Trends Emerging

Key trends include IoT-enabled conveyors that provide real-time performance monitoring, predictive maintenance alerts, and integration with enterprise resource planning (ERP) systems. AI algorithms are being used to optimize conveyor speed, reduce energy consumption, and adapt packaging flows based on order demand.

Sustainability goals are driving demand for conveyors with energy-efficient motors, recyclable materials, and minimal lubrication requirements. Advances in robotics integration are enabling fully automated end-of-line packaging, reducing labour dependency. These developments are transforming smart conveyors from mechanical transport tools into intelligent, data-driven assets that support operational agility, cost savings, and environmental responsibility.
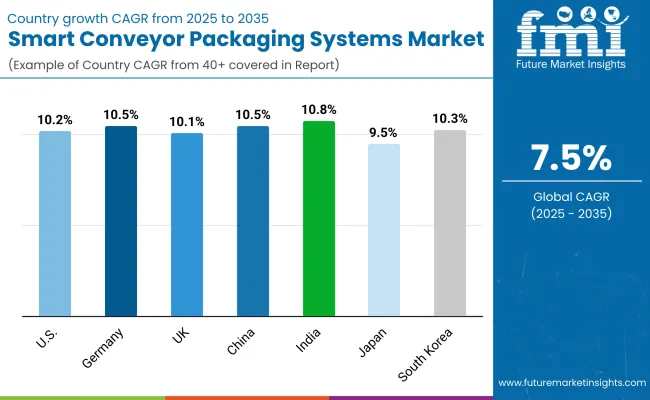
Analysis of Smart Conveyor Packaging Systems Market by Key Countries

Smart Conveyor Packaging System Market By Country

The global smart conveyor packaging systems market is expanding rapidly, driven by demand for automation, high-speed handling, and real-time quality control in packaging operations. Asia-Pacific is emerging as a prime growth hub, with India and China advancing adoption through manufacturing modernization and smart factory investments. Developed markets like the USA, Germany, and Japan are leading innovations in sensor-based conveyors, AI-driven inspection, and energy-efficient designs to meet efficiency, accuracy, and sustainability requirements.

Sales Outlook for Smart Conveyor Packaging Systems United States

The USA market is projected to grow at a CAGR of 10.2% from 2025 to 2035, driven by strong adoption in food, beverage, and e-commerce fulfilmentcentres. Companies are investing in conveyors with automated sorting, predictive maintenance, and integrated vision systems to improve throughput and reduce labour dependency.

  • Warehouses deploy AI-based conveyors for adaptive sorting.
  • Food plants use hygienic designs for quick sanitation cycles.
  • IoTenabled systems track real-time performance metrics.

Growth Outlook for Smart Conveyor Packaging Systems Germany

Germany’s market is expected to grow at a CAGR of 10.5%, anchored by its advanced engineering and packaging machinery industries. Manufacturers are integrating robotics with conveyor systems to handle complex product mixes and customized orders. Demand is driven by precision packaging for pharmaceuticals, automotive parts, and premium food products.

  • Robotics-enabled conveyors support flexible packaging formats.
  • Energy-efficient drives reduce operational costs.
  • Predictive analytics platforms optimize conveyor scheduling.

Expansion Outlook for Smart Conveyor Packaging Systems United Kingdom

The UK market is forecast to expand at a CAGR of 10.1%, driven by growth in online retail, FMCG, and logistics sectors. SMEs are adopting modular conveyor solutions with plug-and-play automation features to scale operations quickly. Compliance with food safety and sustainability standards is pushing upgrades to smart conveyor systems.

  • Retailers use conveyors with integrated RFID for inventory tracking.
  • Packaging plants adopt quick-changeover modules.
  • Data-driven maintenance extends equipment lifespan.

Sales Outlook for Smart Conveyor Packaging Systems China

China’s market is projected to grow at a CAGR of 10.5%, supported by large-scale manufacturing and government-backed smart industry initiatives. Factories are implementing conveyors with AI-based defect detection and adaptive speed control for high-volume packaging lines.

  • OEMs deliver custom conveyor systems for multi-size packaging.
  • Vision-guided sorting improves product handling accuracy.
  • Cloud-based platforms enable centralized operational control.

Growth Outlook for Smart Conveyor Packaging Systems India

India is forecast to record the fastest growth at a CAGR of 10.8%, fuelled by rapid expansion in FMCG, pharmaceuticals, and packaged food sectors. Affordable, scalable smart conveyor systems are being adopted by mid-sized manufacturers to enhance efficiency.

  • Pharma plants adopt conveyors with contamination control features.
  • FMCG firms use auto-sorting for mixed product SKUs.
  • Remote monitoring enables multi-location performance oversight.

Growth Outlook for Smart Conveyor Packaging Systems Japan

Japan is expected to grow at a CAGR of 9.5%, driven by automation in electronics, cosmetics, and precision food packaging. Manufacturers favour compact, high-speed conveyors with real-time inspection systems.

  • Electronics firms adopt conveyors for micro-component handling.
  • Packaging lines integrate AI inspection for defect-free output.
  • Quiet, energy-saving conveyor designs gain popularity.

Expansion Outlook for Smart Conveyor Packaging Systems South Korea

South Korea’s market is projected to grow at a CAGR of 10.3%, led by adoption in semiconductor, shipbuilding, and packaged food industries. High-connectivity infrastructure supports advanced conveyor automation and monitoring.
  • Semiconductor fabs deploy conveyors with static control systems.
  • Food producers use modular hygienic conveyors for export compliance.
  • Cloud-linked systems enable cross-plant operational coordination.

Competitive Landscape of Smart Conveyor Packaging Systems Market

Smart Conveyor Packaging System Market By Company

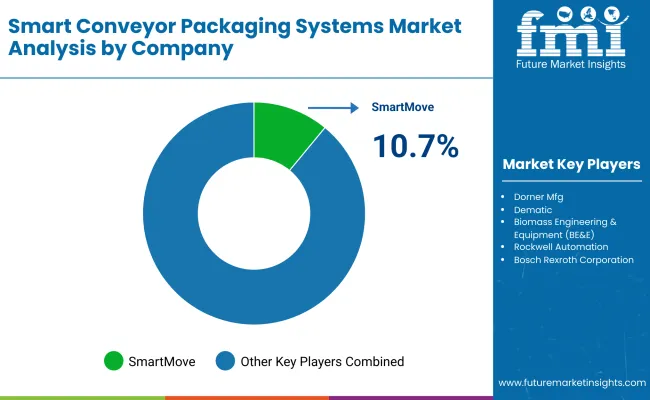
The smart conveyor packaging systems market is moderately fragmented, with automation leaders, material handling specialists, and intelligent controls providers competing across food, beverage, pharmaceutical, and e-commerce fulfilment sectors. Global leaders such as SmartMove, Dorner Mfg, and Dematic hold notable market share, driven by precision motion control, IoT-enabled monitoring, and high-throughput designs meeting stringent industry hygiene and safety standards. Their strategies increasingly emphasize predictive maintenance, modular layouts, and energy-efficient operation.

Established mid-sized players including Biomass Engineering & Equipment (BE&E), Rockwell Automation, and Bosch Rexroth Corporation are supporting adoption of conveyor platforms featuring integrated robotics, real-time diagnostics, and adaptive speed control. These companies are especially active in high-speed packaging, bulk handling, and cold chain operations, offering seamless integration with packaging machinery, SCADA systems, and cloud-based performance analytics.

Specialized intralogistics providers such as Bastian Solutions, SSI SCHAEFER, TGW Logistics, and FlexLink focus on tailored solutions for regional manufacturers and distribution hubs. Their strengths lie in customized conveyor engineering, advanced sortation systems, and deployment of smart sensors and vision technology to enable error-free packaging, optimized product flow, and rapid changeovers in dynamic production environments.

Key Development

  • In May 2025, Detroit, FlexLink unveiled the RC12 Collaborative Palletizer and AMC’s ModuCon 6 conveyor, an ultra-fast twin-strand palletized conveyor system capable of up to 200 FPM, designed for compact, safe automation and high-speed handling.
  • In 2024,Dematic delivered a state-of-the-art AutoStore system with 12,500 bins, four R5 robots, and two conveyor ports to a fully automated warehouse in Moulins, France. This facility, operated by logistics provider GEODIS for defense manufacturer Nexter (part of KNDS Group), spans 22,000 m² and significantly streamlines maintenance and operational services.

Key Companies

  • SmartMove
  • Dorner Mfg
  • Dematic
  • Biomass Engineering & Equipment (BE&E)
  • Rockwell Automation
  • Bosch Rexroth Corporation
  • Bastian Solutions, LLC
  • SSI SCHAEFER
  • TGW Logistics
  • FlexLink

Scope of the Report

Item Value
Quantitative Units USD 7.5 Billion
By Automation Level Semi-Automated, Fully Automated, AI-Integrated Systems
By Conveyor Type Belt Conveyor, Roller Conveyor, Chain Conveyor, Magnetic Conveyor
By Smart Features IoT Sensors, Predictive Maintenance, RFID Integration, Vision Systems
By Application Packaging Line Automation, Warehousing, Food Handling, Pharmaceutical Lines
By End-Use Industry Packaging, E-commerce, Logistics, Pharmaceuticals, Food & Beverage
Key Companies Profiled SmartMove, Dorner Mfg, Dematic, Biomass Engineering & Equipment (BE&E), Rockwell Automation, Bosch Rexroth Corporation, Bastian Solutions, LLC, SSI SCHAEFER, TGW Logistics, FlexLink
Additional Attributes Increasing shift toward AI-powered conveyor systems for predictive analytics and process optimization, integration of IoT sensors to monitor performance in real time, adoption of RFID and vision systems for product tracking and quality inspection, growing demand for high-speed and modular conveyor solutions in e-commerce and packaging sectors, and rising automation adoption in food and pharma lines to meet hygiene and throughput requirements.

Key Segmentation

By Automation Level:

  • Semi-Automated
  • Fully Automated
  • AI-Integrated Systems

By Conveyor Type:

  • Belt Conveyor
  • Roller Conveyor
  • Chain Conveyor
  • Magnetic Conveyor

By Smart Features:

  • IoT Sensors
  • Predictive Maintenance
  • RFID Integration
  • Vision Systems

By Application:

  • Packaging Line Automation
  • Warehousing
  • Food Handling
  • Pharmaceutical Lines

By End-Use Industry:

  • Packaging
  • E-commerce
  • Logistics
  • Pharmaceuticals
  • Food & Beverage

By Region:

  • North America
  • Europe
  • Asia-Pacific
  • Latin America
  • Middle East & Africa

Table of Content

  1. Executive Summary
    • Global Market Outlook
    • Demand-side Trends
    • Supply-side Trends
    • Technology Roadmap Analysis
    • Analysis and Recommendations
  2. Market Overview
    • Market Coverage / Taxonomy
    • Market Definition / Scope / Limitations
  3. Market Background
    • Market Dynamics
      • Drivers
      • Restraints
      • Opportunity
      • Trends
    • Scenario Forecast
      • Demand in Optimistic Scenario
      • Demand in Likely Scenario
      • Demand in Conservative Scenario
    • Opportunity Map Analysis
    • Product Life Cycle Analysis
    • Supply Chain Analysis
      • Supply Side Participants and their Roles
        • Producers
        • Mid-Level Participants (Traders/ Agents/ Brokers)
        • Wholesalers and Distributors
      • Value Added and Value Created at Node in the Supply Chain
      • List of Raw Material Suppliers
      • List of Existing and Potential Buyer’s
    • Investment Feasibility Matrix
    • Value Chain Analysis
      • Profit Margin Analysis
      • Wholesalers and Distributors
      • Retailers
    • PESTLE and Porter’s Analysis
    • Regulatory Landscape
      • By Key Regions
      • By Key Countries
    • Regional Parent Market Outlook
    • Production and Consumption Statistics
    • Import and Export Statistics
  4. Global Market Analysis 2020 to 2024 and Forecast, 2025 to 2035
    • Historical Market Size Value (USD Billion) & Volume (Units) Analysis, 2020 to 2024
    • Current and Future Market Size Value (USD Billion) & Volume (Units) Projections, 2025 to 2035
      • Y-o-Y Growth Trend Analysis
      • Absolute $ Opportunity Analysis
  5. Global Market Pricing Analysis 2020 to 2024 and Forecast 2025 to 2035
  6. Global Market Analysis 2020 to 2024 and Forecast 2025 to 2035, By Automation Level
    • Introduction / Key Findings
    • Historical Market Size Value (USD Billion) & Volume (Units) Analysis By Automation Level, 2020 to 2024
    • Current and Future Market Size Value (USD Billion) & Volume (Units) Analysis and Forecast By Automation Level, 2025 to 2035
      • Semi-Automated
      • Fully Automated
      • AI-Integrated Systems
    • Y-o-Y Growth Trend Analysis By Automation Level, 2020 to 2024
    • Absolute $ Opportunity Analysis By Automation Level, 2025 to 2035
  7. Global Market Analysis 2020 to 2024 and Forecast 2025 to 2035, By Conveyor Type
    • Introduction / Key Findings
    • Historical Market Size Value (USD Billion) & Volume (Units) Analysis By Conveyor Type, 2020 to 2024
    • Current and Future Market Size Value (USD Billion) & Volume (Units) Analysis and Forecast By Conveyor Type, 2025 to 2035
      • Belt Conveyor
      • Roller Conveyor
      • Chain Conveyor
      • Magnetic Conveyor
    • Y-o-Y Growth Trend Analysis By Conveyor Type, 2020 to 2024
    • Absolute $ Opportunity Analysis By Conveyor Type, 2025 to 2035
  8. Global Market Analysis 2020 to 2024 and Forecast 2025 to 2035, By Smart Features
    • Introduction / Key Findings
    • Historical Market Size Value (USD Billion) & Volume (Units) Analysis By Smart Features, 2020 to 2024
    • Current and Future Market Size Value (USD Billion) & Volume (Units) Analysis and Forecast By Smart Features, 2025 to 2035
      • IoT Sensors
      • Predictive Maintenance
      • RFID Integration
      • Vision Systems
    • Y-o-Y Growth Trend Analysis By Smart Features, 2020 to 2024
    • Absolute $ Opportunity Analysis By Smart Features, 2025 to 2035
  9. Global Market Analysis 2020 to 2024 and Forecast 2025 to 2035, By Application
    • Introduction / Key Findings
    • Historical Market Size Value (USD Billion) & Volume (Units) Analysis By Application, 2020 to 2024
    • Current and Future Market Size Value (USD Billion) & Volume (Units) Analysis and Forecast By Application, 2025 to 2035
      • Packaging Line Automation
      • Warehousing
      • Food Handling
      • Pharmaceutical Lines
    • Y-o-Y Growth Trend Analysis By Application, 2020 to 2024
    • Absolute $ Opportunity Analysis By Application, 2025 to 2035
  10. Global Market Analysis 2020 to 2024 and Forecast 2025 to 2035, By End-Use Industry
    • Introduction / Key Findings
    • Historical Market Size Value (USD Billion) & Volume (Units) Analysis By End-Use Industry, 2020 to 2024
    • Current and Future Market Size Value (USD Billion) & Volume (Units) Analysis and Forecast By End-Use Industry, 2025 to 2035
      • Packaging
      • E-commerce
      • Logistics
      • Pharmaceuticals
      • Food & Beverage
    • Y-o-Y Growth Trend Analysis By End-Use Industry, 2020 to 2024
    • Absolute $ Opportunity Analysis By End-Use Industry, 2025 to 2035
  11. Global Market Analysis 2020 to 2024 and Forecast 2025 to 2035, By Region
    • Introduction
    • Historical Market Size Value (USD Billion) & Volume (Units) Analysis By Region, 2020 to 2024
    • Current Market Size Value (USD Billion) & Volume (Units) Analysis and Forecast By Region, 2025 to 2035
      • North America
      • Latin America
      • Europe
      • East Asia
      • South Asia
      • Oceania
      • MEA
    • Market Attractiveness Analysis By Region
  12. North America Market Analysis 2020 to 2024 and Forecast 2025 to 2035, By Country
    • Historical Market Size Value (USD Billion) & Volume (Units) Trend Analysis By Market Taxonomy, 2020 to 2024
    • Market Size Value (USD Billion) & Volume (Units) Forecast By Market Taxonomy, 2025 to 2035
      • By Country
        • USA
        • Canada
      • By Automation Level
      • By Conveyor Type
      • By Smart Features
      • By Application
      • By End-Use Industry
    • Market Attractiveness Analysis
      • By Country
      • By Automation Level
      • By Conveyor Type
      • By Smart Features
      • By Application
      • By End-Use Industry
    • Key Takeaways
  13. Latin America Market Analysis 2020 to 2024 and Forecast 2025 to 2035, By Country
    • Historical Market Size Value (USD Billion) & Volume (Units) Trend Analysis By Market Taxonomy, 2020 to 2024
    • Market Size Value (USD Billion) & Volume (Units) Forecast By Market Taxonomy, 2025 to 2035
      • By Country
        • Brazil
        • Mexico
        • Argentina
        • Chile
        • Peru
        • Rest of Latin America
      • By Automation Level
      • By Conveyor Type
      • By Smart Features
      • By Application
      • By End-Use Industry
    • Market Attractiveness Analysis
      • By Country
      • By Automation Level
      • By Conveyor Type
      • By Smart Features
      • By Application
      • By End-Use Industry
    • Key Takeaways
  14. Europe Market Analysis 2020 to 2024 and Forecast 2025 to 2035, By Country
    • Historical Market Size Value (USD Billion) & Volume (Units) Trend Analysis By Market Taxonomy, 2020 to 2024
    • Market Size Value (USD Billion) & Volume (Units) Forecast By Market Taxonomy, 2025 to 2035
      • By Country
        • Germany
        • Italy
        • France
        • UK
        • Spain
        • Russia
        • BENELUX
        • Rest of Europe
      • By Automation Level
      • By Conveyor Type
      • By Smart Features
      • By Application
      • By End-Use Industry
    • Market Attractiveness Analysis
      • By Country
      • By Automation Level
      • By Conveyor Type
      • By Smart Features
      • By Application
      • By End-Use Industry
    • Key Takeaways
  15. East Asia Market Analysis 2020 to 2024 and Forecast 2025 to 2035, By Country
    • Historical Market Size Value (USD Billion) & Volume (Units) Trend Analysis By Market Taxonomy, 2020 to 2024
    • Market Size Value (USD Billion) & Volume (Units) Forecast By Market Taxonomy, 2025 to 2035
      • By Country
        • China
        • Japan
        • South Korea
      • By Automation Level
      • By Conveyor Type
      • By Smart Features
      • By Application
      • By End-Use Industry
    • Market Attractiveness Analysis
      • By Country
      • By Automation Level
      • By Conveyor Type
      • By Smart Features
      • By Application
      • By End-Use Industry
    • Key Takeaways
  16. South Asia Market Analysis 2020 to 2024 and Forecast 2025 to 2035, By Country
    • Historical Market Size Value (USD Billion) & Volume (Units) Trend Analysis By Market Taxonomy, 2020 to 2024
    • Market Size Value (USD Billion) & Volume (Units) Forecast By Market Taxonomy, 2025 to 2035
      • By Country
        • India
        • Thailand
        • Malaysia
        • Indonesia
        • Rest of South Asia
      • By Automation Level
      • By Conveyor Type
      • By Smart Features
      • By Application
      • By End-Use Industry
    • Market Attractiveness Analysis
      • By Country
      • By Automation Level
      • By Conveyor Type
      • By Smart Features
      • By Application
      • By End-Use Industry
    • Key Takeaways
  17. Oceania Market Analysis 2020 to 2024 and Forecast 2025 to 2035, By Country
    • Historical Market Size Value (USD Billion) & Volume (Units) Trend Analysis By Market Taxonomy, 2020 to 2024
    • Market Size Value (USD Billion) & Volume (Units) Forecast By Market Taxonomy, 2025 to 2035
      • By Country
        • Australia
        • New Zealand
      • By Automation Level
      • By Conveyor Type
      • By Smart Features
      • By Application
      • By End-Use Industry
    • Market Attractiveness Analysis
      • By Country
      • By Automation Level
      • By Conveyor Type
      • By Smart Features
      • By Application
      • By End-Use Industry
    • Key Takeaways
  18. MEA Market Analysis 2020 to 2024 and Forecast 2025 to 2035, By Country
    • Historical Market Size Value (USD Billion) & Volume (Units) Trend Analysis By Market Taxonomy, 2020 to 2024
    • Market Size Value (USD Billion) & Volume (Units) Forecast By Market Taxonomy, 2025 to 2035
      • By Country
        • GCC
        • Rest of MEA
      • By Automation Level
      • By Conveyor Type
      • By Smart Features
      • By Application
      • By End-Use Industry
    • Market Attractiveness Analysis
      • By Country
      • By Automation Level
      • By Conveyor Type
      • By Smart Features
      • By Application
      • By End-Use Industry
    • Key Takeaways
  19. Key Countries Market Analysis
    • USA
      • Pricing Analysis
      • Market Share Analysis, 2024
        • By Automation Level
        • By Conveyor Type
        • By Smart Features
        • By Application
        • By End-Use Industry
    • Canada
      • Pricing Analysis
      • Market Share Analysis, 2024
        • By Automation Level
        • By Conveyor Type
        • By Smart Features
        • By Application
        • By End-Use Industry
    • Brazil
      • Pricing Analysis
      • Market Share Analysis, 2024
        • By Automation Level
        • By Conveyor Type
        • By Smart Features
        • By Application
        • By End-Use Industry
    • Mexico
      • Pricing Analysis
      • Market Share Analysis, 2024
        • By Automation Level
        • By Conveyor Type
        • By Smart Features
        • By Application
        • By End-Use Industry
    • Argentina
      • Pricing Analysis
      • Market Share Analysis, 2024
        • By Automation Level
        • By Conveyor Type
        • By Smart Features
        • By Application
        • By End-Use Industry
  20. Market Structure Analysis
    • Competition Dashboard
    • Competition Benchmarking
    • Market Share Analysis of Top Players
      • By Regional
      • By Automation Level
      • By Conveyor Type
      • By Smart Features
      • By Application
      • By End-Use Industry
  21. Competition Analysis
    • Competition Deep Dive
      • SmartMove
        • Overview
        • Product Portfolio
        • Profitability by Market Segments (Product/Age /Sales Channel/Region)
        • Sales Footprint
        • Strategy Overview
          • Marketing Strategy
          • Product Strategy
          • Channel Strategy
      • Dorner Mfg
        • Overview
        • Product Portfolio
        • Profitability by Market Segments (Product/Age /Sales Channel/Region)
        • Sales Footprint
        • Strategy Overview
          • Marketing Strategy
          • Product Strategy
          • Channel Strategy
      • Dematic
        • Overview
        • Product Portfolio
        • Profitability by Market Segments (Product/Age /Sales Channel/Region)
        • Sales Footprint
        • Strategy Overview
          • Marketing Strategy
          • Product Strategy
          • Channel Strategy
      • Biomass Engineering & Equipment (BE&E)
        • Overview
        • Product Portfolio
        • Profitability by Market Segments (Product/Age /Sales Channel/Region)
        • Sales Footprint
        • Strategy Overview
          • Marketing Strategy
          • Product Strategy
          • Channel Strategy
      • Rockwell Automation
        • Overview
        • Product Portfolio
        • Profitability by Market Segments (Product/Age /Sales Channel/Region)
        • Sales Footprint
        • Strategy Overview
          • Marketing Strategy
          • Product Strategy
          • Channel Strategy
      • Bosch Rexroth Corporation
        • Overview
        • Product Portfolio
        • Profitability by Market Segments (Product/Age /Sales Channel/Region)
        • Sales Footprint
        • Strategy Overview
          • Marketing Strategy
          • Product Strategy
          • Channel Strategy
      • Bastian Solutions, LLC
        • Overview
        • Product Portfolio
        • Profitability by Market Segments (Product/Age /Sales Channel/Region)
        • Sales Footprint
        • Strategy Overview
          • Marketing Strategy
          • Product Strategy
          • Channel Strategy
      • SSI SCHAEFER
        • Overview
        • Product Portfolio
        • Profitability by Market Segments (Product/Age /Sales Channel/Region)
        • Sales Footprint
        • Strategy Overview
          • Marketing Strategy
          • Product Strategy
          • Channel Strategy
      • TGW Logistics
        • Overview
        • Product Portfolio
        • Profitability by Market Segments (Product/Age /Sales Channel/Region)
        • Sales Footprint
        • Strategy Overview
          • Marketing Strategy
          • Product Strategy
          • Channel Strategy
      • FlexLink
        • Overview
        • Product Portfolio
        • Profitability by Market Segments (Product/Age /Sales Channel/Region)
        • Sales Footprint
        • Strategy Overview
          • Marketing Strategy
          • Product Strategy
          • Channel Strategy
  22. Assumptions & Acronyms Used
  23. Research Methodology

List of Tables

  • Table 1: Global Market Value (USD Billion) Forecast by Region, 2020-2035
  • Table 2: Global Market Volume (Units) Forecast by Region, 2020-2035
  • Table 3: Global Market Value (USD Billion) Forecast By Automation Level, 2020-2035
  • Table 4: Global Market Volume (Units) Forecast By Automation Level, 2020-2035
  • Table 5: Global Market Value (USD Billion) Forecast By Conveyor Type, 2020-2035
  • Table 6: Global Market Volume (Units) Forecast By Conveyor Type, 2020-2035
  • Table 7: Global Market Value (USD Billion) Forecast By Smart Features, 2020-2035
  • Table 8: Global Market Volume (Units) Forecast By Smart Features, 2020-2035
  • Table 9: Global Market Value (USD Billion) Forecast By Application, 2020-2035
  • Table 10: Global Market Volume (Units) Forecast By Application, 2020-2035
  • Table 11: Global Market Value (USD Billion) Forecast By End-Use Industry, 2020-2035
  • Table 12: Global Market Volume (Units) Forecast By End-Use Industry, 2020-2035
  • Table 13: North America Market Value (USD Billion) Forecast by Country, 2020-2035
  • Table 14: North America Market Volume (Units) Forecast by Country, 2020-2035
  • Table 15: North America Market Value (USD Billion) Forecast By Automation Level, 2020-2035
  • Table 16: North America Market Volume (Units) Forecast By Automation Level, 2020-2035
  • Table 17: North America Market Value (USD Billion) Forecast By Conveyor Type, 2020-2035
  • Table 18: North America Market Volume (Units) Forecast By Conveyor Type, 2020-2035
  • Table 19: North America Market Value (USD Billion) Forecast By Smart Features, 2020-2035
  • Table 20: North America Market Volume (Units) Forecast By Smart Features, 2020-2035
  • Table 21: North America Market Value (USD Billion) Forecast By Application, 2020-2035
  • Table 22: North America Market Volume (Units) Forecast By Application, 2020-2035
  • Table 23: North America Market Value (USD Billion) Forecast By End-Use Industry, 2020-2035
  • Table 24: North America Market Volume (Units) Forecast By End-Use Industry, 2020-2035
  • Table 25: Latin America Market Value (USD Billion) Forecast by Country, 2020-2035
  • Table 26: Latin America Market Volume (Units) Forecast by Country, 2020-2035
  • Table 27: Latin America Market Value (USD Billion) Forecast By Automation Level, 2020-2035
  • Table 28: Latin America Market Volume (Units) Forecast By Automation Level, 2020-2035
  • Table 29: Latin America Market Value (USD Billion) Forecast By Conveyor Type, 2020-2035
  • Table 30: Latin America Market Volume (Units) Forecast By Conveyor Type, 2020-2035
  • Table 31: Latin America Market Value (USD Billion) Forecast By Smart Features, 2020-2035
  • Table 32: Latin America Market Volume (Units) Forecast By Smart Features, 2020-2035
  • Table 33: Latin America Market Value (USD Billion) Forecast By Application, 2020-2035
  • Table 34: Latin America Market Volume (Units) Forecast By Application, 2020-2035
  • Table 35: Latin America Market Value (USD Billion) Forecast By End-Use Industry, 2020-2035
  • Table 36: Latin America Market Volume (Units) Forecast By End-Use Industry, 2020-2035
  • Table 37: Europe Market Value (USD Billion) Forecast by Country, 2020-2035
  • Table 38: Europe Market Volume (Units) Forecast by Country, 2020-2035
  • Table 39: Europe Market Value (USD Billion) Forecast By Automation Level, 2020-2035
  • Table 40: Europe Market Volume (Units) Forecast By Automation Level, 2020-2035
  • Table 41: Europe Market Value (USD Billion) Forecast By Conveyor Type, 2020-2035
  • Table 42: Europe Market Volume (Units) Forecast By Conveyor Type, 2020-2035
  • Table 43: Europe Market Value (USD Billion) Forecast By Smart Features, 2020-2035
  • Table 44: Europe Market Volume (Units) Forecast By Smart Features, 2020-2035
  • Table 45: Europe Market Value (USD Billion) Forecast By Application, 2020-2035
  • Table 46: Europe Market Volume (Units) Forecast By Application, 2020-2035
  • Table 47: Europe Market Value (USD Billion) Forecast By End-Use Industry, 2020-2035
  • Table 48: Europe Market Volume (Units) Forecast By End-Use Industry, 2020-2035
  • Table 49: East Asia Market Value (USD Billion) Forecast by Country, 2020-2035
  • Table 50: East Asia Market Volume (Units) Forecast by Country, 2020-2035
  • Table 51: East Asia Market Value (USD Billion) Forecast By Automation Level, 2020-2035
  • Table 52: East Asia Market Volume (Units) Forecast By Automation Level, 2020-2035
  • Table 53: East Asia Market Value (USD Billion) Forecast By Conveyor Type, 2020-2035
  • Table 54: East Asia Market Volume (Units) Forecast By Conveyor Type, 2020-2035
  • Table 55: East Asia Market Value (USD Billion) Forecast By Smart Features, 2020-2035
  • Table 56: East Asia Market Volume (Units) Forecast By Smart Features, 2020-2035
  • Table 57: East Asia Market Value (USD Billion) Forecast By Application, 2020-2035
  • Table 58: East Asia Market Volume (Units) Forecast By Application, 2020-2035
  • Table 59: East Asia Market Value (USD Billion) Forecast By End-Use Industry, 2020-2035
  • Table 60: East Asia Market Volume (Units) Forecast By End-Use Industry, 2020-2035
  • Table 61: South Asia Market Value (USD Billion) Forecast by Country, 2020-2035
  • Table 62: South Asia Market Volume (Units) Forecast by Country, 2020-2035
  • Table 63: South Asia Market Value (USD Billion) Forecast By Automation Level, 2020-2035
  • Table 64: South Asia Market Volume (Units) Forecast By Automation Level, 2020-2035
  • Table 65: South Asia Market Value (USD Billion) Forecast By Conveyor Type, 2020-2035
  • Table 66: South Asia Market Volume (Units) Forecast By Conveyor Type, 2020-2035
  • Table 67: South Asia Market Value (USD Billion) Forecast By Smart Features, 2020-2035
  • Table 68: South Asia Market Volume (Units) Forecast By Smart Features, 2020-2035
  • Table 69: South Asia Market Value (USD Billion) Forecast By Application, 2020-2035
  • Table 70: South Asia Market Volume (Units) Forecast By Application, 2020-2035
  • Table 71: South Asia Market Value (USD Billion) Forecast By End-Use Industry, 2020-2035
  • Table 72: South Asia Market Volume (Units) Forecast By End-Use Industry, 2020-2035
  • Table 73: Oceania Market Value (USD Billion) Forecast by Country, 2020-2035
  • Table 74: Oceania Market Volume (Units) Forecast by Country, 2020-2035
  • Table 75: Oceania Market Value (USD Billion) Forecast By Automation Level, 2020-2035
  • Table 76: Oceania Market Volume (Units) Forecast By Automation Level, 2020-2035
  • Table 77: Oceania Market Value (USD Billion) Forecast By Conveyor Type, 2020-2035
  • Table 78: Oceania Market Volume (Units) Forecast By Conveyor Type, 2020-2035
  • Table 79: Oceania Market Value (USD Billion) Forecast By Smart Features, 2020-2035
  • Table 80: Oceania Market Volume (Units) Forecast By Smart Features, 2020-2035
  • Table 81: Oceania Market Value (USD Billion) Forecast By Application, 2020-2035
  • Table 82: Oceania Market Volume (Units) Forecast By Application, 2020-2035
  • Table 83: Oceania Market Value (USD Billion) Forecast By End-Use Industry, 2020-2035
  • Table 84: Oceania Market Volume (Units) Forecast By End-Use Industry, 2020-2035
  • Table 85: MEA Market Value (USD Billion) Forecast by Country, 2020-2035
  • Table 86: MEA Market Volume (Units) Forecast by Country, 2020-2035
  • Table 87: MEA Market Value (USD Billion) Forecast By Automation Level, 2020-2035
  • Table 88: MEA Market Volume (Units) Forecast By Automation Level, 2020-2035
  • Table 89: MEA Market Value (USD Billion) Forecast By Conveyor Type, 2020-2035
  • Table 90: MEA Market Volume (Units) Forecast By Conveyor Type, 2020-2035
  • Table 91: MEA Market Value (USD Billion) Forecast By Smart Features, 2020-2035
  • Table 92: MEA Market Volume (Units) Forecast By Smart Features, 2020-2035
  • Table 93: MEA Market Value (USD Billion) Forecast By Application, 2020-2035
  • Table 94: MEA Market Volume (Units) Forecast By Application, 2020-2035
  • Table 95: MEA Market Value (USD Billion) Forecast By End-Use Industry, 2020-2035
  • Table 96: MEA Market Volume (Units) Forecast By End-Use Industry, 2020-2035

List of Figures

  • Figure 1: Global Market Volume (Units) Forecast 2020-2035
  • Figure 2: Global Market Pricing Analysis
  • Figure 3: Global Market Value (USD Billion) Forecast 2020-2035
  • Figure 4: Global Market Value Share and BPS Analysis By Automation Level, 2025 and 2035
  • Figure 5: Global Market Y-o-Y Growth Comparison By Automation Level, 2025-2035
  • Figure 6: Global Market Attractiveness Analysis By Automation Level
  • Figure 7: Global Market Value Share and BPS Analysis By Conveyor Type, 2025 and 2035
  • Figure 8: Global Market Y-o-Y Growth Comparison By Conveyor Type, 2025-2035
  • Figure 9: Global Market Attractiveness Analysis By Conveyor Type
  • Figure 10: Global Market Value Share and BPS Analysis By Smart Features, 2025 and 2035
  • Figure 11: Global Market Y-o-Y Growth Comparison By Smart Features, 2025-2035
  • Figure 12: Global Market Attractiveness Analysis By Smart Features
  • Figure 13: Global Market Value Share and BPS Analysis By Application, 2025 and 2035
  • Figure 14: Global Market Y-o-Y Growth Comparison By Application, 2025-2035
  • Figure 15: Global Market Attractiveness Analysis By Application
  • Figure 16: Global Market Value Share and BPS Analysis By End-Use Industry, 2025 and 2035
  • Figure 17: Global Market Y-o-Y Growth Comparison By End-Use Industry, 2025-2035
  • Figure 18: Global Market Attractiveness Analysis By End-Use Industry
  • Figure 19: Global Market Value (USD Billion) Share and BPS Analysis by Region, 2025 and 2035
  • Figure 20: Global Market Y-o-Y Growth Comparison by Region, 2025-2035
  • Figure 21: Global Market Attractiveness Analysis by Region
  • Figure 22: North America Market Incremental $ Opportunity, 2025-2035
  • Figure 23: Latin America Market Incremental $ Opportunity, 2025-2035
  • Figure 24: Europe Market Incremental $ Opportunity, 2025-2035
  • Figure 25: East Asia Market Incremental $ Opportunity, 2025-2035
  • Figure 26: South Asia Market Incremental $ Opportunity, 2025-2035
  • Figure 27: Oceania Market Incremental $ Opportunity, 2025-2035
  • Figure 28: MEA Market Incremental $ Opportunity, 2025-2035
  • Figure 29: North America Market Value Share and BPS Analysis by Country, 2025 and 2035
  • Figure 30: North America Market Value Share and BPS Analysis By Automation Level, 2025 and 2035
  • Figure 31: North America Market Y-o-Y Growth Comparison By Automation Level, 2025-2035
  • Figure 32: North America Market Attractiveness Analysis By Automation Level
  • Figure 33: North America Market Value Share and BPS Analysis By Conveyor Type, 2025 and 2035
  • Figure 34: North America Market Y-o-Y Growth Comparison By Conveyor Type, 2025-2035
  • Figure 35: North America Market Attractiveness Analysis By Conveyor Type
  • Figure 36: North America Market Value Share and BPS Analysis By Smart Features, 2025 and 2035
  • Figure 37: North America Market Y-o-Y Growth Comparison By Smart Features, 2025-2035
  • Figure 38: North America Market Attractiveness Analysis By Smart Features
  • Figure 39: North America Market Value Share and BPS Analysis By Application, 2025 and 2035
  • Figure 40: North America Market Y-o-Y Growth Comparison By Application, 2025-2035
  • Figure 41: North America Market Attractiveness Analysis By Application
  • Figure 42: North America Market Value Share and BPS Analysis By End-Use Industry, 2025 and 2035
  • Figure 43: North America Market Y-o-Y Growth Comparison By End-Use Industry, 2025-2035
  • Figure 44: North America Market Attractiveness Analysis By End-Use Industry
  • Figure 45: Latin America Market Value Share and BPS Analysis by Country, 2025 and 2035
  • Figure 46: Latin America Market Value Share and BPS Analysis By Automation Level, 2025 and 2035
  • Figure 47: Latin America Market Y-o-Y Growth Comparison By Automation Level, 2025-2035
  • Figure 48: Latin America Market Attractiveness Analysis By Automation Level
  • Figure 49: Latin America Market Value Share and BPS Analysis By Conveyor Type, 2025 and 2035
  • Figure 50: Latin America Market Y-o-Y Growth Comparison By Conveyor Type, 2025-2035
  • Figure 51: Latin America Market Attractiveness Analysis By Conveyor Type
  • Figure 52: Latin America Market Value Share and BPS Analysis By Smart Features, 2025 and 2035
  • Figure 53: Latin America Market Y-o-Y Growth Comparison By Smart Features, 2025-2035
  • Figure 54: Latin America Market Attractiveness Analysis By Smart Features
  • Figure 55: Latin America Market Value Share and BPS Analysis By Application, 2025 and 2035
  • Figure 56: Latin America Market Y-o-Y Growth Comparison By Application, 2025-2035
  • Figure 57: Latin America Market Attractiveness Analysis By Application
  • Figure 58: Latin America Market Value Share and BPS Analysis By End-Use Industry, 2025 and 2035
  • Figure 59: Latin America Market Y-o-Y Growth Comparison By End-Use Industry, 2025-2035
  • Figure 60: Latin America Market Attractiveness Analysis By End-Use Industry
  • Figure 61: Europe Market Value Share and BPS Analysis by Country, 2025 and 2035
  • Figure 62: Europe Market Value Share and BPS Analysis By Automation Level, 2025 and 2035
  • Figure 63: Europe Market Y-o-Y Growth Comparison By Automation Level, 2025-2035
  • Figure 64: Europe Market Attractiveness Analysis By Automation Level
  • Figure 65: Europe Market Value Share and BPS Analysis By Conveyor Type, 2025 and 2035
  • Figure 66: Europe Market Y-o-Y Growth Comparison By Conveyor Type, 2025-2035
  • Figure 67: Europe Market Attractiveness Analysis By Conveyor Type
  • Figure 68: Europe Market Value Share and BPS Analysis By Smart Features, 2025 and 2035
  • Figure 69: Europe Market Y-o-Y Growth Comparison By Smart Features, 2025-2035
  • Figure 70: Europe Market Attractiveness Analysis By Smart Features
  • Figure 71: Europe Market Value Share and BPS Analysis By Application, 2025 and 2035
  • Figure 72: Europe Market Y-o-Y Growth Comparison By Application, 2025-2035
  • Figure 73: Europe Market Attractiveness Analysis By Application
  • Figure 74: Europe Market Value Share and BPS Analysis By End-Use Industry, 2025 and 2035
  • Figure 75: Europe Market Y-o-Y Growth Comparison By End-Use Industry, 2025-2035
  • Figure 76: Europe Market Attractiveness Analysis By End-Use Industry
  • Figure 77: East Asia Market Value Share and BPS Analysis by Country, 2025 and 2035
  • Figure 78: East Asia Market Value Share and BPS Analysis By Automation Level, 2025 and 2035
  • Figure 79: East Asia Market Y-o-Y Growth Comparison By Automation Level, 2025-2035
  • Figure 80: East Asia Market Attractiveness Analysis By Automation Level
  • Figure 81: East Asia Market Value Share and BPS Analysis By Conveyor Type, 2025 and 2035
  • Figure 82: East Asia Market Y-o-Y Growth Comparison By Conveyor Type, 2025-2035
  • Figure 83: East Asia Market Attractiveness Analysis By Conveyor Type
  • Figure 84: East Asia Market Value Share and BPS Analysis By Smart Features, 2025 and 2035
  • Figure 85: East Asia Market Y-o-Y Growth Comparison By Smart Features, 2025-2035
  • Figure 86: East Asia Market Attractiveness Analysis By Smart Features
  • Figure 87: East Asia Market Value Share and BPS Analysis By Application, 2025 and 2035
  • Figure 88: East Asia Market Y-o-Y Growth Comparison By Application, 2025-2035
  • Figure 89: East Asia Market Attractiveness Analysis By Application
  • Figure 90: East Asia Market Value Share and BPS Analysis By End-Use Industry, 2025 and 2035
  • Figure 91: East Asia Market Y-o-Y Growth Comparison By End-Use Industry, 2025-2035
  • Figure 92: East Asia Market Attractiveness Analysis By End-Use Industry
  • Figure 93: South Asia Market Value Share and BPS Analysis by Country, 2025 and 2035
  • Figure 94: South Asia Market Value Share and BPS Analysis By Automation Level, 2025 and 2035
  • Figure 95: South Asia Market Y-o-Y Growth Comparison By Automation Level, 2025-2035
  • Figure 96: South Asia Market Attractiveness Analysis By Automation Level
  • Figure 97: South Asia Market Value Share and BPS Analysis By Conveyor Type, 2025 and 2035
  • Figure 98: South Asia Market Y-o-Y Growth Comparison By Conveyor Type, 2025-2035
  • Figure 99: South Asia Market Attractiveness Analysis By Conveyor Type
  • Figure 100: South Asia Market Value Share and BPS Analysis By Smart Features, 2025 and 2035
  • Figure 101: South Asia Market Y-o-Y Growth Comparison By Smart Features, 2025-2035
  • Figure 102: South Asia Market Attractiveness Analysis By Smart Features
  • Figure 103: South Asia Market Value Share and BPS Analysis By Application, 2025 and 2035
  • Figure 104: South Asia Market Y-o-Y Growth Comparison By Application, 2025-2035
  • Figure 105: South Asia Market Attractiveness Analysis By Application
  • Figure 106: South Asia Market Value Share and BPS Analysis By End-Use Industry, 2025 and 2035
  • Figure 107: South Asia Market Y-o-Y Growth Comparison By End-Use Industry, 2025-2035
  • Figure 108: South Asia Market Attractiveness Analysis By End-Use Industry
  • Figure 109: Oceania Market Value Share and BPS Analysis by Country, 2025 and 2035
  • Figure 110: Oceania Market Value Share and BPS Analysis By Automation Level, 2025 and 2035
  • Figure 111: Oceania Market Y-o-Y Growth Comparison By Automation Level, 2025-2035
  • Figure 112: Oceania Market Attractiveness Analysis By Automation Level
  • Figure 113: Oceania Market Value Share and BPS Analysis By Conveyor Type, 2025 and 2035
  • Figure 114: Oceania Market Y-o-Y Growth Comparison By Conveyor Type, 2025-2035
  • Figure 115: Oceania Market Attractiveness Analysis By Conveyor Type
  • Figure 116: Oceania Market Value Share and BPS Analysis By Smart Features, 2025 and 2035
  • Figure 117: Oceania Market Y-o-Y Growth Comparison By Smart Features, 2025-2035
  • Figure 118: Oceania Market Attractiveness Analysis By Smart Features
  • Figure 119: Oceania Market Value Share and BPS Analysis By Application, 2025 and 2035
  • Figure 120: Oceania Market Y-o-Y Growth Comparison By Application, 2025-2035
  • Figure 121: Oceania Market Attractiveness Analysis By Application
  • Figure 122: Oceania Market Value Share and BPS Analysis By End-Use Industry, 2025 and 2035
  • Figure 123: Oceania Market Y-o-Y Growth Comparison By End-Use Industry, 2025-2035
  • Figure 124: Oceania Market Attractiveness Analysis By End-Use Industry
  • Figure 125: MEA Market Value Share and BPS Analysis by Country, 2025 and 2035
  • Figure 126: MEA Market Value Share and BPS Analysis By Automation Level, 2025 and 2035
  • Figure 127: MEA Market Y-o-Y Growth Comparison By Automation Level, 2025-2035
  • Figure 128: MEA Market Attractiveness Analysis By Automation Level
  • Figure 129: MEA Market Value Share and BPS Analysis By Conveyor Type, 2025 and 2035
  • Figure 130: MEA Market Y-o-Y Growth Comparison By Conveyor Type, 2025-2035
  • Figure 131: MEA Market Attractiveness Analysis By Conveyor Type
  • Figure 132: MEA Market Value Share and BPS Analysis By Smart Features, 2025 and 2035
  • Figure 133: MEA Market Y-o-Y Growth Comparison By Smart Features, 2025-2035
  • Figure 134: MEA Market Attractiveness Analysis By Smart Features
  • Figure 135: MEA Market Value Share and BPS Analysis By Application, 2025 and 2035
  • Figure 136: MEA Market Y-o-Y Growth Comparison By Application, 2025-2035
  • Figure 137: MEA Market Attractiveness Analysis By Application
  • Figure 138: MEA Market Value Share and BPS Analysis By End-Use Industry, 2025 and 2035
  • Figure 139: MEA Market Y-o-Y Growth Comparison By End-Use Industry, 2025-2035
  • Figure 140: MEA Market Attractiveness Analysis By End-Use Industry
  • Figure 141: Global Market - Tier Structure Analysis
  • Figure 142: Global Market - Company Share Analysis

Frequently Asked Questions

How big is the smart conveyor packaging systems market in 2025?

The global smart conveyor packaging systems market is estimated to be valued at USD 7.5 billion in 2025.

What will be the size of the smart conveyor packaging systems market in 2035?

The market size for the smart conveyor packaging systems market is projected to reach USD 15.5 billion by 2035.

How much will be the smart conveyor packaging systems market growth between 2025 and 2035?

The smart conveyor packaging systems market is expected to grow at a CAGR of 7.5% between 2025 and 2035.

What are the key automation levels in the smart conveyor packaging systems market?

The key automation levels in the smart conveyor packaging systems market include semi-automated, fully automated, and AI-integrated systems.

Which automation level segment is expected to contribute significant share in the smart conveyor packaging systems market in 2025?

The fully automated systems segment is expected to account for the highest share of 46.2% in the smart conveyor packaging systems market in 2025.

Explore Similar Insights

Future Market Insights

Smart Conveyor Packaging System Market