Smart Seed Coatings Market Size and Share Forecast Outlook 2025 to 2035

The Smart Seed Coatings Market is expected to record a valuation of USD 2,936.4 million in 2025 and reach USD 5,722.6 million in 2035, reflecting a CAGR of 6.9%. From 2025-2030, incremental growth of around USD 1.1 billion is anticipated, driven by large-scale adoption of polymer-based smart coatings in cereals and oilseeds, alongside demand for pest and disease resistance coatings.
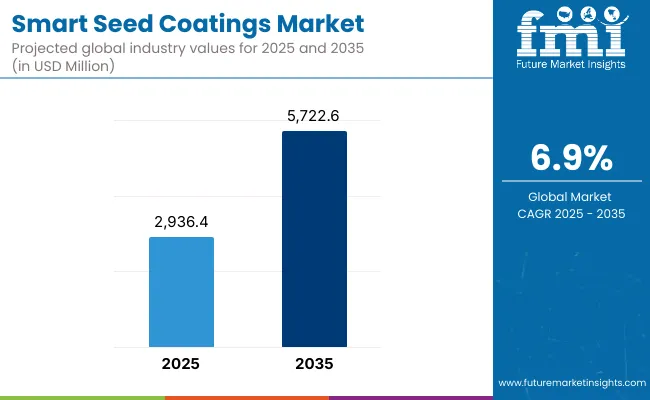
Quick Stats for Smart Seed Coatings Market

  • Market Value (2025): USD 2,936.4 Million
  • Market Forecast Value (2035): USD 5,722.6 Million
  • Market Forecast CAGR (2025 to 2035): 6.9%
  • Leading Segment in 2025: Polymer-Based Smart Coatings (42.0% share)
  • Leading Functionality in 2025: Germination Enhancement (34.0% share)
  • Key Growth Regions: India (10.2% CAGR), China (9.4% CAGR), South Asia & Pacific (9.2% CAGR), East Asia (8.6% CAGR)
  • Top Key Players: BASF SE, Bayer CropScience AG, Syngenta AG (Incotec Group), Clariant, Croda International, Germains Seed Technology, BrettYoung, DuPont, FMC, Nufarm

Smart Seed Coatings Market

Smart Seed Coatings Market Key Takeaways

Metric Value
Market Estimated Value In (2025E) USD 2,936.4 Million
Market Forecast Value In (2035f) USD 5,722.6 Million
Forecast CAGR (2025 to 2035) 6.9%

The second half of the decade, 2030-2035, is projected to add nearly USD 1.6 billion, fueled by rapid uptake of nanomaterial-enhanced and biopolymer-based coatings, as well as strong expansion of sensor-integrated solutions that offer real-time responsiveness in stress conditions. Functionalities like stress tolerance and nutrient/smart release will rise in importance as agriculture adapts to climate variability, while microencapsulation and controlled-release polymers enhance precision and efficiency.

Regionally, East Asia and South Asia & Pacific will drive momentum with CAGRs above 8%, supported by hybrid seed penetration, mechanization, and climate resilience programs. Mature regions like Europe and North America are expected to emphasize regulatory alignment, precision farming, and traceability, ensuring steady uptake of premium coatings. Distribution models will evolve as direct sales dominate, while online platforms, though smaller in base, expand fastest with a CAGR above 10%.

Between 2020 and 2024, smart seed coatings adoption advanced steadily, supported by demand for multi-functional inputs and sustainable farming practices. In 2025, the market is valued at USD 2,936.4 million, driven by polymer-based coatings and functionalities like germination enhancement and pest resistance. By 2035, it is forecast to reach USD 5,722.6 million, expanding at a 6.9% CAGR, with nanomaterial-enhanced, biopolymer-based, and sensor-integrated solutions redefining performance benchmarks. Growth momentum is expected to shift toward Asia-Pacific, where India and China are scaling hybrid seeds, stress-tolerance applications, and climate-resilient agriculture. Competitive advantage will increasingly depend on stack integration, traceability, and the alignment of smart coatings with digital agronomy and ESG-focused supply chains.

Why the Smart Seed Coatings Market is Growing ?

Growth in the Smart Seed Coatings Market is being driven by technological innovation, sustainability imperatives, and the need for climate-resilient agriculture. Farmers and seed producers are increasingly adopting coatings that go beyond protection to deliver multi-functional benefits such as enhanced germination, nutrient delivery, pest resistance, and stress tolerance. The integration of nanotechnology, bio-based polymers, and sensor-enabled coatings enables precise, responsive solutions that align with modern farming practices.

Rising adoption of hybrid and high-value seeds further supports premium coatings, as ensuring uniform emergence and higher yields becomes critical to farm economics. Regulatory encouragement for environmentally friendly inputs is also spurring demand for biodegradable and biopolymer-based coatings, reducing reliance on synthetic alternatives. Meanwhile, digital agriculture platforms are making smart coatings more accessible, enabling advisory-driven purchases and adoption by mid-size and smallholder farmers. Collectively, these dynamics reinforce smart seed coatings as a cornerstone of next-generation, sustainable crop production systems.

Segmental Overview

The Smart Seed Coatings Market is segmented by type, functionality, crop type, technology, end user, distribution, and region, each contributing unique adoption drivers. By type, polymer-based smart coatings dominate large-scale applications, while nanomaterial-enhanced coatings and biopolymer formats grow fastest with double-digit expansion, supported by sustainability and performance advantages. Functionality is anchored in germination enhancement and pest resistance, but stress tolerance is projected to grow quickly due to climate pressures.

Crop segmentation highlights cereals and grains as the largest category, with fruits and vegetables advancing rapidly as high-value crops demand precision coatings. On the technology front, microencapsulation and controlled-release polymers ensure efficient dosing, while nano-coatings and sensor-integrated formats position the market for innovation-led growth. Commercial farmers and seed processors remain dominant end users, supported by direct sales contracts, while online platforms provide the fastest-growing distribution channel.
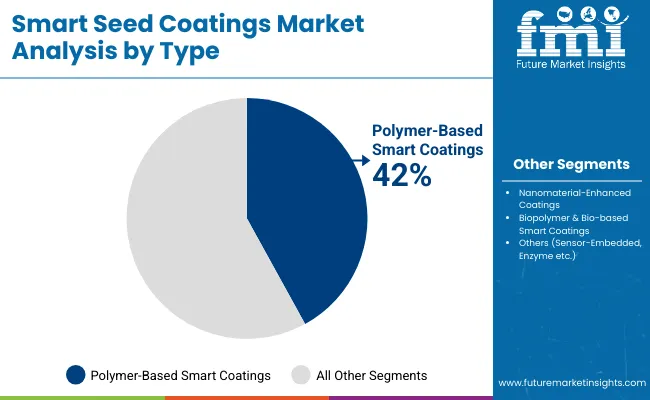
Polymer-Based Coatings Anchor the Type Segment

Smart Seed Coatings Market By Type

Type Market Value Share, 2025
Polymer-Based Smart Coatings 42.00%
Others 58.00%

Polymer-based smart coatings are projected to dominate the type segment in 2025, accounting for 42% of global share. Their leadership stems from strong film-forming ability, cost efficiency, and ease of integration with conventional seed treatment equipment. These coatings are widely used for cereals and oilseeds, where large-scale seed volumes demand durable and uniform coverage. Nanomaterial-enhanced coatings, though smaller at present, are expected to grow at the fastest pace (10.5% CAGR) due to their ability to improve seed-to-soil interaction, enhance water retention, and provide targeted stress resilience.

Biopolymer and bio-based coatings are also advancing as sustainable alternatives, particularly in markets where regulatory frameworks discourage synthetic additives. Sensor-embedded and enzyme-aided coatings remain in the early adoption phase but represent the most disruptive innovations, offering real-time responsiveness and traceability. Together, these categories underscore a shift from traditional protective coatings toward multi-functional, performance-driven solutions.
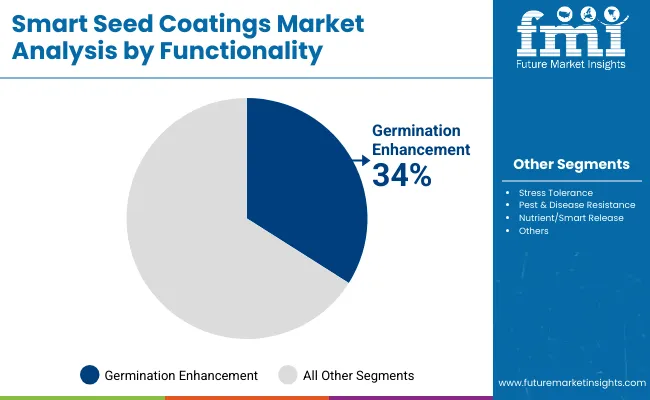
Germination Enhancement Leads the Functionality Segment

Smart Seed Coatings Market By Functionality

Functionality Market Value Share, 2025
Germination Enhancement 34.00%
Others 66.00%

The functionality segment is anchored by germination enhancement, which captured 34% of global share in 2025. Farmers and seed companies rely heavily on these coatings to ensure uniform stand establishment, seed vigor, and improved yield stability. Germination enhancement coatings are designed to deliver micronutrients, regulate water uptake, and optimize early-stage root development, making them essential for both high-volume crops and high-value horticulture.

Pest and disease resistance coatings, accounting for 28%, are also widely adopted, particularly in regions with high pathogen pressure, while stress tolerance coatings (26%) are growing rapidly at a 9.3% CAGR, reflecting rising climate risks. Nutrient and smart release coatings, though smaller in share at 12%, are emerging as high-growth innovations with advanced controlled-release mechanisms. This distribution highlights how smart coatings are being tailored not only to protect seeds but also to enhance plant performance under variable conditions.
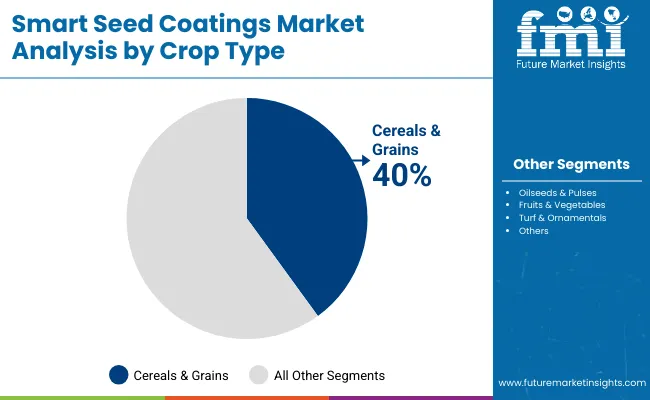
Cereals and Grains Dominate the Crop Type Segment

Smart Seed Coatings Market By Crop

Crop Type Market Value Share, 2025
Cereals & Grains 40.00%
Others 60.00%

Cereals and grains are the largest crop type segment, representing 40% of the market in 2025. Their dominance is attributed to vast global acreage, mechanized seed treatment infrastructure, and the importance of reliable stand establishment for staple crops such as wheat, rice, maize, and barley. Farmers prioritize smart coatings for cereals to ensure uniform germination, seedling vigor, and resilience under stress. Oilseeds and pulses, with 24% share, follow strongly, driven by soybean and canola adoption in North and South America.

Fruits and vegetables, accounting for 22%, are forecast to be the fastest-growing segment at a 9.7% CAGR, reflecting premium seed value and the demand for enhanced emergence uniformity. Turf and ornamentals represent niche markets but benefit from precision-coated seeds used in landscaping and protected environments. This segmentation illustrates cereals’ central role in anchoring volume while fruits and vegetables drive innovation-led demand.
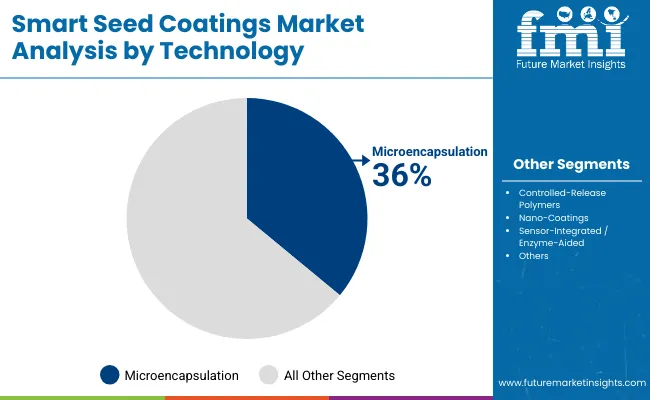
Microencapsulation Strengthens the Technology Segment

Smart Seed Coatings Market By Technology

Technology Market Value Share, 2025
Microencapsulation 36.00%
Others 64.00%

The technology segment is led by microencapsulation, which accounts for 36% of share in 2025. Its success is driven by the ability to encapsulate active ingredients in controlled layers, ensuring uniform release and seed safety. Microencapsulation is widely adopted across cereals, oilseeds, and vegetables for its precision, compatibility with multiple actives, and cost-effectiveness. Controlled-release polymers, holding 28% share, are also critical as they regulate nutrient delivery and reduce input losses, supporting sustainable farming practices.

Nano-coatings are projected to record the highest CAGR (10.7%), offering enhanced stress tolerance and seed-to-soil interaction through nanoscale material engineering. Sensor-integrated and enzyme-aided coatings, with 16% share, represent the frontier of innovation, enabling smart responsiveness to soil conditions, moisture, and microbial activity. This segment reflects how smart coatings are evolving from passive barriers to intelligent delivery systems.
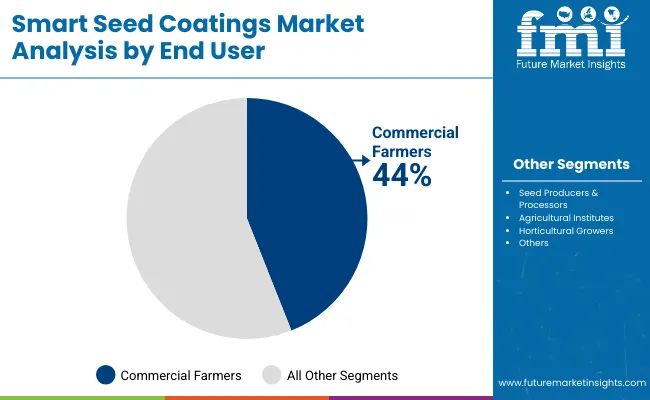
Commercial Farmers Drive the End User Segment

Smart Seed Coatings Market By End User

End User Market Value Share, 2025
Commercial Farmers 44.0%
Others 56.0%

Commercial farmers dominate the end user segment with 44% share in 2025. Their leadership is supported by large-scale adoption of smart coatings to maximize returns through yield stability and resilience against stress. These users value coatings that combine germination enhancement, disease resistance, and nutrient delivery, ensuring reliable performance in large fields.

Seed producers and processors, with 28% share, are key enablers of adoption as they integrate smart coatings into treated seed lots, setting new standards for uniformity and quality. Horticultural growers, though smaller at 16%, are expanding fastest with a 9.1% CAGR, driven by demand for premium formulations in high-value fruits and vegetables. Agricultural institutes contribute modestly at 12%, primarily supporting R&D and field validation. This distribution highlights commercial farmers’ role in driving volume and horticultural growers’ role in driving innovation.

What are the Drivers, Restraints, and Key Trends of the Smart Seed Coatings Market?

Driver Multi-functionality and precision delivery accelerate adoption

The adoption of smart seed coatings is being propelled by their ability to deliver multiple functionalities beyond traditional protection. Farmers increasingly demand coatings that not only safeguard against pathogens but also enhance germination, regulate nutrient release, and improve stress tolerance under adverse conditions. Polymer-based smart coatings dominate bulk crops for their durability, while nanomaterial-enhanced formats are emerging as high-growth solutions due to superior water retention and targeted root zone delivery.

Biopolymer-based coatings further strengthen the sustainability profile, aligning with green agricultural policies. Controlled-release polymers and microencapsulation technologies ensure efficient utilization of nutrients and biologicals, reducing wastage and supporting cost efficiency. This combination of protection, performance, and sustainability is positioning smart coatings as indispensable in modern agriculture, particularly in hybrid seeds and high-value horticultural crops.

Restraint High costs and validation hurdles challenge widespread uptake

Despite strong innovation, the cost of smart seed coatings remains a significant barrier to adoption, especially for smallholder farmers in emerging markets. Nanomaterials, enzyme-aided coatings, and sensor-integrated formats carry higher production expenses due to advanced raw materials and specialized equipment requirements. While biopolymer-based coatings provide sustainability advantages, their sourcing and processing often increase price points compared to conventional coatings.

Regulatory approval and validation cycles also remain lengthy, as smart coatings must demonstrate consistent field performance, safety, and compatibility with existing seed treatment systems. These processes can delay commercialization and limit adoption to premium crop sectors. For large-volume crops like cereals and pulses, farmers are highly price-sensitive, making cost a key restraint. Unless manufacturing scale and technology optimization reduce input costs, broader penetration will remain constrained to high-value or contract-driven agriculture.

Trend Climate resilience and digital agriculture reshape the market

Smart seed coatings are evolving into a critical tool for climate-resilient farming. Rising occurrences of drought, salinity, and extreme temperatures are driving demand for coatings that enhance stress tolerance and seedling vigor under adverse conditions. Nano-coatings and biopolymer-based solutions are being engineered to regulate water uptake, improve root architecture, and boost resistance against abiotic stress.

At the same time, sensor-integrated coatings and enzyme-aided technologies are creating opportunities for responsive solutions that interact with soil and environmental conditions in real time. Digital agriculture platforms are further amplifying this trend by linking seed coating data with precision farming systems, enabling farmers to track performance and optimize input use. This integration of smart coatings with data-driven farming and sustainability imperatives is reshaping market adoption patterns, particularly in Asia-Pacific and Europe.
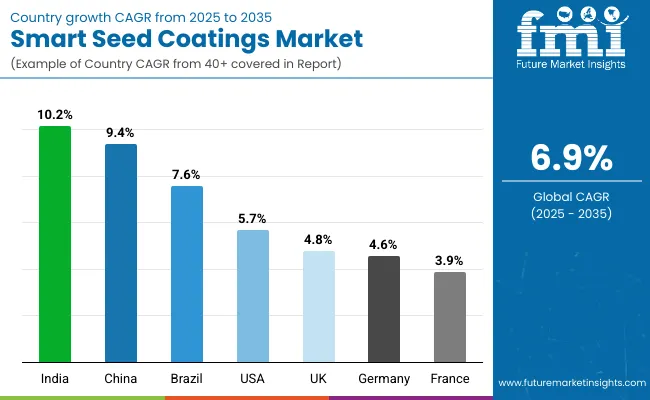
Analysis of Smart Seed Coatings Market By Key Countries

Smart Seed Coatings Market By Country

Countries CAGR (2025 to 2035)
China 9.4%
India 10.2%
Germany 4.6%
France 3.9%
UK 4.8%
USA 5.7%
Brazil 7.6%

Adoption of smart seed coatings is advancing at varied rates across regions, shaped by seed technology infrastructure, sustainability imperatives, and climate resilience needs. In Asia-Pacific, rapid growth is being recorded as hybrid seed penetration, mechanization, and agri-tech investments accelerate demand for coatings that enhance stress tolerance and germination. India, with a forecast CAGR of 10.2%, and China, at 9.4%, emerge as the fastest-expanding markets, supported by climate variability policies, government-backed seed modernization, and rising private investment.

In North America, the United States retains leadership, holding a 20% share in 2025, though this is projected to ease to 18% by 2035 as Asia gains ground. Growth in the USA, at 5.7% CAGR, remains anchored in commercial seed treaters, stacked functionalities, and strong uptake of microencapsulation and controlled-release polymers.

Europe demonstrates steady but compliance-driven growth. Germany and France, with projected CAGRs of 4.6% and 3.9% respectively, emphasize sustainability compliance, traceability, and dust-control performance, while the UK, at 4.8% CAGR, is advancing through horticulture specialization and advisory-led adoption.

Latin America and the Middle East & Africa showcase emerging opportunities, led by Brazil at 7.6% CAGR, where soybean and maize acreage underpin adoption and stress-tolerance coatings are gaining momentum under variable rainfall conditions.
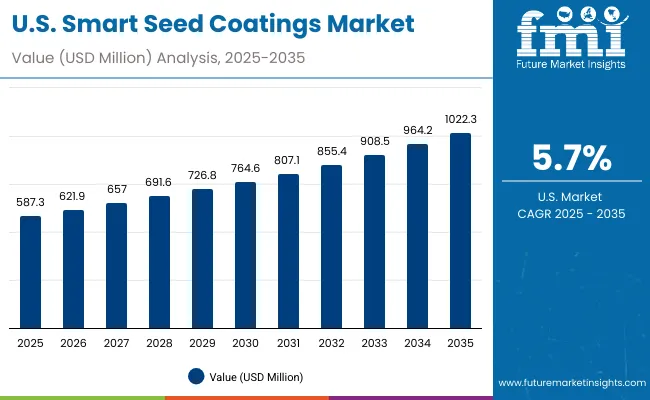
Sales Outlook for Smart Seed Coatings in the United States

Smart Seed Coatings Market Usa

Year USA Smart Seed Coatings Market (USD Million)
2025 587.3
2026 621.9
2027 657.0
2028 691.6
2029 726.8
2030 764.6
2031 807.1
2032 855.4
2033 908.5
2034 964.2
2035 1,022.3

The United States is projected to retain a leading role in the smart seed coatings market, though its share is expected to moderate from 20% in 2025 to 18% by 2035. Growth at a 5.7% CAGR will be supported by strong uptake of polymer-based coatings and controlled-release polymers across cereals, maize, and soybean crops. Commercial seed processors are likely to emphasize microencapsulation for uniformity, planter safety, and regulatory compliance. Pest and disease resistance will remain the most common functionality, while germination enhancement will be critical for maintaining yield stability. Stress-tolerance and nutrient-release functionalities are expected to gain traction in drought-prone areas, particularly in the Midwest. Direct B2B contracts will dominate, while digital sales platforms grow gradually for mid-sized farms.

  • Market share reduces as Asia gains strength.
  • Microencapsulation remains core to specifications.
  • Stress-tolerance coatings adopted selectively.
  • Digital platforms expand advisory-led adoption.

China: Hybrid seeds, mechanization, and climate resilience accelerate adoption

China is anticipated to expand rapidly, increasing its market share from 15% in 2025 to 20% by 2035, at a robust 9.4% CAGR. Hybrid seed penetration, government-backed modernization, and mechanized farming are projected to underpin demand. Polymer-based coatings will dominate cereals and maize, while nano-coatings and sensor-enabled coatings are expected to accelerate in high-stress provinces. Germination enhancement will remain a priority, while stress-tolerance coatings rise due to frequent drought and salinity issues. Provincial extension services and OEM calibration programs will raise coating consistency. Online platforms are projected to enhance reach among smallholder farmers in horticulture. China is expected to position itself as a hub for nano-enabled and bio-based smart coatings, reshaping global competition.

  • Market share climbs significantly by 2035.
  • Nano-coatings scale in stress-exposed zones.
  • Extension and OEM training expand quality.
  • E-commerce enables horticulture penetration.

India: Stress-tolerance and hybridization fuel the fastest expansion

India is expected to be the fastest-growing national market, rising from 9% in 2025 to 12% in 2035 at a 10.2% CAGR. Rapid hybrid seed adoption, mechanization, and government focus on climate resilience are projected to drive demand. Stress-tolerance coatings are forecast to lead functional expansion due to salinity and drought across several agro-climatic zones. Germination enhancement and pest resistance will sustain core demand in cereals and pulses.

Organized seed processors are expected to integrate microencapsulation and controlled-release polymers to standardize treated seed performance. Nanomaterial-enhanced coatings will gain popularity in horticulture and spices, where high returns justify investment. Direct B2B contracts will dominate distribution, while agri-ecommerce platforms expand among mid-sized growers with advisory-driven bundles.

  • Highest CAGR among key markets.
  • Stress-tolerance dominates growth trajectory.
  • Encapsulation standardizes seed lot quality.
  • Agri-ecommerce scales across mid-tier farmers.

Germany: Regulatory rigor anchors compliance-driven growth

Germany is expected to expand at a 4.6% CAGR, with its market share easing slightly from 7% in 2025 to 6% in 2035. Adoption will remain compliance-driven, with seed processors emphasizing dust minimization, planter hygiene, and sustainable sourcing. Microencapsulation and controlled-release polymers will dominate specifications for cereals, oilseeds, and sugar beet, ensuring uniformity under cool-wet sowing conditions. Pest and disease resistance coatings will remain the largest functionality, though nutrient delivery formats are expected to rise gradually. Traceability and lifecycle analysis will drive trials of bio-based smart coatings among export-oriented seed producers. Direct B2B agreements will anchor supply, while regional distributors address smaller grower groups.

  • Market share moderates as Asia grows faster.
  • Dust-control performance drives choices.
  • Bio-based coatings gain visibility.
  • Seed processors set higher QA benchmarks.

United Kingdom: Horticultural specialization and compliance sustain demand

The UK market is projected to expand at a 4.8% CAGR, with its share declining from 5% in 2025 to 4% by 2035. Growth will remain tied to high-value horticulture and specialty seeds, where germination enhancement and stress-tolerance functionalities are increasingly sought. Controlled-release polymers and encapsulation will dominate technology use, ensuring precision and compliance with environmental regulations. Private-label treated seeds and contract-treated lots will drive distribution, supported by distributors providing local coverage. Direct B2B and subscription-led channels will expand among small and mid-sized farms, particularly those investing in premium horticulture. Traceability requirements and sustainability mandates are expected to push adoption of biopolymer-based and nano-enabled coatings over the forecast horizon.

  • Market share edges lower as Asia expands.
  • Controlled-release technologies dominate.
  • Horticulture drives innovation-led demand.
  • Subscription-based distribution grows.

France: Compliance-led adoption sustains moderate growth

France is projected to grow at a 3.9% CAGR, with adoption concentrated in cereals, oilseeds, and vegetables. Pest and disease resistance will remain the most widely applied functionality, while stress-tolerance coatings are likely to gain in drought-prone southern regions. Nutrient-release coatings are expected to see selective uptake in vegetable and horticultural systems. Regulatory emphasis on sustainability and reduced synthetic input use will accelerate adoption of biopolymer-based coatings. Direct sales will dominate, complemented by distributors serving fragmented farming groups. France will remain an important but secondary player in Europe, influenced heavily by EU-wide compliance policies.

  • Market share remains steady in EU context.
  • Pest resistance dominates applications.
  • Stress-tolerance grows in dry zones.
  • Biopolymer adoption accelerates with policy.

Brazil: Scale in soybean and maize drives robust expansion

Brazil is expected to grow strongly at a 7.6% CAGR, underpinned by vast soybean and maize acreage. Polymer-based coatings and microencapsulation are projected to dominate bulk applications, ensuring planter hygiene and stand uniformity. Stress-tolerance coatings will expand in the Cerrado and semi-arid regions, where irregular rainfall creates challenges. Germination enhancement remains vital for tropical cropping systems, while pest resistance sustains core demand. Distributors dominate coverage across farming belts, though direct contracts with large farm groups are expanding. Online sales channels are emerging in specialty horticulture, offering nutrient-release coatings and advisory bundles. Brazil’s agricultural scale ensures it will remain a key high-growth market over the next decade.
  • Strong growth driven by cereals and soybeans.
  • Stress-tolerance expands in semi-arid zones.
  • Distributors dominate channel mix.
  • Online sales scale in horticulture.

Japan: Precision horticulture and technology integration drive premium adoption

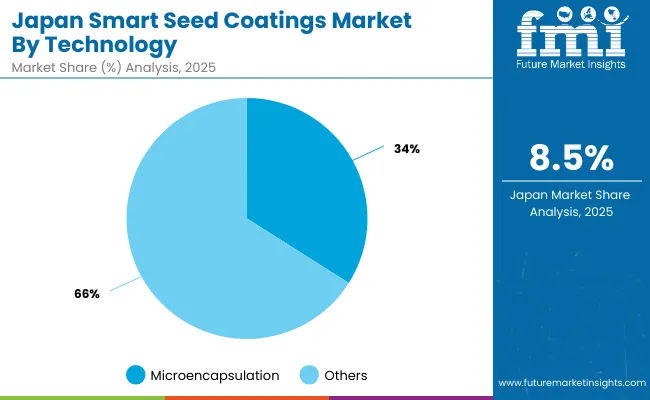
Smart Seed Coatings Market Japan

Sub-Segment Share (2025)
Microencapsulation 34%
Others 66%

Japan is forecast to increase its market share modestly from 7% in 2025 to 8% in 2035, with demand concentrated in greenhouse and export-oriented horticulture. Growth will be supported by microencapsulation, which dominates with 34% share in 2025, providing uniform release and compatibility with inoculants. Controlled-release polymers, with an 8.5% CAGR, will rise in premium vegetables, while nano-coatings and sensor-integrated formats will expand faster with pilot projects. Traceability and clean-label standards will encourage adoption of bio-based inputs in export lots. Specialized distributors and processors offering advisory and calibration support will remain central to adoption.
  • Market share edges up by 2035.
  • Microencapsulation anchors seed treatments.
  • Sensor-enabled coatings scale gradually.
  • Premium horticulture drives demand.

South Korea: Sustainability narratives and greenhouse farming boost growth

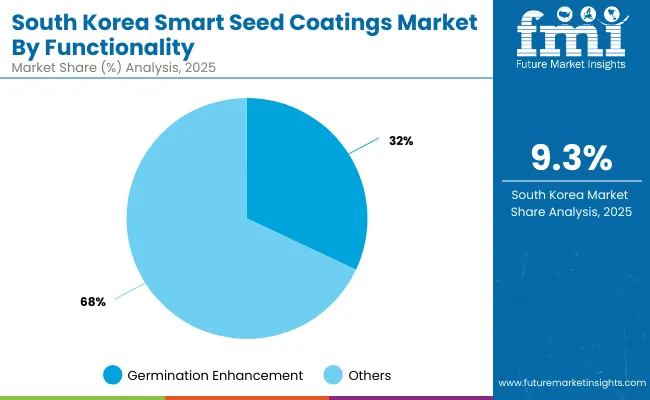
Smart Seed Coatings Market South Korea

Sub-Segment Share (2025)
Germination Enhancement 32%
Others 68%

South Korea is expected to maintain a stable global share, with growth supported by greenhouse farming, horticulture, and ESG-driven sourcing. Germination enhancement dominates with 32% share in 2025, while stress-tolerance coatings expand rapidly at a 9.3% CAGR. Nutrient/smart release coatings, though smaller, are projected to grow fastest at 10.5% CAGR, supporting fertigation and climate-controlled cultivation. Pest resistance will remain foundational in cereals and maize, while horticultural growers increasingly trial premium bio-based recipes. Digital advisory services and agri-ecommerce will enhance access, enabling broader adoption among mid-sized farms. South Korea is expected to emerge as an innovation-led market for fermentation-compatible and traceable coating solutions.
  • Market share remains stable over the decade.
  • Germination enhancement leads in 2025.
  • Nutrient-release coatings grow fastest.
  • ESG commitments drive sourcing preferences.

Competitive Landscape of the Smart Seed Coatings Market

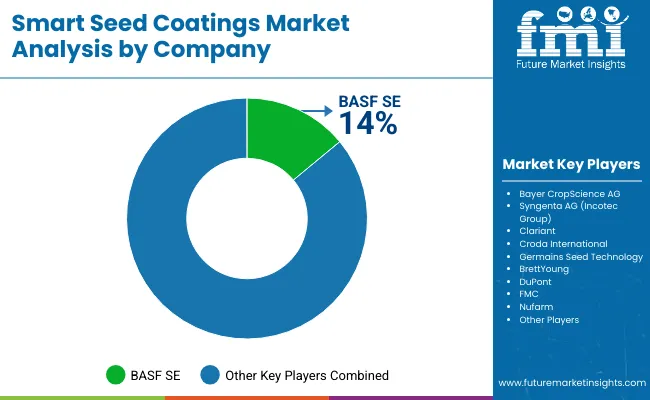
Smart Seed Coatings Market By Company

The competitive landscape of the Smart Seed Coatings Market is shaped by a mix of global agrochemical leaders, specialized seed technology providers, and regional innovators. BASF SE is assessed as the leading player with a 14% global value share in 2025, owing to its broad portfolio of polymer-based and controlled-release technologies integrated into commercial seed treatment platforms. Bayer CropScience AG and Syngenta AG (via Incotec Group) are positioned strongly in germination enhancement and pest resistance coatings, supported by proprietary encapsulation and nano-formulation platforms.

Clariant and Croda International are expanding their bio-based and specialty polymer segments, focusing on compliance-driven European markets. Niche players like Germains Seed Technology and BrettYoung concentrate on horticulture and high-value crops, delivering tailored solutions. In emerging markets, especially in Asia-Pacific, regional innovators are gaining traction with nanomaterial-enhanced and bio-based coatings suited for stress tolerance and nutrient release applications.

Competitive differentiation is expected to shift toward companies that can integrate multi-functional stacks, ensure traceability, and align with sustainability mandates. Over the forecast horizon, digital agronomy tie-ins, partnerships with seed producers, and the ability to scale controlled-release and sensor-integrated technologies are anticipated to define leadership in the smart seed coatings industry.

Key Developments in Smart Seed Coatings Market

  • March 2025 BASF launches nano-enabled stress-tolerance coatings BASF introduced a new smart seed coating platform utilizing nanomaterials to enhance drought and salinity tolerance in cereals and oilseeds. The technology integrates controlled-release polymers with nanoscale carriers, ensuring precise water regulation and nutrient delivery under variable climate conditions.
  • February 2025 Syngenta expands Incotec smart-release portfolioSyngenta’s Incotec Group announced the expansion of its smart-release coating line in Asia, integrating biopolymer-based carriers with microbial inoculants. The launch targets hybrid rice and vegetable seeds, improving germination, pest resistance, and traceability for smallholder and commercial farmers, particularly in China and India.

Scope of the Report

Item Details
Market Size, 2025 USD 2,936.4 Million
Market Size, 2035 USD 5,722.6 Million
Absolute Growth (2025-2035) USD 2,786.2 Million
CAGR (2025-2035) 6.90%
Value Added 2025-2030 ~USD 1.1 Billion
Value Added 2030-2035 ~USD 1.6 Billion
Type (2025) Polymer-Based Smart Coatings lead (42% share)
Functionality (2025) Germination Enhancement leads (34% share)
Crop Type (2025) Cereals & Grains lead (40% share)
Technology (2025) Microencapsulation leads (36% share)
End User (2025) Commercial Farmers lead (44% share)
Distribution Channel (2025) Direct Sales lead (60% share)
Key Growth Regions (CAGR) India (10.2%), China (9.4%), South Asia & Pacific (9.2%), East Asia (8.6%)
Regions Covered North America, Latin America, Europe, East Asia, South Asia & Pacific, Middle East & Africa
Countries Covered USA, UK, Germany, France, China, India, Japan, South Korea, Brazil
Key Companies Profiled BASF SE, Bayer CropScience AG, Syngenta AG (Incotec Group), Clariant, Croda International, Germains Seed Technology, BrettYoung, DuPont, FMC, Nufarm
Additional Attributes Multi-functional stacks; nano -enabled stress tolerance; bio-based polymers; sensor-integrated coatings; digital agronomy tie-ins; sustainability and traceability compliance

Key Segments

By Type:

  • Polymer-Based Smart Coatings
  • Nanomaterial-Enhanced Coatings
  • Biopolymer & Bio-based Smart Coatings
  • Others (Sensor-Embedded, Enzyme etc.)

By Functionality:

  • Germination Enhancement
  • Stress Tolerance
  • Pest & Disease Resistance
  • Nutrient/Smart Release

By Crop Type:

  • Cereals & Grains
  • Oilseeds & Pulses
  • Fruits & Vegetables
  • Turf & Ornamentals
  • Others

By Technology:

  • Microencapsulation
  • Controlled-Release Polymers
  • Nano-Coatings
  • Sensor-Integrated / Enzyme-Aided

By End User:

  • Commercial Farmers
  • Seed Producers & Processors
  • Agricultural Institutes
  • Horticultural Growers

By Distribution:

  • Direct Sales
  • Distributors & Retailers
  • Online Platforms

By Region:

  • North America
  • Latin America
  • Europe
  • East Asia
  • South Asia & Pacific
  • Middle East and Africa

Table of Content

  1. Executive Summary
    • Global Market Outlook
    • Demand-side Trends
    • Supply-side Trends
    • Technology Roadmap Analysis
    • Analysis and Recommendations
  2. Market Overview
    • Market Coverage / Taxonomy
    • Market Definition / Scope / Limitations
  3. Market Background
    • Market Dynamics
      • Drivers
      • Restraints
      • Opportunity
      • Trends
    • Scenario Forecast
      • Demand in Optimistic Scenario
      • Demand in Likely Scenario
      • Demand in Conservative Scenario
    • Opportunity Map Analysis
    • Product Life Cycle Analysis
    • Supply Chain Analysis
    • Investment Feasibility Matrix
    • Value Chain Analysis
    • PESTLE and Porter’s Analysis
    • Regulatory Landscape
    • Regional Parent Market Outlook
    • Production and Consumption Statistics
    • Import and Export Statistics
  4. Global Market Analysis 2020 to 2024 and Forecast, 2025 to 2035
    • Historical Market Size Value (USD Million) & Volume (MT) Analysis, 2020 to 2024
    • Current and Future Market Size Value (USD Million) & Volume (MT) Projections, 2025 to 2035
      • Y-o-Y Growth Trend Analysis
      • Absolute $ Opportunity Analysis
  5. Global Market Pricing Analysis 2020 to 2024 and Forecast 2025 to 2035
  6. Global Market Analysis 2020 to 2024 and Forecast 2025 to 2035, By Type
    • Introduction / Key Findings
    • Historical Market Size Value (USD Million) & Volume (MT) Analysis By Type, 2020 to 2024
    • Current and Future Market Size Value (USD Million) & Volume (MT) Analysis and Forecast By Type, 2025 to 2035
      • Polymer-Based Smart Coatings
      • Nanomaterial-Enhanced Coatings
      • Biopolymer & Bio-based Smart Coatings
      • Others (Sensor-Embedded, Enzyme etc.)
    • Y-o-Y Growth Trend Analysis By Type, 2020 to 2024
    • Absolute $ Opportunity Analysis By Type, 2025 to 2035
  7. Global Market Analysis 2020 to 2024 and Forecast 2025 to 2035, By Functionality
    • Introduction / Key Findings
    • Historical Market Size Value (USD Million) & Volume (MT) Analysis By Functionality, 2020 to 2024
    • Current and Future Market Size Value (USD Million) & Volume (MT) Analysis and Forecast By Functionality, 2025 to 2035
      • Germination Enhancement
      • Stress Tolerance
      • Pest & Disease Resistance
      • Nutrient/Smart Release
    • Y-o-Y Growth Trend Analysis By Functionality, 2020 to 2024
    • Absolute $ Opportunity Analysis By Functionality, 2025 to 2035
  8. Global Market Analysis 2020 to 2024 and Forecast 2025 to 2035, By Crop Type
    • Introduction / Key Findings
    • Historical Market Size Value (USD Million) & Volume (MT) Analysis By Crop Type, 2020 to 2024
    • Current and Future Market Size Value (USD Million) & Volume (MT) Analysis and Forecast By Crop Type, 2025 to 2035
      • Cereals & Grains
      • Oilseeds & Pulses
      • Fruits & Vegetables
      • Turf & Ornamentals
      • Others
    • Y-o-Y Growth Trend Analysis By Crop Type, 2020 to 2024
    • Absolute $ Opportunity Analysis By Crop Type, 2025 to 2035
  9. Global Market Analysis 2020 to 2024 and Forecast 2025 to 2035, By Technology
    • Introduction / Key Findings
    • Historical Market Size Value (USD Million) & Volume (MT) Analysis By Technology, 2020 to 2024
    • Current and Future Market Size Value (USD Million) & Volume (MT) Analysis and Forecast By Technology, 2025 to 2035
      • Microencapsulation
      • Controlled-Release Polymers
      • Nano-Coatings
      • Sensor-Integrated / Enzyme-Aided
    • Y-o-Y Growth Trend Analysis By Technology, 2020 to 2024
    • Absolute $ Opportunity Analysis By Technology, 2025 to 2035
  10. Global Market Analysis 2020 to 2024 and Forecast 2025 to 2035, By End User
    • Introduction / Key Findings
    • Historical Market Size Value (USD Million) & Volume (MT) Analysis By End User, 2020 to 2024
    • Current and Future Market Size Value (USD Million) & Volume (MT) Analysis and Forecast By End User, 2025 to 2035
      • Commercial Farmers
      • Seed Producers & Processors
      • Agricultural Institutes
      • Horticultural Growers
    • Y-o-Y Growth Trend Analysis By End User, 2020 to 2024
    • Absolute $ Opportunity Analysis By End User, 2025 to 2035
  11. Global Market Analysis 2020 to 2024 and Forecast 2025 to 2035, By Distribution
    • Introduction / Key Findings
    • Historical Market Size Value (USD Million) & Volume (MT) Analysis By Distribution, 2020 to 2024
    • Current and Future Market Size Value (USD Million) & Volume (MT) Analysis and Forecast By Distribution, 2025 to 2035
      • Direct Sales
      • Distributors & Retailers
      • Online Platforms
    • Y-o-Y Growth Trend Analysis By Distribution, 2020 to 2024
    • Absolute $ Opportunity Analysis By Distribution, 2025 to 2035
  12. Global Market Analysis 2020 to 2024 and Forecast 2025 to 2035, By Region
    • Introduction
    • Historical Market Size Value (USD Million) & Volume (MT) Analysis By Region, 2020 to 2024
    • Current Market Size Value (USD Million) & Volume (MT) Analysis and Forecast By Region, 2025 to 2035
      • North America
      • Latin America
      • Europe
      • East Asia
      • South Asia & Pacific
      • Middle East and Africa
    • Market Attractiveness Analysis By Region
  13. North America Market Analysis 2020 to 2024 and Forecast 2025 to 2035, By Country
    • Historical Market Size Value (USD Million) & Volume (MT) Trend Analysis By Market Taxonomy, 2020 to 2024
    • Market Size Value (USD Million) & Volume (MT) Forecast By Market Taxonomy, 2025 to 2035
      • By Country
        • USA
        • Canada
      • By Type
      • By Functionality
      • By Crop Type
      • By Technology
      • By End User
      • By Distribution
    • Market Attractiveness Analysis
      • By Country
      • By Type
      • By Functionality
      • By Crop Type
      • By Technology
      • By End User
      • By Distribution
    • Key Takeaways
  14. Latin America Market Analysis 2020 to 2024 and Forecast 2025 to 2035, By Country
    • Historical Market Size Value (USD Million) & Volume (MT) Trend Analysis By Market Taxonomy, 2020 to 2024
    • Market Size Value (USD Million) & Volume (MT) Forecast By Market Taxonomy, 2025 to 2035
      • By Country
        • Brazil
        • Mexico
        • Colombia
        • Rest of Latin America
      • By Type
      • By Functionality
      • By Crop Type
      • By Technology
      • By End User
      • By Distribution
    • Market Attractiveness Analysis
      • By Country
      • By Type
      • By Functionality
      • By Crop Type
      • By Technology
      • By End User
      • By Distribution
    • Key Takeaways
  15. Europe Market Analysis 2020 to 2024 and Forecast 2025 to 2035, By Country
    • Historical Market Size Value (USD Million) & Volume (MT) Trend Analysis By Market Taxonomy, 2020 to 2024
    • Market Size Value (USD Million) & Volume (MT) Forecast By Market Taxonomy, 2025 to 2035
      • By Country
        • Germany
        • UK
        • France
        • Italy
        • Spain
        • Belgium
        • Netherlands
        • Nordic
        • Switzerland
        • Russia
        • Poland
        • Rest of Europe
      • By Type
      • By Functionality
      • By Crop Type
      • By Technology
      • By End User
      • By Distribution
    • Market Attractiveness Analysis
      • By Country
      • By Type
      • By Functionality
      • By Crop Type
      • By Technology
      • By End User
      • By Distribution
    • Key Takeaways
  16. East Asia Market Analysis 2020 to 2024 and Forecast 2025 to 2035, By Country
    • Historical Market Size Value (USD Million) & Volume (MT) Trend Analysis By Market Taxonomy, 2020 to 2024
    • Market Size Value (USD Million) & Volume (MT) Forecast By Market Taxonomy, 2025 to 2035
      • By Country
        • China
        • Japan
        • South Korea
      • By Type
      • By Functionality
      • By Crop Type
      • By Technology
      • By End User
      • By Distribution
    • Market Attractiveness Analysis
      • By Country
      • By Type
      • By Functionality
      • By Crop Type
      • By Technology
      • By End User
      • By Distribution
    • Key Takeaways
  17. South Asia & Pacific Market Analysis 2020 to 2024 and Forecast 2025 to 2035, By Country
    • Historical Market Size Value (USD Million) & Volume (MT) Trend Analysis By Market Taxonomy, 2020 to 2024
    • Market Size Value (USD Million) & Volume (MT) Forecast By Market Taxonomy, 2025 to 2035
      • By Country
        • India
        • Thailand
        • Malaysia
        • Indonesia
        • Singapore
        • Vietnam
        • Australia
        • New Zealand
        • Rest of South Asia
      • By Type
      • By Functionality
      • By Crop Type
      • By Technology
      • By End User
      • By Distribution
    • Market Attractiveness Analysis
      • By Country
      • By Type
      • By Functionality
      • By Crop Type
      • By Technology
      • By End User
      • By Distribution
    • Key Takeaways
  18. Middle East and Africa Market Analysis 2020 to 2024 and Forecast 2025 to 2035, By Country
    • Historical Market Size Value (USD Million) & Volume (MT) Trend Analysis By Market Taxonomy, 2020 to 2024
    • Market Size Value (USD Million) & Volume (MT) Forecast By Market Taxonomy, 2025 to 2035
      • By Country
        • Turkey
        • UAE
        • Saudi Arabia
        • Israel
        • Other GCC Countries
        • North Africa
        • South Africa
      • By Type
      • By Functionality
      • By Crop Type
      • By Technology
      • By End User
      • By Distribution
    • Market Attractiveness Analysis
      • By Country
      • By Type
      • By Functionality
      • By Crop Type
      • By Technology
      • By End User
      • By Distribution
    • Key Takeaways
  19. Key Countries Market Analysis
    • USA
      • Pricing Analysis
      • Market Share Analysis, 2024
        • By Type
        • By Functionality
        • By Crop Type
        • By Technology
        • By End User
        • By Distribution
    • Canada
      • Pricing Analysis
      • Market Share Analysis, 2024
        • By Type
        • By Functionality
        • By Crop Type
        • By Technology
        • By End User
        • By Distribution
    • Mexico
      • Pricing Analysis
      • Market Share Analysis, 2024
        • By Type
        • By Functionality
        • By Crop Type
        • By Technology
        • By End User
        • By Distribution
    • Brazil
      • Pricing Analysis
      • Market Share Analysis, 2024
        • By Type
        • By Functionality
        • By Crop Type
        • By Technology
        • By End User
        • By Distribution
    • Germany
      • Pricing Analysis
      • Market Share Analysis, 2024
        • By Type
        • By Functionality
        • By Crop Type
        • By Technology
        • By End User
        • By Distribution
    • UK
      • Pricing Analysis
      • Market Share Analysis, 2024
        • By Type
        • By Functionality
        • By Crop Type
        • By Technology
        • By End User
        • By Distribution
    • Italy
      • Pricing Analysis
      • Market Share Analysis, 2024
        • By Type
        • By Functionality
        • By Crop Type
        • By Technology
        • By End User
        • By Distribution
    • Spain
      • Pricing Analysis
      • Market Share Analysis, 2024
        • By Type
        • By Functionality
        • By Crop Type
        • By Technology
        • By End User
        • By Distribution
    • France
      • Pricing Analysis
      • Market Share Analysis, 2024
        • By Type
        • By Functionality
        • By Crop Type
        • By Technology
        • By End User
        • By Distribution
    • India
      • Pricing Analysis
      • Market Share Analysis, 2024
        • By Type
        • By Functionality
        • By Crop Type
        • By Technology
        • By End User
        • By Distribution
    • Australia & New Zealand
      • Pricing Analysis
      • Market Share Analysis, 2024
        • By Type
        • By Functionality
        • By Crop Type
        • By Technology
        • By End User
        • By Distribution
    • China
      • Pricing Analysis
      • Market Share Analysis, 2024
        • By Type
        • By Functionality
        • By Crop Type
        • By Technology
        • By End User
        • By Distribution
    • Japan
      • Pricing Analysis
      • Market Share Analysis, 2024
        • By Type
        • By Functionality
        • By Crop Type
        • By Technology
        • By End User
        • By Distribution
    • South Korea
      • Pricing Analysis
      • Market Share Analysis, 2024
        • By Type
        • By Functionality
        • By Crop Type
        • By Technology
        • By End User
        • By Distribution
    • Russia
      • Pricing Analysis
      • Market Share Analysis, 2024
        • By Type
        • By Functionality
        • By Crop Type
        • By Technology
        • By End User
        • By Distribution
    • Poland
      • Pricing Analysis
      • Market Share Analysis, 2024
        • By Type
        • By Functionality
        • By Crop Type
        • By Technology
        • By End User
        • By Distribution
    • Hungary
      • Pricing Analysis
      • Market Share Analysis, 2024
        • By Type
        • By Functionality
        • By Crop Type
        • By Technology
        • By End User
        • By Distribution
    • Kingdom of Saudi Arabia
      • Pricing Analysis
      • Market Share Analysis, 2024
        • By Type
        • By Functionality
        • By Crop Type
        • By Technology
        • By End User
        • By Distribution
    • Turkiye
      • Pricing Analysis
      • Market Share Analysis, 2024
        • By Type
        • By Functionality
        • By Crop Type
        • By Technology
        • By End User
        • By Distribution
    • South Africa
      • Pricing Analysis
      • Market Share Analysis, 2024
        • By Type
        • By Functionality
        • By Crop Type
        • By Technology
        • By End User
        • By Distribution
  20. Market Structure Analysis
    • Competition Dashboard
    • Competition Benchmarking
    • Market Share Analysis of Top Players
      • By Regional
      • By Type
      • By Functionality
      • By Crop Type
      • By Technology
      • By End User
      • By Distribution
  21. Competition Analysis
    • Competition Deep Dive
      • BASF SE
        • Overview
        • Product Portfolio
        • Profitability by Market Segments (Product/Age /Sales Channel/Region)
        • Sales Footprint
        • Strategy Overview
        • Bayer CropScience AG
        • Syngenta AG (Incotec Group)
        • Clariant International
        • Croda International
        • Germains Seed Technology
        • BrettYoung
        • DuPont de Nemours, Inc.
        • FMC Corporation
        • Nufarm Ltd.
    • Assumptions & Acronyms Used
    • Research Methodology

List of Tables

  • Table 1: Global Market Value (USD Million) Forecast by Region, 2020-2035
  • Table 2: Global Market Volume (MT) Forecast by Region, 2020-2035
  • Table 3: Global Market Value (USD Million) Forecast by Type, 2020-2035
  • Table 4: Global Market Volume (MT) Forecast by Type, 2020-2035
  • Table 5: Global Market Value (USD Million) Forecast by Functionality, 2020-2035
  • Table 6: Global Market Volume (MT) Forecast by Functionality, 2020-2035
  • Table 7: Global Market Value (USD Million) Forecast by Crop Type, 2020-2035
  • Table 8: Global Market Volume (MT) Forecast by Crop Type, 2020-2035
  • Table 9: Global Market Value (USD Million) Forecast by Technology, 2020-2035
  • Table 10: Global Market Volume (MT) Forecast by Technology, 2020-2035
  • Table 11: Global Market Value (USD Million) Forecast by End User, 2020-2035
  • Table 12: Global Market Volume (MT) Forecast by End User, 2020-2035
  • Table 13: Global Market Value (USD Million) Forecast by Distribution, 2020-2035
  • Table 14: Global Market Volume (MT) Forecast by Distribution, 2020-2035
  • Table 15: North America Market Value (USD Million) Forecast by Country, 2020-2035
  • Table 16: North America Market Volume (MT) Forecast by Country, 2020-2035
  • Table 17: North America Market Value (USD Million) Forecast by Type, 2020-2035
  • Table 18: North America Market Volume (MT) Forecast by Type, 2020-2035
  • Table 19: North America Market Value (USD Million) Forecast by Functionality, 2020-2035
  • Table 20: North America Market Volume (MT) Forecast by Functionality, 2020-2035
  • Table 21: North America Market Value (USD Million) Forecast by Crop Type, 2020-2035
  • Table 22: North America Market Volume (MT) Forecast by Crop Type, 2020-2035
  • Table 23: North America Market Value (USD Million) Forecast by Technology, 2020-2035
  • Table 24: North America Market Volume (MT) Forecast by Technology, 2020-2035
  • Table 25: North America Market Value (USD Million) Forecast by End User, 2020-2035
  • Table 26: North America Market Volume (MT) Forecast by End User, 2020-2035
  • Table 27: North America Market Value (USD Million) Forecast by Distribution, 2020-2035
  • Table 28: North America Market Volume (MT) Forecast by Distribution, 2020-2035
  • Table 29: Latin America Market Value (USD Million) Forecast by Country, 2020-2035
  • Table 30: Latin America Market Volume (MT) Forecast by Country, 2020-2035
  • Table 31: Latin America Market Value (USD Million) Forecast by Type, 2020-2035
  • Table 32: Latin America Market Volume (MT) Forecast by Type, 2020-2035
  • Table 33: Latin America Market Value (USD Million) Forecast by Functionality, 2020-2035
  • Table 34: Latin America Market Volume (MT) Forecast by Functionality, 2020-2035
  • Table 35: Latin America Market Value (USD Million) Forecast by Crop Type, 2020-2035
  • Table 36: Latin America Market Volume (MT) Forecast by Crop Type, 2020-2035
  • Table 37: Latin America Market Value (USD Million) Forecast by Technology, 2020-2035
  • Table 38: Latin America Market Volume (MT) Forecast by Technology, 2020-2035
  • Table 39: Latin America Market Value (USD Million) Forecast by End User, 2020-2035
  • Table 40: Latin America Market Volume (MT) Forecast by End User, 2020-2035
  • Table 41: Latin America Market Value (USD Million) Forecast by Distribution, 2020-2035
  • Table 42: Latin America Market Volume (MT) Forecast by Distribution, 2020-2035
  • Table 43: Europe Market Value (USD Million) Forecast by Country, 2020-2035
  • Table 44: Europe Market Volume (MT) Forecast by Country, 2020-2035
  • Table 45: Europe Market Value (USD Million) Forecast by Type, 2020-2035
  • Table 46: Europe Market Volume (MT) Forecast by Type, 2020-2035
  • Table 47: Europe Market Value (USD Million) Forecast by Functionality, 2020-2035
  • Table 48: Europe Market Volume (MT) Forecast by Functionality, 2020-2035
  • Table 49: Europe Market Value (USD Million) Forecast by Crop Type, 2020-2035
  • Table 50: Europe Market Volume (MT) Forecast by Crop Type, 2020-2035
  • Table 51: Europe Market Value (USD Million) Forecast by Technology, 2020-2035
  • Table 52: Europe Market Volume (MT) Forecast by Technology, 2020-2035
  • Table 53: Europe Market Value (USD Million) Forecast by End User, 2020-2035
  • Table 54: Europe Market Volume (MT) Forecast by End User, 2020-2035
  • Table 55: Europe Market Value (USD Million) Forecast by Distribution, 2020-2035
  • Table 56: Europe Market Volume (MT) Forecast by Distribution, 2020-2035
  • Table 57: East Asia Market Value (USD Million) Forecast by Country, 2020-2035
  • Table 58: East Asia Market Volume (MT) Forecast by Country, 2020-2035
  • Table 59: East Asia Market Value (USD Million) Forecast by Type, 2020-2035
  • Table 60: East Asia Market Volume (MT) Forecast by Type, 2020-2035
  • Table 61: East Asia Market Value (USD Million) Forecast by Functionality, 2020-2035
  • Table 62: East Asia Market Volume (MT) Forecast by Functionality, 2020-2035
  • Table 63: East Asia Market Value (USD Million) Forecast by Crop Type, 2020-2035
  • Table 64: East Asia Market Volume (MT) Forecast by Crop Type, 2020-2035
  • Table 65: East Asia Market Value (USD Million) Forecast by Technology, 2020-2035
  • Table 66: East Asia Market Volume (MT) Forecast by Technology, 2020-2035
  • Table 67: East Asia Market Value (USD Million) Forecast by End User, 2020-2035
  • Table 68: East Asia Market Volume (MT) Forecast by End User, 2020-2035
  • Table 69: East Asia Market Value (USD Million) Forecast by Distribution, 2020-2035
  • Table 70: East Asia Market Volume (MT) Forecast by Distribution, 2020-2035
  • Table 71: South Asia & Pacific Market Value (USD Million) Forecast by Country, 2020-2035
  • Table 72: South Asia & Pacific Market Volume (MT) Forecast by Country, 2020-2035
  • Table 73: South Asia & Pacific Market Value (USD Million) Forecast by Type, 2020-2035
  • Table 74: South Asia & Pacific Market Volume (MT) Forecast by Type, 2020-2035
  • Table 75: South Asia & Pacific Market Value (USD Million) Forecast by Functionality, 2020-2035
  • Table 76: South Asia & Pacific Market Volume (MT) Forecast by Functionality, 2020-2035
  • Table 77: South Asia & Pacific Market Value (USD Million) Forecast by Crop Type, 2020-2035
  • Table 78: South Asia & Pacific Market Volume (MT) Forecast by Crop Type, 2020-2035
  • Table 79: South Asia & Pacific Market Value (USD Million) Forecast by Technology, 2020-2035
  • Table 80: South Asia & Pacific Market Volume (MT) Forecast by Technology, 2020-2035
  • Table 81: South Asia & Pacific Market Value (USD Million) Forecast by End User, 2020-2035
  • Table 82: South Asia & Pacific Market Volume (MT) Forecast by End User, 2020-2035
  • Table 83: South Asia & Pacific Market Value (USD Million) Forecast by Distribution, 2020-2035
  • Table 84: South Asia & Pacific Market Volume (MT) Forecast by Distribution, 2020-2035
  • Table 85: Middle East and Africa Market Value (USD Million) Forecast by Country, 2020-2035
  • Table 86: Middle East and Africa Market Volume (MT) Forecast by Country, 2020-2035
  • Table 87: Middle East and Africa Market Value (USD Million) Forecast by Type, 2020-2035
  • Table 88: Middle East and Africa Market Volume (MT) Forecast by Type, 2020-2035
  • Table 89: Middle East and Africa Market Value (USD Million) Forecast by Functionality, 2020-2035
  • Table 90: Middle East and Africa Market Volume (MT) Forecast by Functionality, 2020-2035
  • Table 91: Middle East and Africa Market Value (USD Million) Forecast by Crop Type, 2020-2035
  • Table 92: Middle East and Africa Market Volume (MT) Forecast by Crop Type, 2020-2035
  • Table 93: Middle East and Africa Market Value (USD Million) Forecast by Technology, 2020-2035
  • Table 94: Middle East and Africa Market Volume (MT) Forecast by Technology, 2020-2035
  • Table 95: Middle East and Africa Market Value (USD Million) Forecast by End User, 2020-2035
  • Table 96: Middle East and Africa Market Volume (MT) Forecast by End User, 2020-2035
  • Table 97: Middle East and Africa Market Value (USD Million) Forecast by Distribution, 2020-2035
  • Table 98: Middle East and Africa Market Volume (MT) Forecast by Distribution, 2020-2035

List of Figures

  • Figure 1: Global Market Volume (MT) Forecast 2020-2035
  • Figure 2: Global Market Pricing Analysis
  • Figure 3: Global Market Value (USD Million) Forecast 2020-2035
  • Figure 4: Global Market Value Share and BPS Analysis by Type, 2025 and 2035
  • Figure 5: Global Market Y-o-Y Growth Comparison by Type, 2025-2035
  • Figure 6: Global Market Attractiveness Analysis by Type
  • Figure 7: Global Market Value Share and BPS Analysis by Functionality, 2025 and 2035
  • Figure 8: Global Market Y-o-Y Growth Comparison by Functionality, 2025-2035
  • Figure 9: Global Market Attractiveness Analysis by Functionality
  • Figure 10: Global Market Value Share and BPS Analysis by Crop Type, 2025 and 2035
  • Figure 11: Global Market Y-o-Y Growth Comparison by Crop Type, 2025-2035
  • Figure 12: Global Market Attractiveness Analysis by Crop Type
  • Figure 13: Global Market Value Share and BPS Analysis by Technology, 2025 and 2035
  • Figure 14: Global Market Y-o-Y Growth Comparison by Technology, 2025-2035
  • Figure 15: Global Market Attractiveness Analysis by Technology
  • Figure 16: Global Market Value Share and BPS Analysis by End User, 2025 and 2035
  • Figure 17: Global Market Y-o-Y Growth Comparison by End User, 2025-2035
  • Figure 18: Global Market Attractiveness Analysis by End User
  • Figure 19: Global Market Value Share and BPS Analysis by Distribution, 2025 and 2035
  • Figure 20: Global Market Y-o-Y Growth Comparison by Distribution, 2025-2035
  • Figure 21: Global Market Attractiveness Analysis by Distribution
  • Figure 22: Global Market Value (USD Million) Share and BPS Analysis by Region, 2025 and 2035
  • Figure 23: Global Market Y-o-Y Growth Comparison by Region, 2025-2035
  • Figure 24: Global Market Attractiveness Analysis by Region
  • Figure 25: North America Market Incremental $ Opportunity, 2025-2035
  • Figure 26: Latin America Market Incremental $ Opportunity, 2025-2035
  • Figure 27: Europe Market Incremental $ Opportunity, 2025-2035
  • Figure 28: East Asia Market Incremental $ Opportunity, 2025-2035
  • Figure 29: South Asia & Pacific Market Incremental $ Opportunity, 2025-2035
  • Figure 30: Middle East and Africa Market Incremental $ Opportunity, 2025-2035
  • Figure 31: North America Market Value Share and BPS Analysis by Country, 2025 and 2035
  • Figure 32: North America Market Value Share and BPS Analysis by Type, 2025 and 2035
  • Figure 33: North America Market Y-o-Y Growth Comparison by Type, 2025-2035
  • Figure 34: North America Market Attractiveness Analysis by Type
  • Figure 35: North America Market Value Share and BPS Analysis by Functionality, 2025 and 2035
  • Figure 36: North America Market Y-o-Y Growth Comparison by Functionality, 2025-2035
  • Figure 37: North America Market Attractiveness Analysis by Functionality
  • Figure 38: North America Market Value Share and BPS Analysis by Crop Type, 2025 and 2035
  • Figure 39: North America Market Y-o-Y Growth Comparison by Crop Type, 2025-2035
  • Figure 40: North America Market Attractiveness Analysis by Crop Type
  • Figure 41: North America Market Value Share and BPS Analysis by Technology, 2025 and 2035
  • Figure 42: North America Market Y-o-Y Growth Comparison by Technology, 2025-2035
  • Figure 43: North America Market Attractiveness Analysis by Technology
  • Figure 44: North America Market Value Share and BPS Analysis by End User, 2025 and 2035
  • Figure 45: North America Market Y-o-Y Growth Comparison by End User, 2025-2035
  • Figure 46: North America Market Attractiveness Analysis by End User
  • Figure 47: North America Market Value Share and BPS Analysis by Distribution, 2025 and 2035
  • Figure 48: North America Market Y-o-Y Growth Comparison by Distribution, 2025-2035
  • Figure 49: North America Market Attractiveness Analysis by Distribution
  • Figure 50: Latin America Market Value Share and BPS Analysis by Country, 2025 and 2035
  • Figure 51: Latin America Market Value Share and BPS Analysis by Type, 2025 and 2035
  • Figure 52: Latin America Market Y-o-Y Growth Comparison by Type, 2025-2035
  • Figure 53: Latin America Market Attractiveness Analysis by Type
  • Figure 54: Latin America Market Value Share and BPS Analysis by Functionality, 2025 and 2035
  • Figure 55: Latin America Market Y-o-Y Growth Comparison by Functionality, 2025-2035
  • Figure 56: Latin America Market Attractiveness Analysis by Functionality
  • Figure 57: Latin America Market Value Share and BPS Analysis by Crop Type, 2025 and 2035
  • Figure 58: Latin America Market Y-o-Y Growth Comparison by Crop Type, 2025-2035
  • Figure 59: Latin America Market Attractiveness Analysis by Crop Type
  • Figure 60: Latin America Market Value Share and BPS Analysis by Technology, 2025 and 2035
  • Figure 61: Latin America Market Y-o-Y Growth Comparison by Technology, 2025-2035
  • Figure 62: Latin America Market Attractiveness Analysis by Technology
  • Figure 63: Latin America Market Value Share and BPS Analysis by End User, 2025 and 2035
  • Figure 64: Latin America Market Y-o-Y Growth Comparison by End User, 2025-2035
  • Figure 65: Latin America Market Attractiveness Analysis by End User
  • Figure 66: Latin America Market Value Share and BPS Analysis by Distribution, 2025 and 2035
  • Figure 67: Latin America Market Y-o-Y Growth Comparison by Distribution, 2025-2035
  • Figure 68: Latin America Market Attractiveness Analysis by Distribution
  • Figure 69: Europe Market Value Share and BPS Analysis by Country, 2025 and 2035
  • Figure 70: Europe Market Value Share and BPS Analysis by Type, 2025 and 2035
  • Figure 71: Europe Market Y-o-Y Growth Comparison by Type, 2025-2035
  • Figure 72: Europe Market Attractiveness Analysis by Type
  • Figure 73: Europe Market Value Share and BPS Analysis by Functionality, 2025 and 2035
  • Figure 74: Europe Market Y-o-Y Growth Comparison by Functionality, 2025-2035
  • Figure 75: Europe Market Attractiveness Analysis by Functionality
  • Figure 76: Europe Market Value Share and BPS Analysis by Crop Type, 2025 and 2035
  • Figure 77: Europe Market Y-o-Y Growth Comparison by Crop Type, 2025-2035
  • Figure 78: Europe Market Attractiveness Analysis by Crop Type
  • Figure 79: Europe Market Value Share and BPS Analysis by Technology, 2025 and 2035
  • Figure 80: Europe Market Y-o-Y Growth Comparison by Technology, 2025-2035
  • Figure 81: Europe Market Attractiveness Analysis by Technology
  • Figure 82: Europe Market Value Share and BPS Analysis by End User, 2025 and 2035
  • Figure 83: Europe Market Y-o-Y Growth Comparison by End User, 2025-2035
  • Figure 84: Europe Market Attractiveness Analysis by End User
  • Figure 85: Europe Market Value Share and BPS Analysis by Distribution, 2025 and 2035
  • Figure 86: Europe Market Y-o-Y Growth Comparison by Distribution, 2025-2035
  • Figure 87: Europe Market Attractiveness Analysis by Distribution
  • Figure 88: East Asia Market Value Share and BPS Analysis by Country, 2025 and 2035
  • Figure 89: East Asia Market Value Share and BPS Analysis by Type, 2025 and 2035
  • Figure 90: East Asia Market Y-o-Y Growth Comparison by Type, 2025-2035
  • Figure 91: East Asia Market Attractiveness Analysis by Type
  • Figure 92: East Asia Market Value Share and BPS Analysis by Functionality, 2025 and 2035
  • Figure 93: East Asia Market Y-o-Y Growth Comparison by Functionality, 2025-2035
  • Figure 94: East Asia Market Attractiveness Analysis by Functionality
  • Figure 95: East Asia Market Value Share and BPS Analysis by Crop Type, 2025 and 2035
  • Figure 96: East Asia Market Y-o-Y Growth Comparison by Crop Type, 2025-2035
  • Figure 97: East Asia Market Attractiveness Analysis by Crop Type
  • Figure 98: East Asia Market Value Share and BPS Analysis by Technology, 2025 and 2035
  • Figure 99: East Asia Market Y-o-Y Growth Comparison by Technology, 2025-2035
  • Figure 100: East Asia Market Attractiveness Analysis by Technology
  • Figure 101: East Asia Market Value Share and BPS Analysis by End User, 2025 and 2035
  • Figure 102: East Asia Market Y-o-Y Growth Comparison by End User, 2025-2035
  • Figure 103: East Asia Market Attractiveness Analysis by End User
  • Figure 104: East Asia Market Value Share and BPS Analysis by Distribution, 2025 and 2035
  • Figure 105: East Asia Market Y-o-Y Growth Comparison by Distribution, 2025-2035
  • Figure 106: East Asia Market Attractiveness Analysis by Distribution
  • Figure 107: South Asia & Pacific Market Value Share and BPS Analysis by Country, 2025 and 2035
  • Figure 108: South Asia & Pacific Market Value Share and BPS Analysis by Type, 2025 and 2035
  • Figure 109: South Asia & Pacific Market Y-o-Y Growth Comparison by Type, 2025-2035
  • Figure 110: South Asia & Pacific Market Attractiveness Analysis by Type
  • Figure 111: South Asia & Pacific Market Value Share and BPS Analysis by Functionality, 2025 and 2035
  • Figure 112: South Asia & Pacific Market Y-o-Y Growth Comparison by Functionality, 2025-2035
  • Figure 113: South Asia & Pacific Market Attractiveness Analysis by Functionality
  • Figure 114: South Asia & Pacific Market Value Share and BPS Analysis by Crop Type, 2025 and 2035
  • Figure 115: South Asia & Pacific Market Y-o-Y Growth Comparison by Crop Type, 2025-2035
  • Figure 116: South Asia & Pacific Market Attractiveness Analysis by Crop Type
  • Figure 117: South Asia & Pacific Market Value Share and BPS Analysis by Technology, 2025 and 2035
  • Figure 118: South Asia & Pacific Market Y-o-Y Growth Comparison by Technology, 2025-2035
  • Figure 119: South Asia & Pacific Market Attractiveness Analysis by Technology
  • Figure 120: South Asia & Pacific Market Value Share and BPS Analysis by End User, 2025 and 2035
  • Figure 121: South Asia & Pacific Market Y-o-Y Growth Comparison by End User, 2025-2035
  • Figure 122: South Asia & Pacific Market Attractiveness Analysis by End User
  • Figure 123: South Asia & Pacific Market Value Share and BPS Analysis by Distribution, 2025 and 2035
  • Figure 124: South Asia & Pacific Market Y-o-Y Growth Comparison by Distribution, 2025-2035
  • Figure 125: South Asia & Pacific Market Attractiveness Analysis by Distribution
  • Figure 126: Middle East and Africa Market Value Share and BPS Analysis by Country, 2025 and 2035
  • Figure 127: Middle East and Africa Market Value Share and BPS Analysis by Type, 2025 and 2035
  • Figure 128: Middle East and Africa Market Y-o-Y Growth Comparison by Type, 2025-2035
  • Figure 129: Middle East and Africa Market Attractiveness Analysis by Type
  • Figure 130: Middle East and Africa Market Value Share and BPS Analysis by Functionality, 2025 and 2035
  • Figure 131: Middle East and Africa Market Y-o-Y Growth Comparison by Functionality, 2025-2035
  • Figure 132: Middle East and Africa Market Attractiveness Analysis by Functionality
  • Figure 133: Middle East and Africa Market Value Share and BPS Analysis by Crop Type, 2025 and 2035
  • Figure 134: Middle East and Africa Market Y-o-Y Growth Comparison by Crop Type, 2025-2035
  • Figure 135: Middle East and Africa Market Attractiveness Analysis by Crop Type
  • Figure 136: Middle East and Africa Market Value Share and BPS Analysis by Technology, 2025 and 2035
  • Figure 137: Middle East and Africa Market Y-o-Y Growth Comparison by Technology, 2025-2035
  • Figure 138: Middle East and Africa Market Attractiveness Analysis by Technology
  • Figure 139: Middle East and Africa Market Value Share and BPS Analysis by End User, 2025 and 2035
  • Figure 140: Middle East and Africa Market Y-o-Y Growth Comparison by End User, 2025-2035
  • Figure 141: Middle East and Africa Market Attractiveness Analysis by End User
  • Figure 142: Middle East and Africa Market Value Share and BPS Analysis by Distribution, 2025 and 2035
  • Figure 143: Middle East and Africa Market Y-o-Y Growth Comparison by Distribution, 2025-2035
  • Figure 144: Middle East and Africa Market Attractiveness Analysis by Distribution
  • Figure 145: Global Market - Tier Structure Analysis
  • Figure 146: Global Market - Company Share Analysis

Frequently Asked Questions

What is the market size of the Smart Seed Coatings Market in 2025?

The market is valued at USD 2,936.4 million in 2025.

What is the projected market size of the Smart Seed Coatings Market in 2035?

The market is forecasted to reach USD 5,722.6 million by 2035.

What is the CAGR of the Smart Seed Coatings Market during 2025-2035?

The market is projected to grow at a CAGR of 6.9% during the forecast period.

Which is the leading type segment in 2025?

Polymer-Based Smart Coatings are expected to dominate with a 42% share in 2025.

Which regions are projected to record the fastest growth?

India (10.2% CAGR), China (9.4%), South Asia & Pacific (9.2%), and East Asia (8.6%) are anticipated to expand fastest through 2035.

Explore Similar Insights

Future Market Insights

Smart Seed Coatings Market

Chat With

MaRIA

Hi There, I am MaRIA, Your Market Research Intelligence Assistant. How may I help you?