

- Market Size (2026)
- USD 330.0 Mn
- Forecast (2036)
- USD 840.5 Mn
- CAGR (2026 to 2036)
- 9.8%
How big is the Soil Metabolic Enzymes Market in 2026?
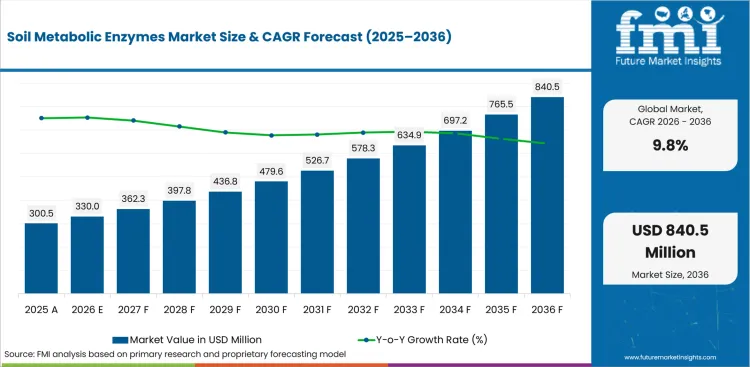
USD 330.0 million in 2026 and USD 840.5 million by 2036 at a 9.8% CAGR.
Soil-health programs are moving enzyme inputs from trial plots into planned crop-input buying across retailer-led agronomy channels. USDA NASS reported 95.3 million acres of intended corn plantings for 2026, which expands the operating base for residue breakdown and root-zone support. Buyers tracking agricultural enzymes therefore need proof that product handling and field guidance reduce adoption risk before broadacre rollout.
Growers and cooperatives are projected to treat enzyme products as risk-control purchases across seasonal soil programs. Retailers and agricultural service providers are likely to review storage stability before approving wider crop plans. Nutrient efficiency pressure is raising interest in biological tools that are beside conventional fertilizer programs during field planning. The same buyer teams that compare biofertilizers now review agronomy support and crop-plan compatibility before seasonal ordering.
Product value is expected to rise in programs that connect soil testing with biological input planning. Residue management and retailer advice then guide the timing of repeat purchases across seasonal crop cycles. Mature markets are projected to weight documentation and seasonal proof before repeat purchase programs expand. Higher-growth markets are likely to weight channel access and field training before repeat orders become routine. Procurement teams are expected to favor suppliers that reduce technical handoffs before field-use questions reach growers.
| Metric | Value |
|---|---|
| 2025 Market Size | USD 300.5 million |
| 2026 Market Size | USD 330.0 million |
| 2036 Market Size | USD 840.5 million |
| Forecast CAGR (2026-2036) | 9.8% |
| Product Type Focus | Powder |
| Powder Share (2026) | 38.0% |
| Source Focus | Microbial |
| Microbial Share (2026) | 35.5% |
| Crop Type Focus | Cereals & Grains |
| Cereals & Grains Share (2026) | 42.0% |
| Fastest-growing Country | India |
| India CAGR by 2036 | 8.8% |
Summary of the Soil Metabolic Enzymes Market
| Market Signal | Commercial Impact |
|---|---|
| Demand and Growth Drivers | Soil-function pressure is expected to make enzyme products part of planned crop-input decisions. Adoption is also projected to rise as advisers link residue breakdown with nutrient-release timing.
|
| Product and Segment View | Powder, microbial sources, cereals and grains, and soil treatment lead the 2026 segment view. Demand is supported by storage stability and broadacre trial economics across soil-care programs.
|
| Geography and Growth Outlook | Asia is expected to show stronger channel conversion for soil metabolic enzymes. The United States is likely to grow through broadacre acreage and disciplined distributor programs.
|
| Competitive Landscape | Competition is projected to depend on biological portfolio depth and field evidence. Agronomy service is expected to decide whether products move beyond limited trials.
|
| Analyst Perspective | Commercial value is expected to shift toward proof and handling discipline. Retailer support is projected to shape repeat purchase confidence across adviser-led crop programs
- Nikhil Kaitwade, Principal Analyst at Future Market Insights |
Source: FMI's proprietary forecasting model and primary research
How is the soil metabolic enzymes market segmented?
The soil metabolic enzymes market industry is segmented by product type, source, crop type, application, and region.
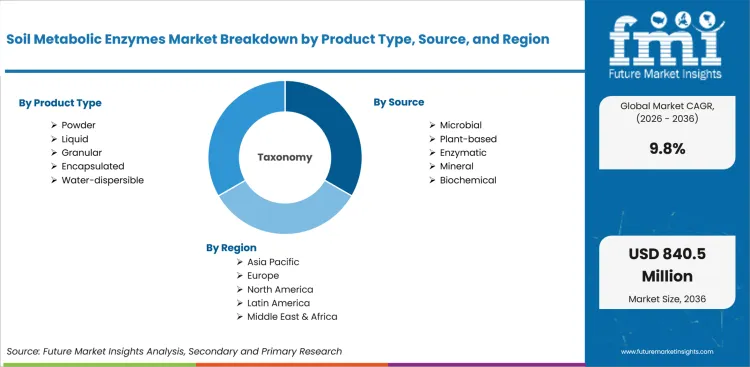
The soil metabolic enzymes market is segmented by product type, source, crop type, application, and region. By product type, the market covers liquid, granular, powder, encapsulated, and water-dispersible formats. By source, it covers microbial, plant-based, enzymatic, mineral, and biochemical inputs. By crop type, it covers cereals & grains, oilseeds & pulses, fruits & vegetables, turf & ornamentals, and plantation crops. By application, it covers soil treatment, foliar, seed treatment, crop protection, and compost & residue. Regional coverage includes North America, Europe, East Asia, South Asia, and Latin America, supported by adjacent demand in agricultural microbials.
How does powder shape demand within the product type category?
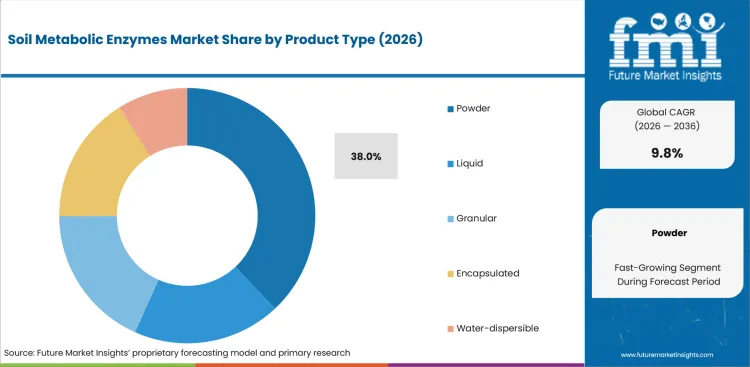
Product format is expected to influence storage risk before distributors approve wider listings across seasonal crop-input shelves. Powder products carry procurement weight due to shelf discipline and easier batching for seasonal crop programs. Retailers also need a format that supports smaller packs and clear field-use instructions. Powder suppliers therefore need both quality records and agronomy support before buyers approve broader commercial runs.
- Powder is expected to account for 38.0% market share in 2026, supported by storage stability and distributor handling needs. FAO described 5 key soil enzyme activities for soil biological analysis, which supports buyer interest in measurable soil-function claims.
- The buyer case for powder centers on lower handling risk: distributors gain a stable format that simplifies warehouse storage and seasonal advice. Powder programs also support biological compatibility checks, which helps retailers connect enzyme products to residue management and biofertilizer planning before purchase approval.
What supports demand for microbial source choices?
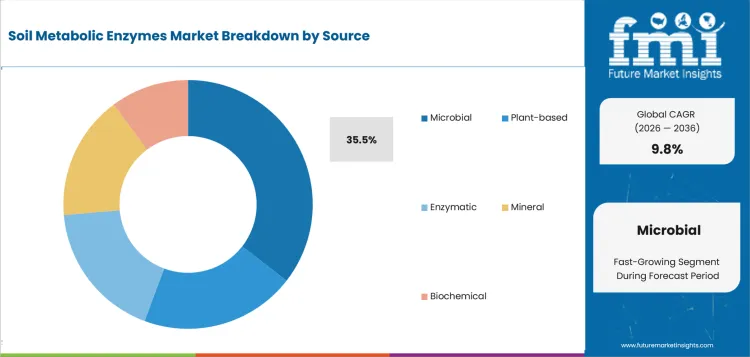
Source decisions are expected to shape buyer trust before a product enters retailer trials. Microbial inputs fit enzyme programs that need a direct link between biological activity and soil-function claims. Procurement teams also need traceability before a microbial product reaches broadacre advisers and retailer training programs. Supplier credibility is expected to depend on strain knowledge and batch records before field support begins.
- Microbial is projected to represent 35.5% of the market in 2026, driven by buyer interest in biology-led nutrient cycling. Novonesis and Rovensa Next announced a 2026 USA distribution agreement for agricultural biosolutions, which expands retailer access to microbial and bionutrition programs.
- Crop-input retailers gain from microbial inputs owing to a clearer bridge between soil biology and commercial field advice. The format fit helps agronomy teams explain product use beside microbial seed treatment programs, which are already understood by seed and retailer channels.
How do buyers evaluate cereals & grains within the crop type category?
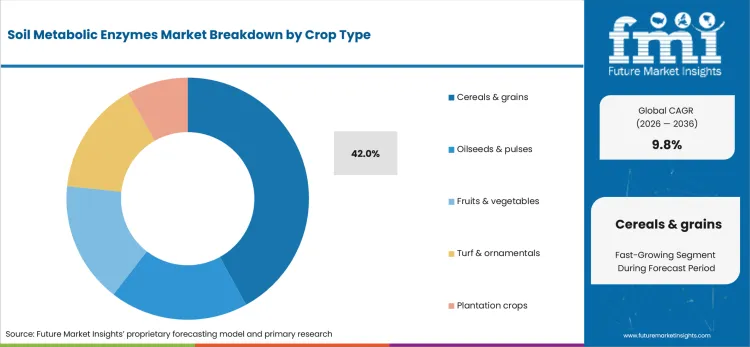
Crop type selection is expected to reflect acreage scale and repeat-use economics across broadacre agronomy programs. Cereals & grains buyers need input programs that support broadacre service without complex handling steps. Supplier value rises when agronomists link enzyme products to residue loads and nutrient-release timing. Broadacre buyers therefore screen products for repeatability before moving beyond field trials into retailer-backed programs.
- Cereals & grains are anticipated to hold 42.0% share in 2026, attributable to large-acre input cycles. USDA NASS estimated 43.8 million acres of all wheat planted area for 2026, reinforcing cereal exposure for enzyme-based crop programs.
- For grain buyers, cereals & grains reduce adoption risk owing to broad retailer coverage and familiar crop-service routines. Suppliers that support seed biostimulants alignment are expected to gain better trial placement across cereal and corn programs.
How is soil treatment positioned within the application category?
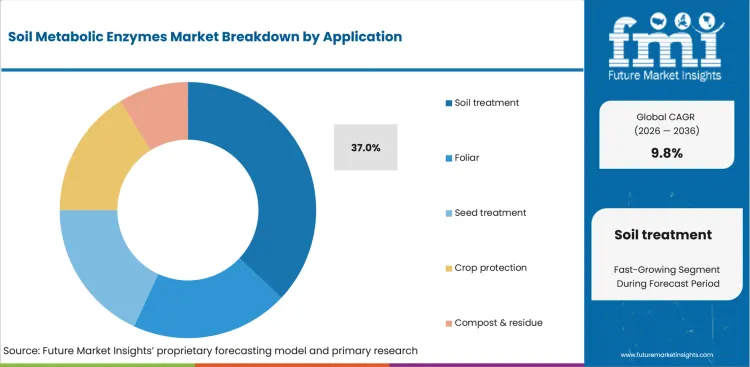
Application choice is expected to determine whether enzyme use remains a trial input or enters routine crop planning. Soil treatment fits enzyme products due to the direct connection between biological activity and root-zone conditions. Growers need application windows that match fertilizer planning and residue management before seasonal field teams approve repeat use. Suppliers therefore compete on field-use clarity during retailer qualification and adviser training.
- Soil treatment is estimated to reach 37.0% share in 2026, due to direct fit for residue breakdown and soil-function programs. Syngenta and Ceres Biotics signed a 2025 agreement for VIXERAN, which reflects buyer interest in biological tools linked to nutrient-use efficiency.
- The buying decision for soil treatment is about field-use clarity: growers need application timing that matches fertilizer and biological input planning. Soil treatment also supports adjacent interest in microalgae fertilizers where biological positioning needs practical guidance before broader account expansion.
What are the drivers, restraints, and opportunities in the soil metabolic enzymes market?
Near-term purchases are being shaped by soil-function pressure and field-result variability. Retailer agronomy programs shape the supplier access route outlined below.
- Driver: Soil-health and residue-management pressure is expected to push spending toward enzyme inputs that support clearer field-use claims.
- Restraint: Variable soil texture and moisture are likely to delay adoption in accounts that need repeatable field proof.
- Opportunity: Retailer-backed agronomy programs are projected to create extension routes for suppliers that provide trial guidance and documentation.
Broadacre and specialty growers are expected to raise interest in enzyme inputs due to rising pressure on nutrient efficiency and residue breakdown. Corteva described Ympact in 2025 as a biostimulant seed treatment for spring cereals, which shows how crop programs are adding biological support around metabolic processes. Suppliers that translate product use into practical field steps are likely to gain trial access.
Field variability is anticipated to remain the main restraint for seasonal adoption across soil types and adviser networks. Soil temperature and moisture influence perceived product performance, and residue load affects visible results. Buyers therefore need evidence packs that explain trial conditions and application timing before retail expansion. Supplier claims are likely to face longer review in accounts that compare enzyme products against familiar fertilizer and crop-protection routines.
Retailer-backed agronomy is likely to convert the restraint into a route for supplier access. Advisers shorten the gap between label claims and field action by guiding timing and compatibility. Rising demand for silage inoculants and enzymes also shows how enzyme products gain acceptance when technical service explains the biological process.
Which country CAGRs are profiled in the soil metabolic enzymes market?
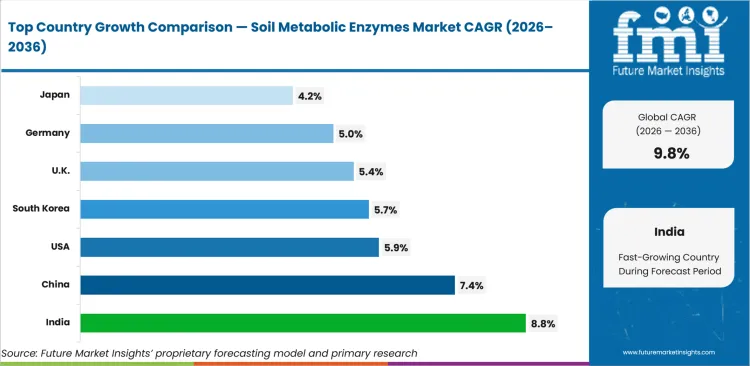
| Country | CAGR |
|---|---|
| United States | 5.9% |
| China | 7.4% |
| India | 8.8% |
| Germany | 5.0% |
| United Kingdom | 5.4% |
| Japan | 4.2% |
| South Korea | 5.7% |
Source: FMI's proprietary forecasting model and primary research
How do country-level CAGRs compare in the soil metabolic enzymes market?
Country CAGR profiles in the soil metabolic enzymes market reflect crop intensity, retailer advice, and proof requirements. India and China show higher channel conversion due to large crop systems and soil-productivity programs. The United States and South Korea form a mid-tier adoption band shaped by broadacre service and specialty crop routines. The United Kingdom and Germany show steadier purchasing through arable programs and documentation discipline. Japan reflects a careful evidence cycle in which distributor trust and launch pacing guide conversion.
- By 2036, the United States is projected to grow at 5.9% CAGR due to broadacre residue pressure and distributor-led crop programs. USDA NASS reported intended corn plantings of 95.3 million acres for 2026, which gives enzyme suppliers a large route into residue breakdown trials. Corn Belt retailers are expected to evaluate powder and microbial formats first during broadacre residue programs. Bayer Crop Science and BASF are positioned to build account presence in programs that need both crop-input breadth and technical field support.
- China’s demand outlook is anticipated to advance at 7.4% CAGR over the assessment period, supported by grain security and soil-productivity programs. The State Council reported China’s 2024 grain output at 706.5 million tonnes, which sustains demand for inputs that support nutrient release across large production systems. Heilongjiang grain operations and Yangtze River Delta vegetable clusters are expected to test enzyme inputs through distributor-led demonstrations. Syngenta and UPL are likely to gain traction where local registration and retailer training shape adoption.
- India is forecast to rise at 8.8% CAGR over the forecast period, attributable to foodgrain scale and biological-input access. PIB reported total foodgrain production at 376.563 million tonnes in the latest official estimate, which raises the need for tools that support residue management and nutrient-use discipline. Punjab and Haryana cereal belts are expected to prioritize enzyme products in straw-management programs. Novonesis and Rovensa Next stand to gain attention where distributor education reduces field-use uncertainty.
- Adoption in Germany is estimated to post 5.0% CAGR over the assessment period, owing to arable productivity pressure and strict documentation expectations. Destatis reported that agricultural farms harvested 45 million tons of grain in 2025, which keeps cereal programs central to crop-input planning. Bavaria mixed farms and Lower Saxony crop advisers are expected to evaluate soil treatment products through multi-season proof. BASF and Bayer Crop Science are positioned to gain repeat discussions where EU-ready documentation guides supplier approval.
- The United Kingdom outlook is projected to record 5.4% CAGR over the assessment period, driven by arable rotations and retailer-adviser influence. Defra reported total arable crop area at 4.1 million hectares in 2025, which supports targeted use of soil treatment products in cereals and oilseeds. East of England cereal buyers are expected to assess enzyme programs through agronomy networks. Corteva Agriscience and Syngenta are likely to build account presence where product guidance fits seasonal advisory routines.
- In Japan, soil metabolic enzyme demand is predicted to advance at 4.2% CAGR over the forecast period due to limited farmland and careful evidence review. MAFF reported farmland area at 4.27 million hectares in 2024, which keeps productivity support central to supplier screening. Hokkaido field-crop groups and Kanto vegetable suppliers are expected to evaluate enzyme blends selectively. Lallemand Plant Care and Sumitomo Biorational are positioned for accounts that value controlled launch pacing.
- South Korea is estimated to post 5.7% CAGR over the assessment period, supported by specialty crop routines and compact field systems. Statistics Korea reported barley production of 92 thousand tons in 2025, which shows how crop programs remain data-led even in smaller acreage systems. Jeonbuk cereal groups and Gyeongnam vegetable producers are likely to test enzyme inputs through distributor trials. Valent BioSciences and UPL are expected to gain repeat purchase discussions where local agronomy support explains application timing.
Who are the notable companies in the soil metabolic enzymes market?
Bayer Crop Science, Syngenta, BASF, Corteva Agriscience, Novonesis, UPL, Sumitomo Biorational, Valent BioSciences, Lallemand Plant Care, Rovensa Next, Certis Biologicals, and Koppert are the notable companies shaping this market.
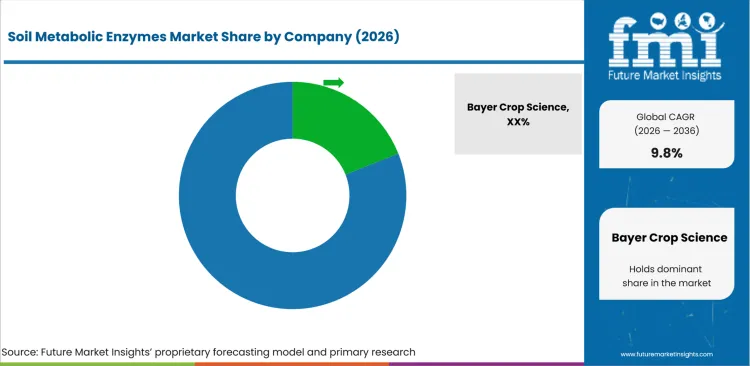
Competition in the soil metabolic enzymes market is split by crop-input breadth, microbial credibility, and agronomy support for soil treatment programs. Key players in the sector like Bayer Crop Science, Syngenta, and BASF are more suited to broad crop-input accounts. Novonesis, Lallemand Plant Care, and Valent BioSciences are better positioned in biology-led programs. Corteva Agriscience and UPL gain preference in environments that need seed and crop-protection adjacency. The buyer decision is expected to center on which supplier reduces field proof and retailer training work.
- Bayer Crop Science and BASF focus on crop-input breadth, which addresses distributors needing enzyme products beside fertilizer and crop-protection programs. Buyers use these portfolios to reduce qualification work before launch and to compare field service across powder or soil treatment formats.
- Buyers choosing Novonesis or Lallemand Plant Care are typically looking for microbial credibility due to strain knowledge and biology-led positioning. Their portfolios help agronomy teams connect enzyme activity to soil-function claims before broader retail account expansion.
- Syngenta and Corteva Agriscience gain preference in accounts that already use seed treatment and biological crop programs. These companies help buyers position enzyme products beside nutrient-use and early plant resilience tools during seasonal planning.
- In specialty crop and distributor-heavy accounts, Valent BioSciences, UPL, and Rovensa Next are prominent due to biological portfolios and channel access. Procurement teams select these suppliers when local technical support lowers field-use risk before larger purchase orders.
Competitive Benchmarking: Soil Metabolic Enzymes Market
| Company | Biological Portfolio Fit | Soil Enzyme Relevance | Agronomy Support | Geographic Reach |
|---|---|---|---|---|
| Bayer Crop Science | High | Medium | Strong | Global |
| Syngenta | High | Strong | Strong | Global |
| BASF | High | Strong | Strong | Global |
| Corteva Agriscience | Strong | Medium | Strong | Global |
| Novonesis | High | Strong | Medium | Global |
| UPL | Strong | Medium | Strong | Global |
| Sumitomo Biorational | Medium | Strong | Strong | Regional |
| Valent BioSciences | Medium | Strong | Strong | Global |
| Lallemand Plant Care | High | Strong | Strong | Global |
| Rovensa Next | Strong | Medium | Strong | Regional |
| Certis Biologicals | Medium | Medium | Regional | Regional |
| Koppert | Strong | Medium | Strong | Global |
Source: Future Market Insights competitive analysis, 2026. Ratings reflect relative portfolio relevance and workflow fit across soil enzyme purchasing situations. Service capability and geographic reach shape the remaining comparison.
Key Developments in the Soil Metabolic Enzymes Market
- In February 2025, Syngenta and Ceres Biotics signed an agreement to bring VIXERAN to farmers globally. The biological product focuses on nutrient-use efficiency across crop programs that need clearer field explanations. Soil enzyme suppliers are expected to face higher expectations for field explanations and retailer-ready agronomy support.
- In June 2026, Novonesis and Rovensa Next announced a USA distribution agreement for select agricultural biosolutions. Retailer access and field service increasingly decide biological input conversion, so enzyme suppliers are likely to watch this model for channel strategy.
- In February 2025, Corteva Agriscience promoted Ympact as a biostimulant seed treatment for spring cereal programs. The product note connected metabolic processes and abiotic stress tolerance in cereal programs that need clearer evidence language. Buyers are expected to compare enzyme suppliers against similar evidence-based biological positioning.
Key Players in the Soil Metabolic Enzymes Market
Diversified crop-input companies
- Bayer Crop Science
- Syngenta
- BASF
- Corteva Agriscience
- UPL
Microbial and biosolutions specialists
- Novonesis
- Lallemand Plant Care
- Valent BioSciences
- Rovensa Next
Biorational and biological crop-service suppliers
- Sumitomo Biorational
- Certis Biologicals
- Koppert
Soil Metabolic Enzymes Market - Report Scope
| Coverage field | Report scope |
|---|---|
| Market breakdown | Soil Metabolic Enzymes Market Breakdown by product type, source, crop type, application, and region |
| Market Definition | Soil metabolic enzyme products and supporting formats used by growers, distributors, and agricultural service providers to support soil activity, residue breakdown, nutrient release, and root-zone performance. |
| Regions Covered | North America, Latin America, Europe, East Asia, South Asia and Pacific, Middle East and Africa |
| Countries Covered | United States, China, India, Germany, United Kingdom, Japan, South Korea and additional country markets |
| Key Companies Profiled | Bayer Crop Science, Syngenta, BASF, Corteva Agriscience, Novonesis, UPL, Sumitomo Biorational, Valent BioSciences, Lallemand Plant Care, Rovensa Next, Certis Biologicals, Koppert |
| Forecast Period | 2026 to 2036 |
| Approach | Hybrid methodology using segment adoption, buyer use cases, country CAGRs, supplier portfolios, and verified public-source signals |
Source: Future Market Insights - analysis driven by proprietary forecasting models and primary research
Soil Metabolic Enzymes Market - Research Methodology
| Method | Approach |
|---|---|
| Primary Research | FMI analysts reviewed inputs from crop-input retailers, biological formulators, agronomy advisers, distributor managers, and grower-service teams. Interviews focused on product format, source credibility, crop fit, application timing, trial proof, and adoption barriers across powder, microbial, and soil treatment programs. |
| Desk Research | Desk research covered official crop statistics, soil-health references, company product information, and public biological-input updates. Product relevance was checked against soil enzyme use cases, EU biostimulants adjacency, nutrient-use claims, residue management, and channel suitability across retailer-led agronomy programs. |
| Market Sizing and Forecasting | The model combined enzyme-product demand, biological input adoption, format mix, crop exposure, application method, and country-level crop intensity signals. Forecast assumptions were adjusted for powder handling, microbial source credibility, cereal exposure, soil treatment fit, and retailer documentation requirements. |
| Data Validation | Forecasts were checked against crop acreage, biological supplier portfolios, official soil-health references, and country-level production indicators. Company portfolios were reviewed to avoid counting adjacent crop biologicals without direct soil enzyme or soil-function relevance. |
Source: Future Market Insights (FMI) analysis, based on proprietary forecasting model and primary research
Soil Metabolic Enzymes Market by Segments
Soil Metabolic Enzymes Market segmented by Product type:
- Liquid
- Granular
- Powder
- Encapsulated
- Water-dispersible
Soil Metabolic Enzymes Market segmented by Source:
- Microbial
- Plant-based
- Enzymatic
- Mineral
- Biochemical
Soil Metabolic Enzymes Market segmented by Crop type:
- Cereals & grains
- Oilseeds & pulses
- Fruits & vegetables
- Turf & ornamentals
- Plantation crops
Soil Metabolic Enzymes Market segmented by Application:
- Soil treatment
- Foliar
- Seed treatment
- Crop protection
- Compost & residue
Soil Metabolic Enzymes Market by Region:
- North America
- United States
- Canada
- Europe
- Germany
- United Kingdom
- France
- Italy
- Spain
- Asia Pacific
- China
- Japan
- South Korea
- India
- Australia
- Latin America
- Brazil
- Mexico
- Argentina
- Middle East & Africa
- GCC Countries
- South Africa
- Israel
Research Sources and Bibliography
- Food and Agriculture Organization of the United Nations. (2025, March). Standard Operating Procedure for Soil Enzyme Activities.
- USA Department of Agriculture, National Agricultural Statistics Service. (2026, March). US farmers expect to plant less corn and more soybean acres.
- Government of China. (2024, December). China’s 2024 grain output tops 700 mln tonnes, a record high.
- Press Information Bureau, Government of India. (2026, May). Union Minister for Agriculture & Farmers Welfare and Rural Development Shri Shivraj Singh Chouhan today released the Third Advance Estimates of production of major agricultural crops for 2025-26.
- German Federal Statistical Office. (2026, January). 2025 grain and potato harvest: 45 million tons of grain and 14 million tons of potatoes.
- Department for Environment, Food & Rural Affairs. (2025, December). Agricultural Land Use in United Kingdom at 1 June 2025.
- Ministry of Agriculture, Forestry and Fisheries of Japan. (2025, April). First Basic Plan for Food, Agriculture, and Rural Areas reference material.
- Statistics Korea. (2025, July). Final Results of the Cultivated Area and the Production of Barley, Garlic and Onions in 2025.
- Syngenta. (2025, February). Sustainability in agriculture gets a boost with global biologicals partnership.
- Syngenta. (2026, February). From Chile’s Forests to Fields, Syngenta brings botanical-based biofungicide to growers across the Americas.
- Novonesis. (2026, June). Rovensa Next to distribute Novonesis’ biosolutions for Plant Health in the United States.
- Corteva Agriscience. (2025, February). Arable Update February 2025.
- Corteva Agriscience. (2026, April). Agronomy Update April 2026.
- Valent BioSciences. (2025, November). Sustaining Generations Through Bioscience: 2024 Sustainability Report.
- UPL. (2025, April). Sustainability Report 2024-25.
This bibliography is provided for reader reference and uses primary government, standards-body, official trade body, and company sources.
This Report Answers
- What is the expected value of the soil metabolic enzymes market in 2026 and 2036?
- What CAGR is forecast for the soil metabolic enzymes market from 2026 to 2036?
- Which segments shape product type, source, crop type, and application demand?
- Which buyer pressures are expected to support soil enzyme adoption?
- How do country CAGRs differ across the profiled markets?
- Which companies compete across biological portfolios and agronomy service?
- How does FMI validate forecasts and avoid duplicate external statistics?
- What buyer factors should suppliers address before broader account expansion?
- How do field proof and documentation affect supplier selection?
Frequently Asked Questions
Why should executives track the Soil Metabolic Enzymes Market?
Executives should track this market due to the shift from trial-led biological inputs toward documented soil-function programs.
What business problem does the Soil Metabolic Enzymes Market address?
It supports residue breakdown and nutrient-release planning using enzyme products that fit retailer-led agronomy programs. Root-zone activity remains the practical field outcome buyers evaluate.
What should procurement leaders evaluate before selecting suppliers?
Procurement leaders should evaluate product format and microbial source credibility before approval. Batch records and field-trial guidance should match retailer support capacity.
What could limit return on investment for buyers?
Return on investment could be limited by variable field performance and unclear timing guidance. Weak documentation and low retailer training depth also delay broader use.
How should suppliers build executive confidence?
Suppliers build confidence by providing verified field evidence and stable product formats. Clear application instructions and consistent agronomy support help buyers expand programs.
Preview the report firsthand - request a free sample
Get SampleGet the brochure for pricing and purchase details.
Get PDFTable of Content
- Key Takeaways
- Market Size and CAGR
- Top Growth Driver
- Fastest Growing Segment
- Leading Region
- Key Companies
- Emerging Opportunities
- Executive Summary
- Global Market Outlook
- Demand-side Trends
- Supply-side Trends
- Technology Roadmap Analysis
- Analysis and Recommendations
- Analyst Perspective (What is happening? Why now? What should investors know?)
- Key Questions Answered
- How large is the market?
- What is the CAGR?
- What are key trends?
- Which region dominates?
- Who are the leaders?
- Market Overview
- Market Coverage / Taxonomy
- Market Definition / Scope / Limitations
- Research Methodology
- Chapter Orientation
- Analytical Lens and Working Hypotheses
- Market Structure, Signals, and Trend Drivers
- Benchmarking and Cross-market Comparability
- Market Sizing, Forecasting, and Opportunity Mapping
- Research Design and Evidence Framework
- Desk Research Programme (Secondary Evidence)
- Expert Input and Fieldwork (Primary Evidence)
- Tooling, Models, and Reference Databases
- Data Engineering and Model Build
- Quality Assurance and Audit Trail
- Market Background
- Market Dynamics (Drivers, Restraints, Opportunity, Trends)
- Scenario Forecast (Optimistic, Likely, Conservative)
- Impact Analysis
- AI Impact
- Sustainability Impact
- Regulatory Impact
- Technology Impact
- Consumer / Buyer Analysis
- Purchase Drivers
- Adoption Barriers
- Buyer Journey
- Opportunity Map Analysis
- Product Life Cycle Analysis
- Supply Chain Analysis
- Investment Feasibility Matrix
- Value Chain Analysis
- PESTLE and Porter's Analysis
- Regulatory Landscape
- Regional Parent Market Outlook
- Production and Consumption Statistics
- Import and Export Statistics
- Global Market Analysis and Forecast, 2021 to 2036
- Historical Market Size Value (USD Million) & Volume (Unit) Analysis, 2021 to 2025
- Current and Future Market Size Value (USD Million) & Volume (Unit) Projections, 2026 to 2036
- Y-o-Y Growth Trend Analysis
- Absolute $ Opportunity Analysis
- Global Market Pricing Analysis, 2021 to 2036
- Global Market Analysis and Forecast, By Product Type, 2021 to 2036
- Introduction / Key Findings
- Historical Market Size Value (USD Million) & Volume (Unit) Analysis By Product Type, 2021 to 2025
- Current and Future Market Size Value (USD Million) & Volume (Unit) Analysis and Forecast By Product Type, 2026 to 2036
- Powder
- Liquid
- Granular
- Encapsulated
- Water-dispersible
- Powder
- Y-o-Y Growth Trend Analysis By Product Type, 2021 to 2025
- Absolute $ Opportunity Analysis By Product Type, 2026 to 2036
- Global Market Analysis and Forecast, By Source, 2021 to 2036
- Introduction / Key Findings
- Historical Market Size Value (USD Million) & Volume (Unit) Analysis By Source, 2021 to 2025
- Current and Future Market Size Value (USD Million) & Volume (Unit) Analysis and Forecast By Source, 2026 to 2036
- Microbial
- Plant-based
- Enzymatic
- Mineral
- Biochemical
- Microbial
- Y-o-Y Growth Trend Analysis By Source, 2021 to 2025
- Absolute $ Opportunity Analysis By Source, 2026 to 2036
- Global Market Analysis and Forecast, By Crop Type, 2021 to 2036
- Introduction / Key Findings
- Historical Market Size Value (USD Million) & Volume (Unit) Analysis By Crop Type, 2021 to 2025
- Current and Future Market Size Value (USD Million) & Volume (Unit) Analysis and Forecast By Crop Type, 2026 to 2036
- Cereals & grains
- Oilseeds & pulses
- Fruits & vegetables
- Turf & ornamentals
- Plantation crops
- Cereals & grains
- Y-o-Y Growth Trend Analysis By Crop Type, 2021 to 2025
- Absolute $ Opportunity Analysis By Crop Type, 2026 to 2036
- Global Market Analysis and Forecast, By Application, 2021 to 2036
- Introduction / Key Findings
- Historical Market Size Value (USD Million) & Volume (Unit) Analysis By Application, 2021 to 2025
- Current and Future Market Size Value (USD Million) & Volume (Unit) Analysis and Forecast By Application, 2026 to 2036
- Soil treatment
- Foliar
- Seed treatment
- Crop protection
- Compost & residue
- Soil treatment
- Y-o-Y Growth Trend Analysis By Application, 2021 to 2025
- Absolute $ Opportunity Analysis By Application, 2026 to 2036
- Global Market Analysis and Forecast, By Region, 2021 to 2036
- Introduction
- Historical Market Size Value (USD Million) & Volume (Unit) Analysis By Region, 2021 to 2025
- Current Market Size Value (USD Million) & Volume (Unit) Analysis and Forecast By Region, 2026 to 2036
- North America
- Latin America
- Western Europe
- Eastern Europe
- East Asia
- South Asia and Pacific
- Middle East & Africa
- Market Attractiveness Analysis By Region
- North America Market Analysis and Forecast, By Country, 2021 to 2036
- Historical Market Size Value (USD Million) & Volume (Unit) Trend Analysis By Market Taxonomy, 2021 to 2025
- Market Size Value (USD Million) & Volume (Unit) Forecast By Market Taxonomy, 2026 to 2036
- By Country
- USA
- Canada
- Mexico
- By Product Type
- By Source
- By Crop Type
- By Application
- By Country
- Market Attractiveness Analysis
- By Country
- By Product Type
- By Source
- By Crop Type
- By Application
- Key Takeaways
- Latin America Market Analysis and Forecast, By Country
- Historical Market Size Value (USD Million) & Volume (Unit) Trend Analysis By Market Taxonomy, 2021 to 2025
- Market Size Value (USD Million) & Volume (Unit) Forecast By Market Taxonomy, 2026 to 2036
- By Country
- Brazil
- Chile
- Rest of Latin America
- By Product Type
- By Source
- By Crop Type
- By Application
- By Country
- Market Attractiveness Analysis
- By Country
- By Product Type
- By Source
- By Crop Type
- By Application
- Key Takeaways
- Western Europe Market Analysis and Forecast, By Country
- Historical Market Size Value (USD Million) & Volume (Unit) Trend Analysis By Market Taxonomy, 2021 to 2025
- Market Size Value (USD Million) & Volume (Unit) Forecast By Market Taxonomy, 2026 to 2036
- By Country
- Germany
- UK
- Italy
- Spain
- France
- Nordic
- BENELUX
- Rest of Western Europe
- By Product Type
- By Source
- By Crop Type
- By Application
- By Country
- Market Attractiveness Analysis
- By Country
- By Product Type
- By Source
- By Crop Type
- By Application
- Key Takeaways
- Eastern Europe Market Analysis and Forecast, By Country
- Historical Market Size Value (USD Million) & Volume (Unit) Trend Analysis By Market Taxonomy, 2021 to 2025
- Market Size Value (USD Million) & Volume (Unit) Forecast By Market Taxonomy, 2026 to 2036
- By Country
- Russia
- Poland
- Hungary
- Balkan & Baltic
- Rest of Eastern Europe
- By Product Type
- By Source
- By Crop Type
- By Application
- By Country
- Market Attractiveness Analysis
- By Country
- By Product Type
- By Source
- By Crop Type
- By Application
- Key Takeaways
- East Asia Market Analysis and Forecast, By Country
- Historical Market Size Value (USD Million) & Volume (Unit) Trend Analysis By Market Taxonomy, 2021 to 2025
- Market Size Value (USD Million) & Volume (Unit) Forecast By Market Taxonomy, 2026 to 2036
- By Country
- China
- Japan
- South Korea
- By Product Type
- By Source
- By Crop Type
- By Application
- By Country
- Market Attractiveness Analysis
- By Country
- By Product Type
- By Source
- By Crop Type
- By Application
- Key Takeaways
- South Asia and Pacific Market Analysis and Forecast, By Country
- Historical Market Size Value (USD Million) & Volume (Unit) Trend Analysis By Market Taxonomy, 2021 to 2025
- Market Size Value (USD Million) & Volume (Unit) Forecast By Market Taxonomy, 2026 to 2036
- By Country
- India
- ASEAN
- Australia & New Zealand
- Rest of South Asia and Pacific
- By Product Type
- By Source
- By Crop Type
- By Application
- By Country
- Market Attractiveness Analysis
- By Country
- By Product Type
- By Source
- By Crop Type
- By Application
- Key Takeaways
- Middle East & Africa Market Analysis and Forecast, By Country
- Historical Market Size Value (USD Million) & Volume (Unit) Trend Analysis By Market Taxonomy, 2021 to 2025
- Market Size Value (USD Million) & Volume (Unit) Forecast By Market Taxonomy, 2026 to 2036
- By Country
- Kingdom of Saudi Arabia
- Other GCC Countries
- Türkiye
- South Africa
- Other African Union
- Rest of Middle East & Africa
- By Product Type
- By Source
- By Crop Type
- By Application
- By Country
- Market Attractiveness Analysis
- By Country
- By Product Type
- By Source
- By Crop Type
- By Application
- Key Takeaways
- Key Countries Market Analysis
- USA
- Pricing Analysis
- Market Share Analysis, 2025
- By Product Type
- By Source
- By Crop Type
- By Application
- Canada
- Pricing Analysis
- Market Share Analysis, 2025
- By Product Type
- By Source
- By Crop Type
- By Application
- Mexico
- Pricing Analysis
- Market Share Analysis, 2025
- By Product Type
- By Source
- By Crop Type
- By Application
- Brazil
- Pricing Analysis
- Market Share Analysis, 2025
- By Product Type
- By Source
- By Crop Type
- By Application
- Chile
- Pricing Analysis
- Market Share Analysis, 2025
- By Product Type
- By Source
- By Crop Type
- By Application
- Germany
- Pricing Analysis
- Market Share Analysis, 2025
- By Product Type
- By Source
- By Crop Type
- By Application
- UK
- Pricing Analysis
- Market Share Analysis, 2025
- By Product Type
- By Source
- By Crop Type
- By Application
- Italy
- Pricing Analysis
- Market Share Analysis, 2025
- By Product Type
- By Source
- By Crop Type
- By Application
- Spain
- Pricing Analysis
- Market Share Analysis, 2025
- By Product Type
- By Source
- By Crop Type
- By Application
- France
- Pricing Analysis
- Market Share Analysis, 2025
- By Product Type
- By Source
- By Crop Type
- By Application
- India
- Pricing Analysis
- Market Share Analysis, 2025
- By Product Type
- By Source
- By Crop Type
- By Application
- ASEAN
- Pricing Analysis
- Market Share Analysis, 2025
- By Product Type
- By Source
- By Crop Type
- By Application
- Australia & New Zealand
- Pricing Analysis
- Market Share Analysis, 2025
- By Product Type
- By Source
- By Crop Type
- By Application
- China
- Pricing Analysis
- Market Share Analysis, 2025
- By Product Type
- By Source
- By Crop Type
- By Application
- Japan
- Pricing Analysis
- Market Share Analysis, 2025
- By Product Type
- By Source
- By Crop Type
- By Application
- South Korea
- Pricing Analysis
- Market Share Analysis, 2025
- By Product Type
- By Source
- By Crop Type
- By Application
- Russia
- Pricing Analysis
- Market Share Analysis, 2025
- By Product Type
- By Source
- By Crop Type
- By Application
- Poland
- Pricing Analysis
- Market Share Analysis, 2025
- By Product Type
- By Source
- By Crop Type
- By Application
- Hungary
- Pricing Analysis
- Market Share Analysis, 2025
- By Product Type
- By Source
- By Crop Type
- By Application
- Kingdom of Saudi Arabia
- Pricing Analysis
- Market Share Analysis, 2025
- By Product Type
- By Source
- By Crop Type
- By Application
- Türkiye
- Pricing Analysis
- Market Share Analysis, 2025
- By Product Type
- By Source
- By Crop Type
- By Application
- South Africa
- Pricing Analysis
- Market Share Analysis, 2025
- By Product Type
- By Source
- By Crop Type
- By Application
- USA
- Market Structure Analysis
- Competition Dashboard
- Competition Benchmarking
- Market Share Analysis of Top Players
- By Regional
- By Product Type
- By Source
- By Crop Type
- By Application
- Emerging Startups
- Innovation Benchmarking
- Competition Analysis
- Competition Deep Dive
- Bayer Crop Science
- Overview
- Product Portfolio
- Profitability by Market Segments (Product/Region/Sales Channel)
- Sales Footprint
- Strategy Overview
- Marketing Strategy
- Product Strategy
- Channel Strategy
- Syngenta
- BASF
- Corteva Agriscience
- UPL
- Novonesis
- Lallemand Plant Care
- Valent BioSciences
- Bayer Crop Science
- Case Studies
- Success Stories
- Recent Developments
- Competition Deep Dive
- Assumptions & Acronyms Used


