

- Market Size (2026)
- USD 370.0 Mn
- Forecast (2036)
- USD 925.4 Mn
- CAGR (2026 to 2036)
- 9.6%
How big is the Soil Rejuvenation Enzymes Market in 2026?
USD 370.0 million in 2026 and USD 925.4 million by 2036 at a 9.6% CAGR.
Sales of soil rejuvenation enzymes are estimated to rise at 9.6% CAGR through 2036. Valuation is projected to increase from USD 370.0 million in 2026 to USD 925.4 million by 2036. Growers use these inputs to improve nutrient cycling and residue breakdown where soil performance is uneven. In November 2025, FAO reported that about 1.7 billion people lived in areas where human-induced land degradation had reduced crop yields by 10%. This pressure raises interest in verified biological programs and links purchasing decisions to the agricultural enzymes outlook.
India and China are expected to favor products that fit distributor-led field programs and large mixed cropping systems. European accounts are anticipated to place more weight on documented soil effects and repeatable application protocols. Product teams therefore compare enzyme activity against soil type and fertilizer timing before approving broader use. In December 2025, the European Commission reported that 60% to 70% of EU soils were in an unhealthy state. Reported degradation levels keep field evidence close to procurement review because biological responses differ across soil conditions. Formulators examine storage stability and tank compatibility before placing an enzyme product inside an existing crop-input program. Those checks connect soil biological purchases to broader biostimulants market analysis and keep technical service close to commercial renewal.
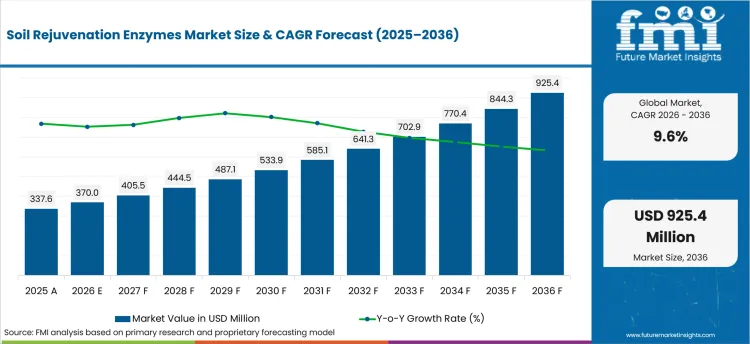
| Metric | Value |
|---|---|
| 2025 Market Size | USD 337.6 million |
| 2026 Market Size | USD 370.0 million |
| 2036 Market Size | USD 925.4 million |
| Forecast CAGR (2026-2036) | 9.6% |
| Product Type Focus | Powder |
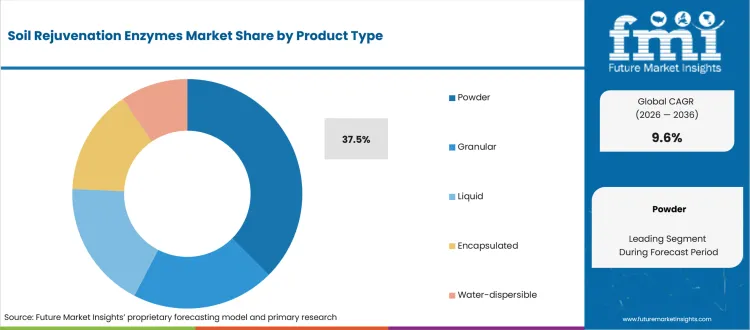
| Powder Share (2026) | 37.5% |
| Source Focus | Microbial |
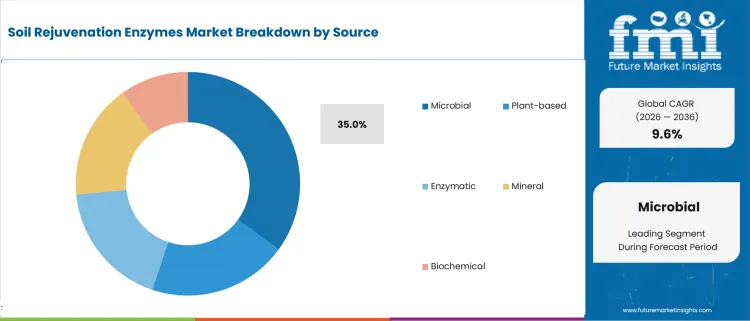
| Microbial Share (2026) | 35.0% |
| Crop Type Focus | Cereals & grains |
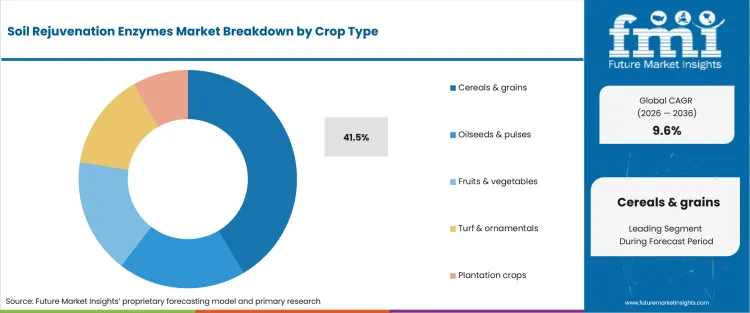
| Cereals & grains Share (2026) | 41.5% |
Summary of the Soil Rejuvenation Enzymes Market
| Market Signal | Commercial Impact |
|---|---|
| Demand and Growth Drivers | Soil performance problems are turning biological inputs into a field-validation purchase.
|
| Product and Segment View | Format and biological source determine how the product fits existing crop-input routines.
|
| Geography and Growth Outlook | Country demand is expected to separate by field-service structure and soil-management policy.
|
| Competitive Landscape | Competition centers on proof of field fit and the supplier’s ability to support repeat use.
|
| Analyst Perspective | Repeat purchasing depends on field protocols that isolate soil response from application error. Supplier service therefore becomes part of product performance.
|
How is the soil rejuvenation enzymes market segmented?
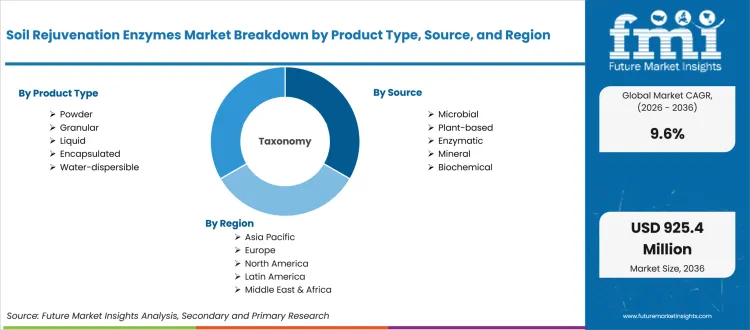
The Soil Rejuvenation Enzymes Market industry is segmented by Product Type, Source, Crop Type, Application, and Region.
The market is assessed by product type and source before crop type and application are compared across regions. Product Type covers Liquid and Granular formats alongside Powder together with Encapsulated and Water-dispersible options. Source categories include Microbial and Plant-based inputs alongside Enzymatic formats together with Mineral and Biochemical products. Crop Type spans Cereals & grains and Oilseeds & pulses before adding Fruits & vegetables alongside Turf & ornamentals and Plantation crops. Application analysis covers Soil treatment and Foliar use before adding Seed treatment alongside Crop protection and Compost & residue. Regional comparisons close the scope and connect soil enzyme programs with the biofertilizer market scope across neighboring biological input categories.
What supports demand for Powder within the Product Type category?
Powder formats are evaluated on flowability and shelf handling because dry products must reach farms without losing viable activity. Lallemand Plant Care’s August 2025 LALRISE SHINE DS label specifies application rates from 0.2 to 9.0 dry ounces per 100 pounds of seed. A measured dosing range helps seed treatment teams control application while retaining a dry handling route. The operating fit places powder choices near seed treatment materials demand where dry dosing and storage discipline shape commercial use.
- By product type, powder is estimated to hold 37.5% share in 2026 because dry handling suits seed treatment and distributor inventory routines. In February 2025, Syngenta announced a biologicals production facility in South Carolina alongside acquired natural-product and genetic-strain assets. Larger supply programs increase the value of batch control and storage instructions for powder products.
- Seed treatment teams and crop-input distributors evaluate powder products by dosing accuracy and storage discipline before broad release. In April 2025, Corteva said it had added six products for United Kingdom farmers during the preceding 12 months. Broader input portfolios increase the need for format guidance that helps field teams apply biological products without confusing rates or handling steps.
How does Microbial sourcing shape purchasing within the Source category?
Microbial products depend on viable organisms and consistent fermentation control, so source selection affects both storage and field response. In February 2025, Novonesis reported 8% organic sales growth for 2024 across its biosolutions business. Commercial scale explains why microbial platforms need repeatable production and technical support as use expands. Procurement teams therefore examine strain identity and storage limits while comparing the agricultural microbials outlook.
- In 2026, microbial is projected to account for 35.0% share due to the breadth of microbial products used in soil and plant programs. In October 2025, EPA reported that it had registered 15 new biopesticide active ingredients since January. Registration activity increases the need for clear strain records and use instructions during supplier qualification.
- Agronomists and distributors examine microbial options by crop fit and application timing before adding them to existing input programs. In February 2025, Syngenta and Ceres Biotics signed an agreement to expand access to VIXERAN. The partnership shows how biological nutrient tools are paired with technical guidance when growers seek better nitrogen-use performance.
What keeps Cereals & grains relevant within the Crop Type category?
Cereal programs expose soil products to broad-acre timing and repeated field comparison across large planted areas. In November 2025, Syngenta and Amoéba signed a memorandum to develop biological crop protection for cereals and field crops in the EU and United Kingdom. The collaboration keeps biological performance under crop-specific testing before products move into routine commercial release across field programs. Enzyme programs face similar scrutiny when agronomists compare them with fertilizer market context alongside existing nutrient schedules and field timing requirements.
- Cereals & grains are forecast to represent 41.5% share in 2026 because broad-acre programs reward products that fit established nutrient plans. In March 2025, USDA NASS estimated all wheat planted area for 2025 at 45.4 million acres. The scale makes small application errors costly and keeps dose guidance central during soil enzyme evaluation.
- Growers and agronomy teams evaluate cereal-focused products against field timing and compatibility with existing nutrient programs. Suppliers gain broader consideration when trial instructions separate product effects from weather or soil variation. Clear field guidance helps distributors support repeat application by linking dose instructions with seasonal nutrient plans.
What are the drivers, restraints, and opportunities in the soil rejuvenation enzymes market?
Soil degradation raises demand, variable biological persistence slows repeat use, and field-guided soil programs create an adoption route.
- Driver: Soil degradation is expected to raise demand for biological inputs that support nutrient cycling and soil function under documented field protocols.
- Restraint: Variable persistence is anticipated to slow repeat use when products lack soil-specific timing guidance and storage controls.
- Opportunity: Adviser-led soil programs are projected to create scale routes for enzyme products that fit existing nutrient and conservation practices.
Land degradation is expected to keep soil function inside crop-input decisions where growers face weaker productivity or uneven nutrient response. In June 2025, FAO reported that 1.66 billion hectares were degraded by human activity and more than 60% of that area was agricultural land. The scale of the problem broadens interest in tools that support nutrient cycling and residue breakdown under measured field programs. Commercial adoption is expected to depend on measured field results and links to silicon soil conditioner demand.
Biological activity is expected to weaken before the next planned application under some field conditions, which makes persistence a practical purchasing constraint. Lallemand Plant Care reported in February 2026 that many microbial active ingredients used in soil or growing media had a persistence window of 2 to 12 weeks. Soil conditions and crop management practices influence that persistence window across different application schedules and production systems. Procurement teams are therefore expected to ask for storage limits and application timing before approving repeat use across several farms.
Farm programs that already track soil practices provide a realistic route for enzyme products because advisers define trial conditions and follow-up timing. In June 2025, USDA ERS reported that 14.1% of USA farms recorded both cover crops and conservation tillage in 2022. The combined practice base creates a clear review point for compatible biological inputs inside established nutrient and conservation routines. Suppliers are expected to connect trial protocols with humic and fulvic acid biostimulants while keeping recommendations inside existing nutrient plans.
Which country CAGRs are profiled in the soil rejuvenation enzymes market?
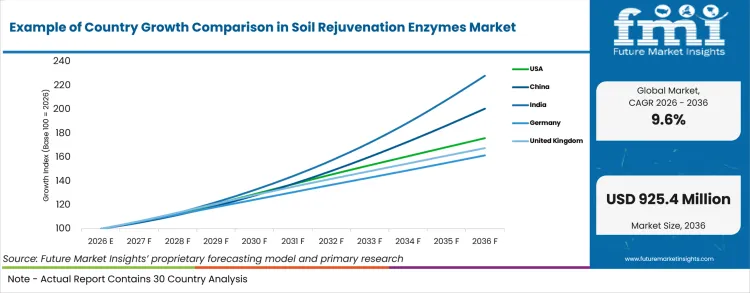
| Country | CAGR |
|---|---|
| United States | 5.8% |
| China | 7.2% |
| India | 8.6% |
| Germany | 4.9% |
| United Kingdom | 5.3% |
| Japan | 4.1% |
| South Korea | 5.6% |
Source: FMI's proprietary forecasting model and primary research
How do country-level CAGRs compare in the soil rejuvenation enzymes market?
Country growth is expected to differ according to soil-management policy and the strength of local advisory channels. India and China are projected to rely on scale programs and field support when biological inputs move beyond trial use. European markets are anticipated to place more weight on documented soil effects and repeatable application protocols. In July 2025, the OECD-FAO Agricultural Outlook projected global agricultural and fish production to expand by about 14% over the next decade. Higher output expectations keep soil productivity inside farm planning and connect country adoption patterns to the plant growth regulators market.
- Large row-crop acreage keeps soil input trials close to nutrient timing and field-scale economics in the United States. The United States is projected to record 5.8% CAGR through 2036 as agronomy teams compare field response against established crop programs. In January 2025, USDA NASS reported that USA corn growers produced 14.9 billion bushels in 2024. The production base means a soil enzyme product must fit large application windows without creating extra passes. USDA-linked advisers and local retailers influence trial design across commercial farms by translating product claims into practical soil and timing recommendations.
- China is building agricultural technology programs around arable land quality and lower-input production methods that influence product testing and adviser training. Local product adoption depends on province-level demonstration work and distributor training that explains crop fit across different soil management systems. Demand for soil rejuvenation enzymes in China is forecast to rise at 7.2% CAGR through 2036. In February 2025, the State Council reported ministry guidelines covering 10 priority areas for agricultural technology innovation from 2024 to 2028. Arable land quality and lower-carbon agriculture are explicit parts of that program and provide a policy context for biological product evaluation.
- India’s soil-testing infrastructure gives advisers a practical route for linking biological inputs to field recommendations. Cooperatives and retailers need products that work across varied soils and farmer practices without adding difficult steps to seasonal field schedules. Local validation therefore carries more weight than broad product claims when advisers compare repeat use across different districts and crop systems. India is anticipated to post 8.6% CAGR through 2036 under these adviser-led testing and purchasing conditions. In August 2025, PIB reported that more than 250 million Soil Health Cards had been distributed by July. The program gives local agronomists a common diagnostic reference for matching product guidance with soil condition and nutrient planning. Procurement teams are expected to compare enzyme claims with local test results and prefer suppliers that provide simple dose guidance for field advisers.
- Germany’s soil-input market operates inside a documented farm-management culture and a sizable organic production base that rewards traceable application practices. Germany is estimated to expand at 4.9% CAGR through 2036 as agronomists screen biological inputs for repeatable field performance. In August 2025, the Thünen Institute reported about 1.99 million hectares farmed under organic standards at the end of 2024. The area gives biological inputs a clear evaluation environment and raises expectations for traceability across field trials and repeat supply decisions.
- United Kingdom growers are placing more attention on soil condition records when they review nutrient decisions and plan future input trials. Agronomists therefore need products that connect field instructions with a measurable soil-management objective across sampling and follow-up review cycles. The United Kingdom is projected to record 5.3% CAGR through 2036 under these evidence-led purchasing conditions. In June 2026, the government Farm Practices Survey reported that 65% of farmers tracked the organic content of their soil. The monitoring habit supports structured enzyme trials and raises expectations for evidence that advisers apply during repeat purchasing reviews and seasonal nutrient planning.
- Japan combines intensive crop management with policy support for lower-impact production systems that require careful product positioning and adviser guidance. Local cooperatives often influence input selection and field guidance across crop programs that depend on precise seasonal application schedules. Biological products therefore need a clear use case inside existing crop plans before advisers recommend repeat application across additional fields. Japan is forecast to register 4.1% CAGR through 2036 under these crop-management and policy conditions. MAFF reported in September 2025 that policy aims to place 63,000 hectares under organic agriculture by 2030. The target broadens the testing environment for soil biological inputs that need clear positioning inside local crop-management programs.
- South Korea is anticipated to grow at 5.6% CAGR through 2036 under these technology-led evaluation conditions.South Korea is linking farm modernization with technology verification and labor-saving systems that depend on measurable field instructions and repeatable support. MAFRA published a smart-farming master plan in February 2025 that targets 35% of the nation’s 55,000-hectare greenhouse area for smart farms. Field crop programs depend on measurable instructions that local advisers repeat consistently across sites and fit into existing input schedules. Soil enzyme products enter this environment through trials that align with farm technology plans and established crop-input schedules across commercial sites.
Who are the notable companies in the soil rejuvenation enzymes market?
Bayer, Syngenta, BASF, Corteva Agriscience, Novonesis, UPL, Sumitomo Biorational, and Lallemand Plant Care are the notable companies shaping this market.
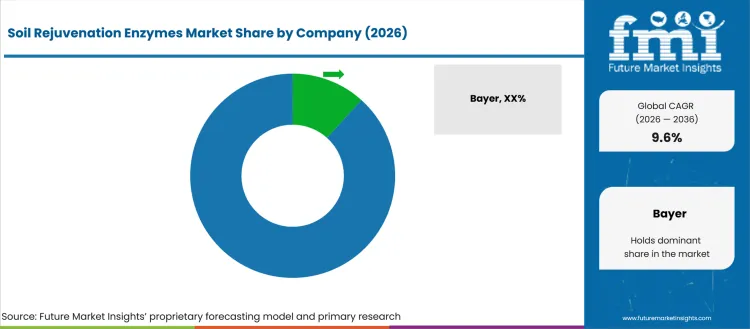
Competition is expected to separate around strain quality and formulation stability alongside the ability to support field trials after sale. Technical teams compare products by crop fit and application timing before they approve repeat use. In March 2026, JNCC reported a 61.9% score for sampled English arable soils on sustainable crop provision. Measured soil condition illustrates why site context must be understood before product performance is judged. Suppliers are therefore expected to compete on trial design and troubleshooting while neighboring bioinsecticides market demand keeps biological portfolio comparisons active.
- Portfolio breadth gives Bayer and BASF access to agronomy teams that already manage seed treatment and crop protection choices across established farm accounts. Both companies are expected to compete by linking soil biological offers with field protocols that support crop-fit reviews and follow-up service after initial trials.
- Microbial know-how shapes competition for Novonesis and Lallemand Plant Care when customers need products built around living organisms and controlled fermentation. Agronomists are expected to separate the two suppliers by strain handling guidance and formulation stability alongside storage instructions and response support.
- Corteva Agriscience and UPL compete where channel access and portfolio integration influence how advisers introduce biological products into seasonal crop programs. Commercial reviews are anticipated to compare distributor training and agronomy support alongside product fit with existing nutrient and crop-protection schedules.
- Regional field access creates another competitive route for Syngenta and Sumitomo Biorational across accounts that expect biological tools and practical application support. Procurement teams are projected to inspect local registration status and technical response routes before extending supply agreements across additional crop programs.
Competitive Benchmarking: Soil Rejuvenation Enzymes Market
| Company | Biological Portfolio Fit | Soil and Root Relevance | Field Support Model | Geographic Reach |
|---|---|---|---|---|
| Bayer | High | High | Integrated agronomy | Global |
| Syngenta | High | High | Field and channel support | Global |
| BASF | High | High | Seed treatment support | Global |
| Corteva Agriscience | High | Medium | Program-led agronomy | Global |
| Novonesis | High | High | Technical biosolutions support | Global |
| UPL | High | High | Distributor and farm programs | Global |
| Sumitomo Biorational | High | Medium | Specialty crop technical support | Global |
| Lallemand Plant Care | High | High | Microbial application support | Global |
Source: Future Market Insights competitive analysis, 2026. Ratings reflect relative portfolio relevance and workflow fit. Service capability and geographic reach shape the remaining comparison.
Key Developments in the Soil Rejuvenation Enzymes Market
- In June 2025, Syngenta accelerated the rollout of its nature-inspired biological solutions across its agricultural platform. The company linked the expansion to a broader biological portfolio and an active research pipeline across crop applications. For soil-input programs the commercial implication is wider channel exposure for biological tools that require field-specific application support.
- In July 2025, Bayer signed a development and distribution agreement with M2i Group for pheromone gels across Asia-Pacific and Latin America. The agreement extended exclusive distribution rights to the United States as part of the same commercial program. Expanded channel access reinforces the value of local application support when biological tools are added to existing crop programs.
- In November 2025, BASF received French registration for Integral® Pro as a biological fungicide seed treatment for sunflower. The product uses a beneficial bacterium that acts around the seed and rootlet zone during early crop establishment. Crop-specific registration shows how biological products move through technical review before wider use across commercial seed treatment programs.
- In November 2025, Sumitomo Biorational formed a strategic partnership with Seipasa to commercialize new biostimulant products in the United States. Seipasa named the company as its exclusive United States partner for the new commercial program. The agreement extends a specialty biological route where technical support and crop positioning influence repeat adoption.
Key Players in the Soil Rejuvenation Enzymes Market
Integrated crop-input companies
- Bayer
- Syngenta
- BASF
- Corteva Agriscience
- UPL
Biosolutions specialists
- Novonesis
- Sumitomo Biorational
- Lallemand Plant Care
Soil Rejuvenation Enzymes Market - Report Scope
| Coverage field | Report scope |
|---|---|
| Market breakdown | Product Type, Source, Crop Type, Application, and Region. |
| Market Definition | Enzyme and enzyme-linked biological inputs used to support soil nutrient cycling, residue breakdown, root-zone activity, and soil function in crop production. |
| Regions Covered | North America, Latin America, Western Europe, Eastern Europe, East Asia, South Asia and Pacific, and Middle East and Africa. |
| Countries Covered | United States, Canada, Brazil, Mexico, Argentina, Germany, United Kingdom, France, Italy, Spain, Poland, Romania, Hungary, Czech Republic, China, Japan, South Korea, India, Thailand, Indonesia, Australia, New Zealand, GCC Countries, South Africa, and Turkey. |
| Key Companies Profiled | Bayer, Syngenta, BASF, Corteva Agriscience, Novonesis, UPL, Sumitomo Biorational, and Lallemand Plant Care. |
| Forecast Period | 2026 to 2036. |
| Approach | Hybrid bottom-up and top-down market sizing supported by primary research and evidence triangulation. |
Source: Future Market Insights - analysis driven by proprietary forecasting models and primary research
Soil Rejuvenation Enzymes Market - Research Methodology
| Method | Approach |
|---|---|
| Primary Research | Interviews with formulators, distributors, agronomists, crop-input retailers, and technical procurement teams to test buying criteria and adoption barriers. |
| Desk Research | Review of official statistics, regulator material, company filings, product documents, policy releases, and trade-body material. |
| Market Sizing and Forecasting | Bottom-up demand estimates by segment and country were reconciled with top-down market checks and adoption assumptions. |
| Data Validation | Forecast inputs were triangulated across primary interviews, official evidence, company disclosures, and internal modelling before final review. |
Soil Rejuvenation Enzymes Market by Segments
Soil Rejuvenation Enzymes Market segmented by Product Type:
- Liquid
- Granular
- Powder
- Encapsulated
- Water-dispersible
Soil Rejuvenation Enzymes Market segmented by Source:
- Microbial
- Plant-based
- Enzymatic
- Mineral
- Biochemical
Soil Rejuvenation Enzymes Market segmented by Crop Type:
- Cereals & grains
- Oilseeds & pulses
- Fruits & vegetables
- Turf & ornamentals
- Plantation crops
Soil Rejuvenation Enzymes Market segmented by Application:
- Soil treatment
- Foliar
- Seed treatment
- Crop protection
- Compost & residue
Soil Rejuvenation Enzymes Market by Region:
- North America
- United States
- Canada
- Latin America
- Brazil
- Mexico
- Argentina
- Western Europe
- Germany
- United Kingdom
- France
- Italy
- Spain
- Eastern Europe
- Poland
- Romania
- Hungary
- Czech Republic
- East Asia
- China
- Japan
- South Korea
- South Asia and Pacific
- India
- Thailand
- Indonesia
- Australia
- New Zealand
- Middle East and Africa
- GCC Countries
- South Africa
- Turkey
Research Sources and Bibliography
- Food and Agriculture Organization of the United Nations. (2025, November). FAO report: 1.7 billion people experience lower crop yields due to land degradation. FAO.
- European Commission. (2025, December). First EU law on soil set to enter into force. Directorate-General for Environment.
- UPL Limited. (2025, May). Capital Markets Day 2025 transcript. UPL Limited.
- Lallemand Plant Care. (2025, August). LALRISE SHINE DS: PLANTER BOX TREATMENT. Lallemand Plant Care.
- Syngenta. (2025, February). Syngenta strengthens global leadership in agricultural biologicals. Syngenta.
- Corteva Agriscience. (2025, April). Corteva Agriscience set to celebrate year of innovation at Cereals 2025. Corteva Agriscience.
- Novonesis. (2025, February). Novonesis delivers strong full-year results and expects continued growth in 2025. Novonesis.
- USA Environmental Protection Agency. (2025, October). EPA Announces Proposed Registration of New Biopesticide and Biopesticides Webpage. USA EPA.
- Syngenta. (2025, February). Sustainability in agriculture gets a boost with global biologicals partnership. Syngenta.
- Syngenta. (2025, November). A natural breakthrough in protecting cereals and field crops. Syngenta.
- USA Department of Agriculture, National Agricultural Statistics Service. (2025, March). US farmers expect to plant more corn and less soybean acres. USDA NASS.
- Food and Agriculture Organization of the United Nations. (2025, June). FAO study reveals alarming agricultural land degradation in the Arab region. FAO.
- Lallemand Plant Care. (2026, February). Understanding microbial biofungicides and how to use them effectively. Lallemand Plant Care.
- USA Department of Agriculture, Economic Research Service. (2025, June). Economic Outcomes of Soil Health and Conservation Practices on USA Cropland. USDA ERS.
- Organisation for Economic Co-operation and Development and Food and Agriculture Organization of the United Nations. (2025, July). OECD-FAO Agricultural Outlook 2025-2034. OECD Publishing.
- USA Department of Agriculture, National Agricultural Statistics Service. (2025, January). Crop Production 2024 Summary. USDA NASS.
- State Council of the People’s Republic of China. (2025, February). Tech to play growing role in agriculture. The State Council of the People’s Republic of China.
- Press Information Bureau. (2025, August). “Swasth Dharaa, Khet Haraa” Over 25 Crore Soil Health Cards Distributed Across the Country. Government of India.
- Thünen Institute. (2025, August). Organic farming in figures. Thünen Institute.
- Department for Environment, Food & Rural Affairs. (2026, June). Nutrient management. GOV.UK.
- Ministry of Agriculture, Forestry and Fisheries. (2025, September). The Situation Surrounding Organic Agriculture in Japan. MAFF.
- Ministry of Agriculture, Food and Rural Affairs. (2025, February). S. Korea’s First Master Plan for Promotion of the Growth of the Smart-Farming Industry for the Years 2025-2029. MAFRA.
- Joint Nature Conservation Committee. (2026, March). Indicators of soil health for England. JNCC.
- Syngenta. (2025, June). Syngenta to become global leader in biologicals; expanding nature inspired solutions for farmers. Syngenta.
- Bayer. (2025, July). Bayer to expand partnership with M2i Group to distribute pheromone-based biological crop protection solutions globally. Bayer.
- BASF. (2025, November). BASF announces Integral® Pro for Sunflowers is registered in France. BASF.
- Sumitomo Biorational. (2025, November). Sumitomo Biorational and Seipasa Form Strategic Partnership to Bring Novel Biostimulant Products to the USA Market. Sumitomo Biorational.
This bibliography is provided for reader reference and uses primary government sources, standards-body references, official trade bodies, and company sources.
This Report Answers
- What value is projected for the Soil Rejuvenation Enzymes Market in 2026 and by 2036?
- What CAGR is forecast for the market during the 2026 to 2036 assessment period?
- How are Product Type, Source, Crop Type, and Application used to segment demand?
- Which soil-management problems are expected to support adoption of soil rejuvenation enzymes?
- How are country CAGR differences linked to advisory systems and local soil-management programs?
- Which competitive dimensions separate integrated crop-input companies from biosolutions specialists?
- How does FMI validate the forecast using bottom-up and top-down market checks?
- What should procurement teams review before adding a soil enzyme product to existing crop programs?
- How do field protocols and soil documentation affect repeat purchasing across commercial accounts?
Frequently Asked Questions
What is driving growth in the Soil Rejuvenation Enzymes Market?
Growth is expected to come from growers seeking better nutrient cycling and residue management under documented field programs. Adoption is projected to expand when suppliers provide crop-specific dosing and technical support that makes trial results easier to repeat.
Who are the key players in the Soil Rejuvenation Enzymes Market?
Key players include Bayer, Syngenta, BASF, Corteva Agriscience, Novonesis, UPL, Sumitomo Biorational, and Lallemand Plant Care. Competition centers on biological portfolio fit and field support that agronomy teams use across different crop programs.
What is a significant restraint in the Soil Rejuvenation Enzymes Market?
A practical restraint is variable biological performance across soil conditions and differences in application timing between field programs. Purchasers are expected to delay repeat use when suppliers cannot define storage limits and field protocols clearly.
Why should executives track the Soil Rejuvenation Enzymes Market?
Executives should track the market because soil biological programs affect input planning and advisory requirements across crop portfolios. Management teams are expected to review whether biological purchases improve field performance without adding unmanageable application complexity.
What business problem does the Soil Rejuvenation Enzymes Market address?
The market addresses uneven nutrient cycling and residue breakdown where soil performance limits crop planning. Soil rejuvenation enzymes support biological processes that agronomy teams evaluate alongside fertilizer timing and broader soil-management practices.
What should procurement leaders evaluate before selecting suppliers?
Procurement leaders should examine formulation stability and strain or enzyme identity alongside crop-specific application guidance. Supplier evaluation should also cover storage instructions and technical response routes when field results differ from expectations.
What limits return on investment for purchasers?
Return weakens when field conditions are poorly defined or application timing varies across trial sites. Purchasers are expected to see slower payback when product effects cannot be separated from weather or soil differences.
How do suppliers build long-term account confidence?
Suppliers build account confidence by providing repeatable field protocols and clear product documentation before broad rollout. Long-term purchasing is expected to depend on batch consistency and practical troubleshooting support after commercial use begins.
Preview the report firsthand - request a free sample
Get SampleGet the brochure for pricing and purchase details.
Get PDFTable of Content
- Key Takeaways
- Market Size and CAGR
- Top Growth Driver
- Fastest Growing Segment
- Leading Region
- Key Companies
- Emerging Opportunities
- Executive Summary
- Global Market Outlook
- Demand-side Trends
- Supply-side Trends
- Technology Roadmap Analysis
- Analysis and Recommendations
- Analyst Perspective (What is happening? Why now? What should investors know?)
- Key Questions Answered
- How large is the market?
- What is the CAGR?
- What are key trends?
- Which region dominates?
- Who are the leaders?
- Market Overview
- Market Coverage / Taxonomy
- Market Definition / Scope / Limitations
- Research Methodology
- Chapter Orientation
- Analytical Lens and Working Hypotheses
- Market Structure, Signals, and Trend Drivers
- Benchmarking and Cross-market Comparability
- Market Sizing, Forecasting, and Opportunity Mapping
- Research Design and Evidence Framework
- Desk Research Programme (Secondary Evidence)
- Expert Input and Fieldwork (Primary Evidence)
- Tooling, Models, and Reference Databases
- Data Engineering and Model Build
- Quality Assurance and Audit Trail
- Market Background
- Market Dynamics (Drivers, Restraints, Opportunity, Trends)
- Scenario Forecast (Optimistic, Likely, Conservative)
- Impact Analysis
- AI Impact
- Sustainability Impact
- Regulatory Impact
- Technology Impact
- Consumer / Buyer Analysis
- Purchase Drivers
- Adoption Barriers
- Buyer Journey
- Opportunity Map Analysis
- Product Life Cycle Analysis
- Supply Chain Analysis
- Investment Feasibility Matrix
- Value Chain Analysis
- PESTLE and Porter's Analysis
- Regulatory Landscape
- Regional Parent Market Outlook
- Production and Consumption Statistics
- Import and Export Statistics
- Global Market Analysis and Forecast, 2021 to 2036
- Historical Market Size Value (USD Million) Analysis, 2021 to 2025
- Current and Future Market Size Value (USD Million) Projections, 2026 to 2036
- Y-o-Y Growth Trend Analysis
- Absolute $ Opportunity Analysis
- Global Market Pricing Analysis, 2021 to 2036
- Global Market Analysis and Forecast, By Product Type, 2021 to 2036
- Introduction / Key Findings
- Historical Market Size Value (USD Million) Analysis By Product Type, 2021 to 2025
- Current and Future Market Size Value (USD Million) Analysis and Forecast By Product Type, 2026 to 2036
- Powder
- Granular
- Liquid
- Encapsulated
- Water-dispersible
- Powder
- Y-o-Y Growth Trend Analysis By Product Type, 2021 to 2025
- Absolute $ Opportunity Analysis By Product Type, 2026 to 2036
- Global Market Analysis and Forecast, By Source, 2021 to 2036
- Introduction / Key Findings
- Historical Market Size Value (USD Million) Analysis By Source, 2021 to 2025
- Current and Future Market Size Value (USD Million) Analysis and Forecast By Source, 2026 to 2036
- Microbial
- Plant-based
- Enzymatic
- Mineral
- Biochemical
- Microbial
- Y-o-Y Growth Trend Analysis By Source, 2021 to 2025
- Absolute $ Opportunity Analysis By Source, 2026 to 2036
- Global Market Analysis and Forecast, By Crop Type, 2021 to 2036
- Introduction / Key Findings
- Historical Market Size Value (USD Million) Analysis By Crop Type, 2021 to 2025
- Current and Future Market Size Value (USD Million) Analysis and Forecast By Crop Type, 2026 to 2036
- Cereals & grains
- Oilseeds & pulses
- Fruits & vegetables
- Turf & ornamentals
- Plantation crops
- Cereals & grains
- Y-o-Y Growth Trend Analysis By Crop Type, 2021 to 2025
- Absolute $ Opportunity Analysis By Crop Type, 2026 to 2036
- Global Market Analysis and Forecast, By Application, 2021 to 2036
- Introduction / Key Findings
- Historical Market Size Value (USD Million) Analysis By Application, 2021 to 2025
- Current and Future Market Size Value (USD Million) Analysis and Forecast By Application, 2026 to 2036
- Soil treatment
- Foliar
- Seed treatment
- Crop protection
- Compost & residue
- Soil treatment
- Y-o-Y Growth Trend Analysis By Application, 2021 to 2025
- Absolute $ Opportunity Analysis By Application, 2026 to 2036
- Global Market Analysis and Forecast, By Region, 2021 to 2036
- Introduction
- Historical Market Size Value (USD Million) Analysis By Region, 2021 to 2025
- Current Market Size Value (USD Million) Analysis and Forecast By Region, 2026 to 2036
- North America
- Latin America
- Western Europe
- Eastern Europe
- East Asia
- South Asia and Pacific
- Middle East & Africa
- Market Attractiveness Analysis By Region
- North America Market Analysis and Forecast, By Country, 2021 to 2036
- Historical Market Size Value (USD Million) Trend Analysis By Market Taxonomy, 2021 to 2025
- Market Size Value (USD Million) Forecast By Market Taxonomy, 2026 to 2036
- By Country
- USA
- Canada
- By Product Type
- By Source
- By Crop Type
- By Application
- By Country
- Market Attractiveness Analysis
- By Country
- By Product Type
- By Source
- By Crop Type
- By Application
- Key Takeaways
- Latin America Market Analysis and Forecast, By Country
- Historical Market Size Value (USD Million) Trend Analysis By Market Taxonomy, 2021 to 2025
- Market Size Value (USD Million) Forecast By Market Taxonomy, 2026 to 2036
- By Country
- Brazil
- Mexico
- Chile
- Rest of Latin America
- By Product Type
- By Source
- By Crop Type
- By Application
- By Country
- Market Attractiveness Analysis
- By Country
- By Product Type
- By Source
- By Crop Type
- By Application
- Key Takeaways
- Western Europe Market Analysis and Forecast, By Country
- Historical Market Size Value (USD Million) Trend Analysis By Market Taxonomy, 2021 to 2025
- Market Size Value (USD Million) Forecast By Market Taxonomy, 2026 to 2036
- By Country
- Germany
- UK
- Italy
- Spain
- France
- Nordic
- BENELUX
- Rest of Western Europe
- By Product Type
- By Source
- By Crop Type
- By Application
- By Country
- Market Attractiveness Analysis
- By Country
- By Product Type
- By Source
- By Crop Type
- By Application
- Key Takeaways
- Eastern Europe Market Analysis and Forecast, By Country
- Historical Market Size Value (USD Million) Trend Analysis By Market Taxonomy, 2021 to 2025
- Market Size Value (USD Million) Forecast By Market Taxonomy, 2026 to 2036
- By Country
- Russia
- Poland
- Hungary
- Balkan & Baltic
- Rest of Eastern Europe
- By Product Type
- By Source
- By Crop Type
- By Application
- By Country
- Market Attractiveness Analysis
- By Country
- By Product Type
- By Source
- By Crop Type
- By Application
- Key Takeaways
- East Asia Market Analysis and Forecast, By Country
- Historical Market Size Value (USD Million) Trend Analysis By Market Taxonomy, 2021 to 2025
- Market Size Value (USD Million) Forecast By Market Taxonomy, 2026 to 2036
- By Country
- China
- Japan
- South Korea
- By Product Type
- By Source
- By Crop Type
- By Application
- By Country
- Market Attractiveness Analysis
- By Country
- By Product Type
- By Source
- By Crop Type
- By Application
- Key Takeaways
- South Asia and Pacific Market Analysis and Forecast, By Country
- Historical Market Size Value (USD Million) Trend Analysis By Market Taxonomy, 2021 to 2025
- Market Size Value (USD Million) Forecast By Market Taxonomy, 2026 to 2036
- By Country
- India
- ASEAN
- Australia & New Zealand
- Rest of South Asia and Pacific
- By Product Type
- By Source
- By Crop Type
- By Application
- By Country
- Market Attractiveness Analysis
- By Country
- By Product Type
- By Source
- By Crop Type
- By Application
- Key Takeaways
- Middle East & Africa Market Analysis and Forecast, By Country
- Historical Market Size Value (USD Million) Trend Analysis By Market Taxonomy, 2021 to 2025
- Market Size Value (USD Million) Forecast By Market Taxonomy, 2026 to 2036
- By Country
- Kingdom of Saudi Arabia
- Other GCC Countries
- Türkiye
- South Africa
- Other African Union
- Rest of Middle East & Africa
- By Product Type
- By Source
- By Crop Type
- By Application
- By Country
- Market Attractiveness Analysis
- By Country
- By Product Type
- By Source
- By Crop Type
- By Application
- Key Takeaways
- Key Countries Market Analysis
- USA
- Pricing Analysis
- Market Share Analysis, 2025
- By Product Type
- By Source
- By Crop Type
- By Application
- Canada
- Pricing Analysis
- Market Share Analysis, 2025
- By Product Type
- By Source
- By Crop Type
- By Application
- Mexico
- Pricing Analysis
- Market Share Analysis, 2025
- By Product Type
- By Source
- By Crop Type
- By Application
- Brazil
- Pricing Analysis
- Market Share Analysis, 2025
- By Product Type
- By Source
- By Crop Type
- By Application
- Chile
- Pricing Analysis
- Market Share Analysis, 2025
- By Product Type
- By Source
- By Crop Type
- By Application
- Germany
- Pricing Analysis
- Market Share Analysis, 2025
- By Product Type
- By Source
- By Crop Type
- By Application
- UK
- Pricing Analysis
- Market Share Analysis, 2025
- By Product Type
- By Source
- By Crop Type
- By Application
- Italy
- Pricing Analysis
- Market Share Analysis, 2025
- By Product Type
- By Source
- By Crop Type
- By Application
- Spain
- Pricing Analysis
- Market Share Analysis, 2025
- By Product Type
- By Source
- By Crop Type
- By Application
- France
- Pricing Analysis
- Market Share Analysis, 2025
- By Product Type
- By Source
- By Crop Type
- By Application
- India
- Pricing Analysis
- Market Share Analysis, 2025
- By Product Type
- By Source
- By Crop Type
- By Application
- ASEAN
- Pricing Analysis
- Market Share Analysis, 2025
- By Product Type
- By Source
- By Crop Type
- By Application
- Australia & New Zealand
- Pricing Analysis
- Market Share Analysis, 2025
- By Product Type
- By Source
- By Crop Type
- By Application
- China
- Pricing Analysis
- Market Share Analysis, 2025
- By Product Type
- By Source
- By Crop Type
- By Application
- Japan
- Pricing Analysis
- Market Share Analysis, 2025
- By Product Type
- By Source
- By Crop Type
- By Application
- South Korea
- Pricing Analysis
- Market Share Analysis, 2025
- By Product Type
- By Source
- By Crop Type
- By Application
- Russia
- Pricing Analysis
- Market Share Analysis, 2025
- By Product Type
- By Source
- By Crop Type
- By Application
- Poland
- Pricing Analysis
- Market Share Analysis, 2025
- By Product Type
- By Source
- By Crop Type
- By Application
- Hungary
- Pricing Analysis
- Market Share Analysis, 2025
- By Product Type
- By Source
- By Crop Type
- By Application
- Kingdom of Saudi Arabia
- Pricing Analysis
- Market Share Analysis, 2025
- By Product Type
- By Source
- By Crop Type
- By Application
- Türkiye
- Pricing Analysis
- Market Share Analysis, 2025
- By Product Type
- By Source
- By Crop Type
- By Application
- South Africa
- Pricing Analysis
- Market Share Analysis, 2025
- By Product Type
- By Source
- By Crop Type
- By Application
- USA
- Market Structure Analysis
- Competition Dashboard
- Competition Benchmarking
- Market Share Analysis of Top Players
- By Regional
- By Product Type
- By Source
- By Crop Type
- By Application
- Emerging Startups
- Innovation Benchmarking
- Competition Analysis
- Competition Deep Dive
- Bayer
- Overview
- Product Portfolio
- Profitability by Market Segments
- Sales Footprint
- Strategy Overview
- Marketing Strategy
- Product Strategy
- Channel Strategy
- Syngenta
- BASF
- Corteva Agriscience
- Novonesis
- UPL
- Sumitomo Biorational
- Lallemand Plant Care
- Bayer
- Case Studies
- Success Stories
- Recent Developments
- Competition Deep Dive
- Assumptions & Acronyms Used


