

- Market Size (2026)
- USD 6466.4 Mn
- Forecast (2036)
- USD 16172.2 Mn
- CAGR (2026 to 2036)
- 9.6%
How big is the Metabolic Nutrition Ingredients Market in 2026?
USD 6,466.4 million in 2026 and USD 16,172.2 million by 2036 at a 9.6% CAGR.
The metabolic nutrition ingredients market was valued at USD 5,900.0 million in 2025. It is expected to expand from USD 6,466.4 million in 2026 to USD 16,172.2 million by 2036 at 9.6% CAGR. Metabolic strain is moving formulation work from broad wellness claims into measurable sugar and satiety briefs. Fiber enrichment and protein fortification now sit inside the same product development file. The World Health Organization reported in March 2024 that more than 1 billion people were living with obesity. The statistic gives food manufacturers a clearer reason to reformulate everyday products using functional food ingredients that support taste and claim discipline.
Beverage formulators and nutraceutical brands are expected to purchase metabolic nutrition ingredients if reformulation risk reaches the launch calendar. They need powders and fibers that survive processing without creating off-notes or sediment. FDA stated in its 2024 healthy claim final rule that about 5% of foods were labeled healthy in the marketplace. The limited label base pushes teams to connect dietary supplement demand with substantiated nutrient content and cleaner product files. Ingredient partners receive consideration when they shorten sensory review and label substantiation work.
From sourcing to shelf review, product value is expected to rise if ingredient files travel cleanly across the use chain. Food manufacturers in North America and Europe are likely to weight documentation and retailer acceptance before format expansion. Higher-growth Asian markets are projected to weight localization and faster digital retail access. FDA confirmed in 2024 that food facilities follow CGMP and preventive-control requirements under Part 117. The governance backdrop links specialty food ingredients to audit-ready formulation support. Sourcing teams face a practical choice between catalogue supply and application-backed scale-up.
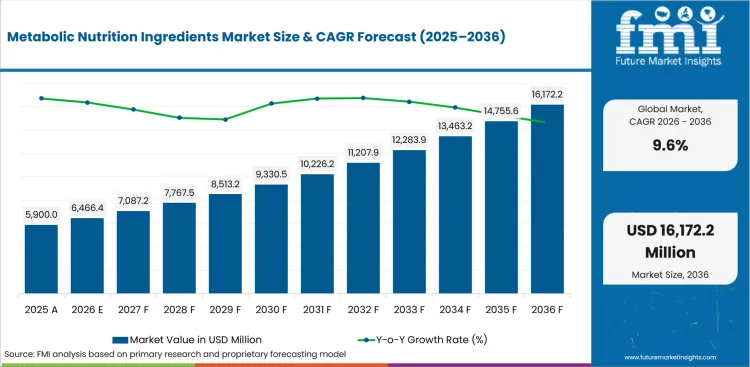
Summary of the Metabolic Nutrition Ingredients Market
| Market Signal | Commercial Impact |
|---|---|
| Demand and Growth Drivers | Demand is expected to be driven by reformulation pressure and proof needs across food and beverage projects. Launch urgency is reinforced by documentation requests from retailers and quality teams.
|
| Product and Segment View | Powder, plant sources, beverages, food manufacturers, and North America lead their respective parent categories in 2026. Channel position is shaped by formulation transfer and regulated product documentation.
|
| Geography and Growth Outlook | India and China are expected to form the higher-growth tier due to food processing expansion and digital retail pull. The United States, South Korea, the United Kingdom, Germany, and Japan are likely to advance through documentation-led adoption.
|
| Competitive Landscape | Competition is moderately concentrated around global ingredient platforms and specialist application support. Procurement screening centers on documented performance and the ability to defend reformulation claims inside retail review.
|
| Analyst Perspective | The core adoption factor is proof that a metabolic ingredient works in the final food matrix. Long-term retention is expected to depend on sensory help, claim files, and repeat supply control.
|
How is the Metabolic Nutrition Ingredients Market segmented?
The metabolic nutrition ingredients industry is segmented by product type, source, application, end user, and region.
The metabolic nutrition ingredients market is segmented by product type, source, application, end user, and region. Product type covers powder, liquid, granules, encapsulated ingredients, and premix formats. Source covers plant, microbial, animal, marine, and synthetic ingredients. Application covers bakery, beverages, dairy, snacks, and infant nutrition. End user covers food manufacturers, foodservice, private label, nutraceutical brands, and retail accounts. Regional coverage includes North America, Latin America, Western Europe, Eastern Europe, East Asia, South Asia and Pacific, and Middle East and Africa for products aligned with clean-label ingredients. The structure separates product form decisions from source evaluation and end-user role within the final scope.
How does powder shape demand within the product type category?
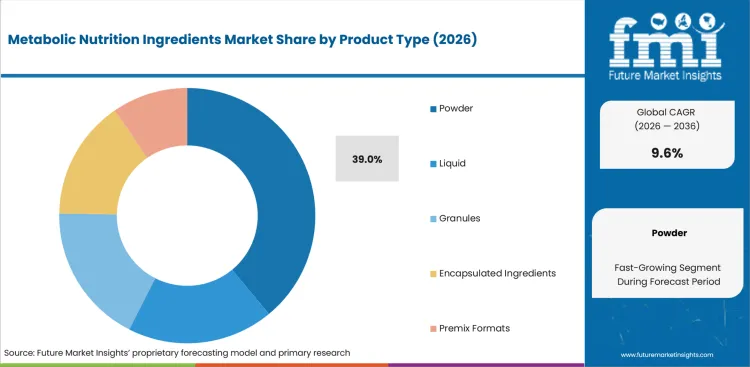
Powder formats fit factories that already rely on dry blending and premix preparation. Metabolic ingredients often carry fiber and protein functions that need controlled dosing before heat and shelf-life tests. Sweetening or botanical roles require the same discipline during formulation trials.
- Based on product type, powder is projected to account for 39.0% demand in 2026 due to premix compatibility and lower water-activity risk. Written production controls under FDA Part 117 explain why food manufacturers prefer formats that simplify dosing records before audited line trials. The format also supports inventory control for multi-line plants that need repeatable handling before retail account approval.
- Powder is witnessing demand from food manufacturers owing to storage efficiency and easier transfer from pilot batches to commercial lines. Application teams using protein ingredients value formats that support dry blending before taste checks, reducing failed line trials and reformulation cost. This format reduces changeover pressure for plant teams that must protect nutrition claims and line efficiency together.
What supports demand for plant source choices?
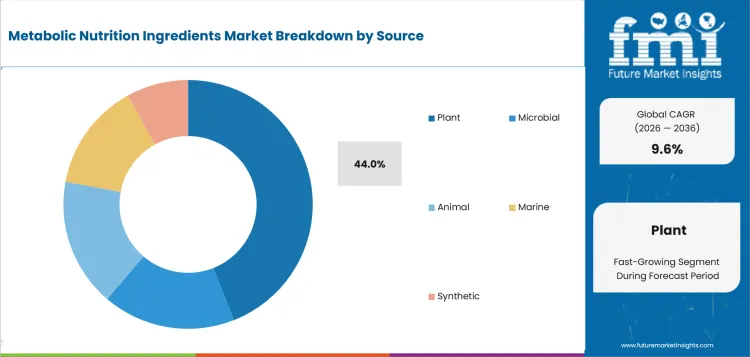
Plant-sourced ingredients are close to clean-label and plant-forward formulation work, and food manufacturers need proof that plant proteins and fibers behave inside finished matrices. Botanical extracts must also show stable behavior before scale-up. Roquette expanded its NUTRALYS plant protein portfolio in June 2025 with textured wheat and pea proteins. The portfolio move shows how plant source choices are becoming more application-specific.
- By source, plant is estimated to hold 44.0% share in 2026 owing to clean-label alignment and broader use in fiber and protein systems. Roquette’s June 2025 addition of textured wheat and pea proteins supports wider plant ingredient testing among food manufacturers. The source position also gives brands a clearer route into vegan and flexitarian product briefs.
- Demand for plant source ingredients is expected to grow among formulators attributable to allergen planning and label transparency. Teams working on plant-based protein also need taste masking and sourcing assurance before wider product rollout. Source continuity remains part of the purchase screen when crop-linked inputs affect cost and flavor consistency.
How do beverages influence application demand?
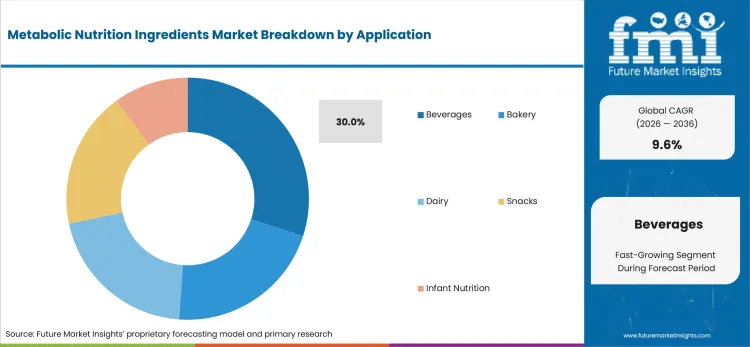
Beverages expose weak solubility and bitterness faster than many solid formats. A metabolic ingredient that works in powder blends still needs pH stability and suspension control. Flavor compatibility then becomes the next approval screen in liquid systems. Beverage formulators treat application support as part of ingredient selection. The category rewards ingredients that keep the nutrition claim visible without damaging repeat purchase.
- By application, beverages are forecast to represent 30.0% share in 2026 driven by visible nutrition positioning in ready-to-drink and powdered formats. Solubility tests and aftertaste control explain why beverage briefs require early application work before retail launch. The application share is tied to repeat purchase risk because poor mouthfeel appears immediately in drink formats.
- Beverage formulators are increasingly purchasing metabolic ingredients led by sugar reduction and fiber enrichment targets. Low-calorie sweeteners are often evaluated alongside texture tools, which keeps taste correction linked to ingredient approval. These projects require suppliers that prove stability before online listings and chilled retail programs expand.
How do food manufacturers evaluate end-user fit?
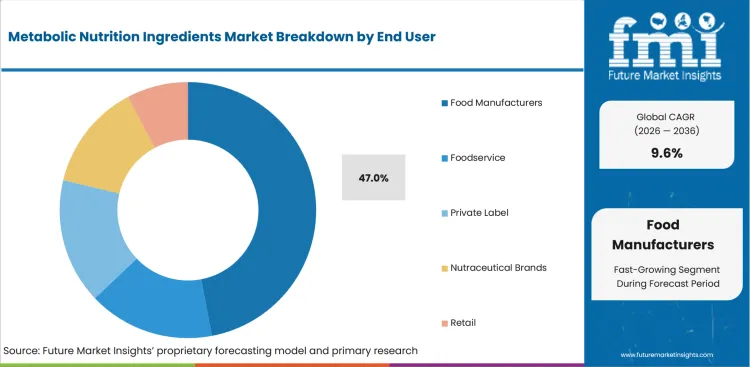
Food manufacturers carry the operating risk after ingredient selection. Failed taste tests and shelf-life problems create direct launch delays inside food projects. Unsupported nutrient claims add another delay risk inside bakery and beverage programs. Dairy and snack programs face the same review pressure.
- Food manufacturers are anticipated to account for 47.0% end-user demand in 2026 reinforced by direct responsibility for formulation success. The FDA healthy claim final rule noted about 5% of foods carried healthy labels, which raises pressure to document nutrient-positioned changes. The end-user share reflects accountability for taste performance and claim language after ingredient substitution.
- Purchase activity for food manufacturers is anticipated to rise driven by the need to combine nutrition claims and process stability. Application support receives attention when ingredient changes affect mouthfeel and viscosity. Heat tolerance or shelf-life performance also needs proof during commercial trials. Sourcing teams also need suppliers that stay involved after pilot approval and line validation.
What are the drivers, restraints, and opportunities in the Metabolic Nutrition Ingredients Market?
Near-term purchases are being shaped by reformulation pressure, sensory failure risk, and matrix-specific service routes outlined below.
- Driver: Reformulation around sugar reduction and fiber enrichment is expected to push spending toward metabolic ingredients that work in finished foods.
- Restraint: Weak claim files and sensory failures are likely to slow supplier approval before broader product rollout.
- Opportunity: Application-backed ingredient systems are projected to open access across beverage and snack projects. Dairy and specialized nutrition create another route.
Food and beverage teams are expected to increase ingredient spending when nutrition targets become line-level problems. Kerry launched Smart Taste in September 2025 to help food and beverage manufacturers address nutrition and supply stability without losing taste. The launch points to a wider operating need for ingredients that combine taste correction and nutrient positioning. Formulators are likely to favor partners that solve sensory risk before commercial approval.
Regulatory review is anticipated to slow adoption where claims and process controls lack clear ownership. FDA’s 2024 healthy claim final rule gave manufacturers a revised voluntary claim framework for qualifying foods. The framework pushes product teams to connect nutrient content and ingredient use before retail listing. Label evidence remains part of the same approval file.
Matrix-specific service is projected to create access for suppliers that combine ingredient breadth and application teams. Beverage and dairy programs often need proteins and fibers evaluated together. The route aligns with plant-based beverage ingredients in projects that require clean labels and sensory control.
Which country CAGRs are profiled in the Metabolic Nutrition Ingredients Market?
.webp "Top Country Growth Comparison Metabolic Nutrition Ingredients Market Cagr (2026 2036)")
| Country | CAGR |
|---|---|
| United States | 5.8% |
| China | 7.2% |
| India | 8.6% |
| Germany | 4.9% |
| United Kingdom | 5.3% |
| Japan | 4.1% |
| South Korea | 5.6% |
Source: FMI's proprietary forecasting model and primary research
How do country-level CAGRs compare in the Metabolic Nutrition Ingredients Market?
Country outlook for metabolic nutrition ingredients is expected to be shaped by food processing expansion, digital retail pull and documentation-led reformulation. Buyer decisions are likely to depend on sensory performance, batch files and application support that protects launch timelines. Opportunities are expected to expand in countries where suppliers help brands move from metabolic claims to scalable reformulation.
- By 2036, the United States is projected to grow at 5.8% CAGR, supported by diabetes-focused product reformulation and FDA label governance across functional foods. CDC reported 40.1 million people with diagnosed or undiagnosed diabetes in the United States in 2023. The figure directs food manufacturers toward ingredients that support sugar reduction and fiber enrichment. Satiety language also needs evidence inside everyday foods. The local challenge is claim substantiation across retail and supplement channels that compare nutrient wording against finished-product proof.
- China's metabolic nutrition ingredients outlook is anticipated to advance at 7.2% CAGR over the assessment period, driven by packaged food e-commerce and localized beverage reformulation across online retail platforms. The National Bureau of Statistics of China reported that online retail sales of food rose 14.5% in 2025. The metric points food and beverage manufacturers toward ingredients that keep nutrition claims searchable and taste performance consistent online. The local adoption constraint is rapid SKU churn and pressure to prepare channel-ready product data before digital launch.
- Metabolic nutrition ingredient demand in India is forecast to rise at 8.6% CAGR over the forecast period, attributable to processed food exports and local fortification projects among packaged food manufacturers. APEDA's annual administrative report placed scheduled product exports at USD 28.59 billion in 2024-25. Export exposure pushes processors to use ingredients that support documentation and shelf stability. Local opportunity is tied to beverage powders and dairy formats. Snacks serving urban wellness channels create another route in modern retail stores.
- Adoption of metabolic nutrition ingredients in Germany is estimated to expand at 4.9% CAGR through 2036, owing to scale manufacturing and careful food claims review. Eurostat showed Germany represented 26% of EU sold production value in 2024. The manufacturing base supports demand for formulation-grade fibers and proteins. Sweetening systems also serve regulated food categories and premium retailer formats. The local constraint is slower approval for ingredients that lack sensory proof and documentation depth under EU channel review and retailer quality checks.
- The United Kingdom metabolic nutrition ingredients sector is projected to record 5.3% CAGR during the assessment period, reinforced by food manufacturing scale and retailer nutrition screening. The Office for National Statistics reported that food products represented 21% of UK manufacturers' product sales in 2024. The food manufacturing weight gives reformulation suppliers a clear route into bakery and beverage programs. Local challenge centers on retailer acceptance and cost control during recipe changes in private label categories and chilled beverage formats.
- In Japan metabolic nutrition ingredient demand is predicted to advance at 4.1% CAGR through 2036, shaped by function-claim discipline and evidence review. Japan's Consumer Affairs Agency verified analytical-method data for 98 Foods with Function Claims in fiscal 2024. The review culture makes ingredient documentation central before product managers approve metabolic-positioned claims for powders and beverages.
- South Korea is estimated to post 5.6% CAGR over the forecast period, influenced by functional food registration discipline and digital wellness channels. The USA International Trade Administration reported that Korea had 444 individually approved functional ingredients as of June 2025. The approval base supports ingredient screening for metabolic nutrition products that need clinical or functional substantiation before commerce and platform listings.
Who are the notable companies in the Metabolic Nutrition Ingredients Market?
ADM, Kerry, DSM-Firmenich, IFF, Ingredion, Tate & Lyle, Givaudan, and Roquette are the notable companies shaping this market.
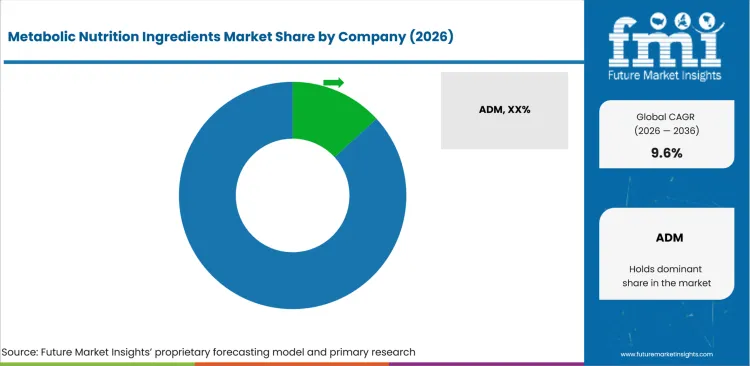
The competitive structure is moderately concentrated around global ingredient houses that combine nutrition inputs and application support. Established multinational platforms hold wider portfolios and regional account access. Regional specialists and smaller application-led firms compete in narrower briefs around clean labels and taste correction. Plant source positioning creates another entry route. Competition is projected to focus on documentation quality and sensory performance. Service continuity also carries more emphasis than ingredient availability alone. The link between sugar substitute systems and texture rebuilding makes application support a clear commercial screen for sourcing teams.
- Integrated nutrition-science portfolios give ADM and dsm-firmenich a broad account route across food projects. IFF adds reach in nutraceutical applications. These companies compete where manufacturers need fibers and proteins inside one sourcing discussion. Microbiome inputs and substantiation support extend the same account route.
- Taste and sensory correction define another competitive lane for Kerry and Givaudan. Their relevance increases in beverage and dairy formats that lose repeat purchase after flavor defects. Snack formats also need support when mouthfeel defects remain unresolved. Food manufacturers use these partners to protect reformulation programs from flavor failure.
- Sugar reduction and texture rebuilding place Ingredion and Tate & Lyle close to metabolic formulation briefs. Both companies serve accounts that need sweetening systems and fibers. Texturants and application testing complete the reformulation case. Their commercial role is clearest when calorie reduction must preserve texture and label acceptance.
- Plant-forward nutrition briefs give Roquette a visible route in protein and fiber projects. The company aligns with manufacturers that need plant source options and cleaner ingredient panels. Application-backed plant platforms are expected to receive wider consideration when cost and texture are reviewed together.
Competitive Benchmarking: Metabolic Nutrition Ingredients Market
| Company | Metabolic Ingredient Breadth | Application Lab Support | Sensory and Mouthfeel Fit | Regulatory File Depth | Regional Reach |
|---|---|---|---|---|---|
| ADM | High | Strong | Medium | Strong | Global |
| Kerry | Medium | Strong | Strong | Medium | Global |
| dsm-firmenich | High | Strong | Strong | Strong | Global |
| IFF | High | Strong | Strong | Strong | Global |
| Ingredion | High | Strong | Strong | Medium | Global |
| Tate & Lyle | High | Strong | Strong | Medium | Global |
| Givaudan | Medium | Strong | Strong | Medium | Global |
| Roquette | Medium | Strong | Medium | Medium | Global |
Source: Future Market Insights competitive analysis, 2026. Ratings reflect relative portfolio relevance and workflow fit. Service capability and geographic reach shape the remaining comparison.
Key Developments in the Metabolic Nutrition Ingredients Market
- In April 2025, dsm-firmenich announced that it would highlight Healthy Longevity and Health from the Gut solutions at Vitafoods Europe 2025. The portfolio included Humiome probiotic and postbiotic formulations for nutrition applications.
- In June 2025, Roquette expanded the NUTRALYS plant protein portfolio with textured wheat and pea protein ingredients. The additions included wheat and pea formats designed for plant-based food applications. The launch is expected to widen options for food manufacturers seeking protein enrichment and cleaner source positioning.
- In July 2025, Tate & Lyle announced an expanded portfolio showcase and Mouthfeel Lab activity at IFT FIRST 2025. The company planned four prototypes after its combination with CP Kelco. The development signals a shift toward texture-led formulation support in healthier food and beverage projects.
- In July 2025, Ingredion presented texture and health concepts at IFT FIRST 2025 for food and beverage manufacturers. The showcase included reduced-sugar and protein-focused prototype concepts that linked texture to nutrition goals.
Key Players in the Metabolic Nutrition Ingredients Market
Global nutrition and bioscience platforms
- ADM
- dsm-firmenich
- IFF
Taste, texture, and reformulation specialists
- Kerry
- Givaudan
- Ingredion
- Tate & Lyle
Plant protein and fiber specialists
- Roquette
Metabolic Nutrition Ingredients Market - Report Scope
| Coverage field | Report scope |
|---|---|
| Market breakdown | Metabolic Nutrition Ingredients Market Breakdown By Product Type, Source, Application, End User, and Region |
| Market Definition | Metabolic nutrition ingredients are functional food and supplement inputs used by manufacturers to support sugar reduction, fiber enrichment, protein fortification, satiety positioning, and metabolic-health claims. |
| Regions Covered | North America, Latin America, Western Europe, Eastern Europe, East Asia, South Asia and Pacific, and Middle East and Africa |
| Countries Covered | United States, China, India, Germany, United Kingdom, Japan, South Korea, Canada, Mexico, Brazil, France, Italy, Spain, ASEAN, GCC Countries, South Africa, Turkiye, and 30+ countries |
| Key Companies Profiled | ADM, Kerry, DSM-Firmenich, IFF, Ingredion, Tate & Lyle, Givaudan, and Roquette |
| Forecast Period | 2026 to 2036 |
| Approach | Hybrid bottom-up and top-down methodology using product type adoption rates, source mix, application trials, country-level retail signals, and supplier portfolio depth |
Source: Future Market Insights - analysis driven by proprietary forecasting models and primary research
Metabolic Nutrition Ingredients Market - Research Methodology
| Method | Approach |
|---|---|
| Primary Research | FMI analysts gathered input from manufacturers, service providers, technology developers, distributors, end users, procurement teams, and subject-matter experts. Interviews examined purchasing decisions, product or service evaluation, adoption barriers, approval requirements, pricing considerations, and expectations for technical or commercial support. Respondents were also asked what evidence is required before a trial, pilot, or initial order develops into regular purchasing. |
| Desk Research | Desk research covered government statistics, regulatory publications, trade data, industry associations, technical literature, standards, company filings, product information, and official corporate announcements. Sources were reviewed for relevance, publication date, geographic coverage, and consistency with the defined market scope. Claims relating to performance, applications, approvals, capacity, investment, and commercial activity were retained only when supported by credible public evidence. |
| Market Sizing and Forecasting | The market model combined the baseline value with historical performance, segment structure, pricing and volume indicators, adoption levels, company participation, and country-level demand conditions. Forecast assumptions considered economic activity, investment trends, regulatory developments, technology adoption, purchasing cycles, supply availability, and barriers to wider market use. Segment and regional estimates were reconciled before the final market total was calculated. |
| Data Validation | Estimates were checked against multiple independent indicators, including public data, company activity, trade patterns, industry developments, and findings from primary interviews. Validation also tested whether products, services, applications, and company revenues fell within the defined market boundaries. Adjacent categories, unsupported claims, overlapping revenues, and activities without direct market relevance were excluded to reduce double counting and maintain consistency across segments and countries. |
Metabolic Nutrition Ingredients Market by Segments
Metabolic Nutrition Ingredients Market segmented by Product Type:
- Powder
- Liquid
- Granules
- Encapsulated Ingredients
- Premix Formats
Metabolic Nutrition Ingredients Market segmented by Source:
- Plant
- Microbial
- Animal
- Marine
- Synthetic
Metabolic Nutrition Ingredients Market segmented by Application:
- Bakery
- Beverages
- Dairy
- Snacks
- Infant Nutrition
Metabolic Nutrition Ingredients Market segmented by End User:
- Food Manufacturers
- Foodservice
- Private Label
- Nutraceutical Brands
- Retail
Metabolic Nutrition Ingredients Market by Region:
- North America
- United States
- Canada
- Latin America
- Brazil
- Mexico
- Chile
- Rest of Latin America
- Western Europe
- Germany
- United Kingdom
- France
- Italy
- Spain
- Nordic
- BENELUX
- Rest of Western Europe
- Eastern Europe
- Poland
- Russia
- Rest of Eastern Europe
- East Asia
- China
- Japan
- South Korea
- South Asia and Pacific
- India
- ASEAN
- Australia and New Zealand
- Rest of South Asia and Pacific
- Middle East and Africa
- GCC Countries
- South Africa
- Turkiye
- Rest of Middle East and Africa
Research Sources and Bibliography
- World Health Organization. (2024, March). One in eight people are now living with obesity. World Health Organization.
- Centers for Disease Control and Prevention. (2026, January). National Diabetes Statistics Report. Centers for Disease Control and Prevention.
- USA Food and Drug Administration. (2024, December). Nutrient Content Claims; Definition of Term “Healthy” (Final Rule). USA Food and Drug Administration.
- USA Food and Drug Administration. (2024, April). Current Good Manufacturing Practices (CGMPs) for Food and Dietary Supplements. USA Food and Drug Administration.
- National Bureau of Statistics of China. (2026, January). Total Retail Sales of Consumer Goods in December 2025. National Bureau of Statistics of China.
- Agricultural and Processed Food Products Export Development Authority. (2026, April). Annual Administrative Report 2024-25. Government of India Ministry of Commerce and Industry.
- Eurostat. (2026, June). Industrial production statistics. European Commission.
- Office for National Statistics. (2025, July). UK manufacturers' sales by product: 2024. Office for National Statistics.
- International Trade Administration. (2025, July). South Korea Health Functional Food. USA Department of Commerce.
- DSM-Firmenich. (2025, April). From cellular aging to gut microbiome: dsm-firmenich highlights solutions to advance nutrition at Vitafoods 2025. DSM-Firmenich.
- Roquette. (2025, June). NUTRALYS® Portfolio: New Textured Wheat and Pea Proteins. Roquette.
- Tate & Lyle. (2025, July). Tate & Lyle debuts expanded portfolio and mouthfeel leadership at IFT FIRST 2025. Tate & Lyle.
- Kerry. (2025, September). Kerry Launches Smart TasteTM to Help Customers Navigate Market Complexities Without Compromising on Taste. Kerry.
- Ingredion. (2025, July). Ingredion at IFT FIRST 2025 - Connecting texture, health and innovation. Ingredion.
This bibliography is provided for reader reference and uses primary government, standards-body, official trade body, and company sources.
This Report Answers
- What value is the metabolic nutrition ingredients market estimated to reach in 2026 and 2036?
- What CAGR is forecast for the metabolic nutrition ingredients market from 2026 to 2036?
- Which parent segments shape demand across the metabolic nutrition ingredients industry?
- Which reformulation pressures support purchase activity across food and beverage accounts?
- How do country CAGRs differ across the profiled markets?
- Which companies compete across application support and documentation depth?
- How does FMI validate forecasts and avoid duplicate statistics in this analysis?
- What should food manufacturers address before broader sourcing commitments?
- How does label review and claims documentation affect ingredient supplier selection?
Frequently Asked Questions
Why should executives track the Metabolic Nutrition Ingredients Market?
Executives should track the Metabolic Nutrition Ingredients Market because it links metabolic-health positioning with reformulation risk in everyday food products.
What business problem does the Metabolic Nutrition Ingredients Market address?
The market addresses the need to reduce sugar and add fiber while maintaining taste, supporting protein enrichment and satiety claims without compromising shelf-life performance.
What should procurement leaders evaluate before selecting ingredient suppliers?
Procurement leaders should evaluate application support, claim documentation, batch consistency, sensory correction capability, and supply continuity before awarding programs.
What limits return on investment for food manufacturers?
Return on investment is limited by taste failure, permitted-use uncertainty, viscosity changes, and label risk, while delayed retailer acceptance can further reduce return timing.
How do ingredient suppliers build long-term account confidence?
Ingredient suppliers build long-term account confidence by providing finished-matrix evidence, stable specification files, regulatory support, and rapid troubleshooting during scale-up.
Which segment positions shape procurement activity?
Powder and plant-source segments shape procurement activity due to handling compatibility, while beverages and food manufacturers increase documentation requirements and North America reinforces screening through label governance.
How do country CAGRs differ across profiled markets?
India and China are forecast to grow faster than the other profiled countries due to processing expansion and the growth of digital food channels.
Preview the report firsthand - request a free sample
Get SampleGet the brochure for pricing and purchase details.
Get PDFTable of Content
- Key Takeaways
- Market Size and CAGR
- Top Growth Driver
- Fastest Growing Segment
- Leading Region
- Key Companies
- Emerging Opportunities
- Executive Summary
- Global Market Outlook
- Demand-side Trends
- Supply-side Trends
- Technology Roadmap Analysis
- Analysis and Recommendations
- Analyst Perspective (What is happening? Why now? What should investors know?)
- Key Questions Answered
- How large is the market?
- What is the CAGR?
- What are key trends?
- Which region dominates?
- Who are the leaders?
- Market Overview
- Market Coverage / Taxonomy
- Market Definition / Scope / Limitations
- Research Methodology
- Chapter Orientation
- Analytical Lens and Working Hypotheses
- Market Structure, Signals, and Trend Drivers
- Benchmarking and Cross-market Comparability
- Market Sizing, Forecasting, and Opportunity Mapping
- Research Design and Evidence Framework
- Desk Research Programme (Secondary Evidence)
- Expert Input and Fieldwork (Primary Evidence)
- Tooling, Models, and Reference Databases
- Data Engineering and Model Build
- Quality Assurance and Audit Trail
- Market Background
- Market Dynamics (Drivers, Restraints, Opportunity, Trends)
- Scenario Forecast (Optimistic, Likely, Conservative)
- Impact Analysis
- AI Impact
- Sustainability Impact
- Regulatory Impact
- Technology Impact
- Consumer / Buyer Analysis
- Purchase Drivers
- Adoption Barriers
- Buyer Journey
- Opportunity Map Analysis
- Product Life Cycle Analysis
- Supply Chain Analysis
- Investment Feasibility Matrix
- Value Chain Analysis
- PESTLE and Porter's Analysis
- Regulatory Landscape
- Regional Parent Market Outlook
- Production and Consumption Statistics
- Import and Export Statistics
- Global Market Analysis and Forecast, 2021 to 2036
- Historical Market Size Value (USD Million) & Volume (Unit) Analysis, 2021 to 2025
- Current and Future Market Size Value (USD Million) & Volume (Unit) Projections, 2026 to 2036
- Y-o-Y Growth Trend Analysis
- Absolute $ Opportunity Analysis
- Global Market Pricing Analysis, 2021 to 2036
- Global Market Analysis and Forecast, By Product Type, 2021 to 2036
- Introduction / Key Findings
- Historical Market Size Value (USD Million) & Volume (Unit) Analysis By Product Type, 2021 to 2025
- Current and Future Market Size Value (USD Million) & Volume (Unit) Analysis and Forecast By Product Type, 2026 to 2036
- Powder
- Liquid
- Granules
- Encapsulated Ingredients
- Premix Formats
- Powder
- Y-o-Y Growth Trend Analysis By Product Type, 2021 to 2025
- Absolute $ Opportunity Analysis By Product Type, 2026 to 2036
- Global Market Analysis and Forecast, By Source, 2021 to 2036
- Introduction / Key Findings
- Historical Market Size Value (USD Million) & Volume (Unit) Analysis By Source, 2021 to 2025
- Current and Future Market Size Value (USD Million) & Volume (Unit) Analysis and Forecast By Source, 2026 to 2036
- Plant
- Microbial
- Animal
- Marine
- Synthetic
- Plant
- Y-o-Y Growth Trend Analysis By Source, 2021 to 2025
- Absolute $ Opportunity Analysis By Source, 2026 to 2036
- Global Market Analysis and Forecast, By Application, 2021 to 2036
- Introduction / Key Findings
- Historical Market Size Value (USD Million) & Volume (Unit) Analysis By Application, 2021 to 2025
- Current and Future Market Size Value (USD Million) & Volume (Unit) Analysis and Forecast By Application, 2026 to 2036
- Beverages
- Bakery
- Dairy
- Snacks
- Infant Nutrition
- Beverages
- Y-o-Y Growth Trend Analysis By Application, 2021 to 2025
- Absolute $ Opportunity Analysis By Application, 2026 to 2036
- Global Market Analysis and Forecast, By End User, 2021 to 2036
- Introduction / Key Findings
- Historical Market Size Value (USD Million) & Volume (Unit) Analysis By End User, 2021 to 2025
- Current and Future Market Size Value (USD Million) & Volume (Unit) Analysis and Forecast By End User, 2026 to 2036
- Food Manufacturers
- Foodservice
- Private Label
- Nutraceutical Brands
- Retail
- Food Manufacturers
- Y-o-Y Growth Trend Analysis By End User, 2021 to 2025
- Absolute $ Opportunity Analysis By End User, 2026 to 2036
- Global Market Analysis and Forecast, By Region, 2021 to 2036
- Introduction
- Historical Market Size Value (USD Million) & Volume (Unit) Analysis By Region, 2021 to 2025
- Current Market Size Value (USD Million) & Volume (Unit) Analysis and Forecast By Region, 2026 to 2036
- North America
- Latin America
- Western Europe
- Eastern Europe
- East Asia
- South Asia and Pacific
- Middle East & Africa
- Market Attractiveness Analysis By Region
- North America Market Analysis and Forecast, By Country, 2021 to 2036
- Historical Market Size Value (USD Million) & Volume (Unit) Trend Analysis By Market Taxonomy, 2021 to 2025
- Market Size Value (USD Million) & Volume (Unit) Forecast By Market Taxonomy, 2026 to 2036
- By Country
- USA
- Canada
- Mexico
- By Product Type
- By Source
- By Application
- By End User
- By Country
- Market Attractiveness Analysis
- By Country
- By Product Type
- By Source
- By Application
- By End User
- Key Takeaways
- Latin America Market Analysis and Forecast, By Country
- Historical Market Size Value (USD Million) & Volume (Unit) Trend Analysis By Market Taxonomy, 2021 to 2025
- Market Size Value (USD Million) & Volume (Unit) Forecast By Market Taxonomy, 2026 to 2036
- By Country
- Brazil
- Chile
- Rest of Latin America
- By Product Type
- By Source
- By Application
- By End User
- By Country
- Market Attractiveness Analysis
- By Country
- By Product Type
- By Source
- By Application
- By End User
- Key Takeaways
- Western Europe Market Analysis and Forecast, By Country
- Historical Market Size Value (USD Million) & Volume (Unit) Trend Analysis By Market Taxonomy, 2021 to 2025
- Market Size Value (USD Million) & Volume (Unit) Forecast By Market Taxonomy, 2026 to 2036
- By Country
- Germany
- UK
- Italy
- Spain
- France
- Nordic
- BENELUX
- Rest of Western Europe
- By Product Type
- By Source
- By Application
- By End User
- By Country
- Market Attractiveness Analysis
- By Country
- By Product Type
- By Source
- By Application
- By End User
- Key Takeaways
- Eastern Europe Market Analysis and Forecast, By Country
- Historical Market Size Value (USD Million) & Volume (Unit) Trend Analysis By Market Taxonomy, 2021 to 2025
- Market Size Value (USD Million) & Volume (Unit) Forecast By Market Taxonomy, 2026 to 2036
- By Country
- Russia
- Poland
- Hungary
- Balkan & Baltic
- Rest of Eastern Europe
- By Product Type
- By Source
- By Application
- By End User
- By Country
- Market Attractiveness Analysis
- By Country
- By Product Type
- By Source
- By Application
- By End User
- Key Takeaways
- East Asia Market Analysis and Forecast, By Country
- Historical Market Size Value (USD Million) & Volume (Unit) Trend Analysis By Market Taxonomy, 2021 to 2025
- Market Size Value (USD Million) & Volume (Unit) Forecast By Market Taxonomy, 2026 to 2036
- By Country
- China
- Japan
- South Korea
- By Product Type
- By Source
- By Application
- By End User
- By Country
- Market Attractiveness Analysis
- By Country
- By Product Type
- By Source
- By Application
- By End User
- Key Takeaways
- South Asia and Pacific Market Analysis and Forecast, By Country
- Historical Market Size Value (USD Million) & Volume (Unit) Trend Analysis By Market Taxonomy, 2021 to 2025
- Market Size Value (USD Million) & Volume (Unit) Forecast By Market Taxonomy, 2026 to 2036
- By Country
- India
- ASEAN
- Australia & New Zealand
- Rest of South Asia and Pacific
- By Product Type
- By Source
- By Application
- By End User
- By Country
- Market Attractiveness Analysis
- By Country
- By Product Type
- By Source
- By Application
- By End User
- Key Takeaways
- Middle East & Africa Market Analysis and Forecast, By Country
- Historical Market Size Value (USD Million) & Volume (Unit) Trend Analysis By Market Taxonomy, 2021 to 2025
- Market Size Value (USD Million) & Volume (Unit) Forecast By Market Taxonomy, 2026 to 2036
- By Country
- Kingdom of Saudi Arabia
- Other GCC Countries
- Türkiye
- South Africa
- Other African Union
- Rest of Middle East & Africa
- By Product Type
- By Source
- By Application
- By End User
- By Country
- Market Attractiveness Analysis
- By Country
- By Product Type
- By Source
- By Application
- By End User
- Key Takeaways
- Key Countries Market Analysis
- USA
- Pricing Analysis
- Market Share Analysis, 2025
- By Product Type
- By Source
- By Application
- By End User
- Canada
- Pricing Analysis
- Market Share Analysis, 2025
- By Product Type
- By Source
- By Application
- By End User
- Mexico
- Pricing Analysis
- Market Share Analysis, 2025
- By Product Type
- By Source
- By Application
- By End User
- Brazil
- Pricing Analysis
- Market Share Analysis, 2025
- By Product Type
- By Source
- By Application
- By End User
- Chile
- Pricing Analysis
- Market Share Analysis, 2025
- By Product Type
- By Source
- By Application
- By End User
- Germany
- Pricing Analysis
- Market Share Analysis, 2025
- By Product Type
- By Source
- By Application
- By End User
- UK
- Pricing Analysis
- Market Share Analysis, 2025
- By Product Type
- By Source
- By Application
- By End User
- Italy
- Pricing Analysis
- Market Share Analysis, 2025
- By Product Type
- By Source
- By Application
- By End User
- Spain
- Pricing Analysis
- Market Share Analysis, 2025
- By Product Type
- By Source
- By Application
- By End User
- France
- Pricing Analysis
- Market Share Analysis, 2025
- By Product Type
- By Source
- By Application
- By End User
- India
- Pricing Analysis
- Market Share Analysis, 2025
- By Product Type
- By Source
- By Application
- By End User
- ASEAN
- Pricing Analysis
- Market Share Analysis, 2025
- By Product Type
- By Source
- By Application
- By End User
- Australia & New Zealand
- Pricing Analysis
- Market Share Analysis, 2025
- By Product Type
- By Source
- By Application
- By End User
- China
- Pricing Analysis
- Market Share Analysis, 2025
- By Product Type
- By Source
- By Application
- By End User
- Japan
- Pricing Analysis
- Market Share Analysis, 2025
- By Product Type
- By Source
- By Application
- By End User
- South Korea
- Pricing Analysis
- Market Share Analysis, 2025
- By Product Type
- By Source
- By Application
- By End User
- Russia
- Pricing Analysis
- Market Share Analysis, 2025
- By Product Type
- By Source
- By Application
- By End User
- Poland
- Pricing Analysis
- Market Share Analysis, 2025
- By Product Type
- By Source
- By Application
- By End User
- Hungary
- Pricing Analysis
- Market Share Analysis, 2025
- By Product Type
- By Source
- By Application
- By End User
- Kingdom of Saudi Arabia
- Pricing Analysis
- Market Share Analysis, 2025
- By Product Type
- By Source
- By Application
- By End User
- Türkiye
- Pricing Analysis
- Market Share Analysis, 2025
- By Product Type
- By Source
- By Application
- By End User
- South Africa
- Pricing Analysis
- Market Share Analysis, 2025
- By Product Type
- By Source
- By Application
- By End User
- USA
- Market Structure Analysis
- Competition Dashboard
- Competition Benchmarking
- Market Share Analysis of Top Players
- By Regional
- By Product Type
- By Source
- By Application
- By End User
- Emerging Startups
- Innovation Benchmarking
- Competition Analysis
- Competition Deep Dive
- ADM
- Overview
- Product Portfolio
- Profitability by Market Segments (Product/Region/Sales Channel)
- Sales Footprint
- Strategy Overview
- Marketing Strategy
- Product Strategy
- Channel Strategy
- Kerry
- DSM-Firmenich
- IFF
- Ingredion
- Tate & Lyle
- Givaudan
- Roquette
- ADM
- Case Studies
- Success Stories
- Recent Developments
- Competition Deep Dive
- Assumptions & Acronyms Used


